Exam 14: Introduction to Linear Regression and Correlation Analysis
Exam 1: The Where, Why, and How of Data Collection167 Questions
Exam 2: Graphs, Charts and Tablesdescribing Your Data138 Questions
Exam 3: Describing Data Using Numerical Measures138 Questions
Exam 4: Introduction to Probability125 Questions
Exam 5: Discrete Probability Distributions161 Questions
Exam 6: Introduction to Continuous Probability Distributions122 Questions
Exam 7: Introduction to Sampling Distributions136 Questions
Exam 8: Estimating Single Population Parameters174 Questions
Exam 9: Introduction to Hypothesis Testing183 Questions
Exam 10: Estimation and Hypothesis Testing for Two Population Parameters121 Questions
Exam 11: Hypothesis Tests and Estimation for Population Variances69 Questions
Exam 12: Analysis of Variance162 Questions
Exam 13: Goodness-Of-Fit Tests and Contingency Analysis105 Questions
Exam 14: Introduction to Linear Regression and Correlation Analysis139 Questions
Exam 15: Multiple Regression Analysis and Model Building148 Questions
Exam 16: Analyzing and Forecasting Time-Series Data131 Questions
Exam 17: Introduction to Nonparametric Statistics103 Questions
Exam 18: Introducing Business Analytics48 Questions
Exam 19: Introduction to Decision Analysis48 Questions
Exam 20: Introduction to Quality and Statistical Process Control42 Questions
Select questions type
The following regression output was generated based on a sample of utility customers. The dependent variable was the dollar amount of the monthly bill and the independent variable was the size of the house in square feet. 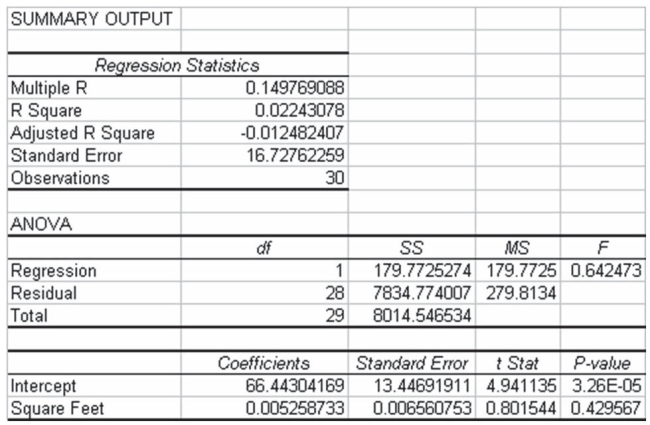 Based on this regression output, what is the 95 percent confidence interval estimate for the population regression slope coefficient?
(Multiple Choice)
4.8/5  (36)
(36)
Consider the following partially completed computer printout for a regression analysis where the dependent variable is the price of a personal computer and the independent variable is the size of the hard drive.  Based on the information provided, what is the estimate for the standard error of the estimate for the regression model?
(Multiple Choice)
4.8/5 (30)
Which of the following statements is true with respect to a simple linear regression model?
(Multiple Choice)
4.7/5 (32)
The sum of the residuals in a least squares regression model will be zero only when the correlation between the x and y variables is statistically significant.
(True/False)
4.9/5 (40)
A recent study by a major financial investment company was interested in determining whether the annual percentage change in stock price for companies is linearly related to the annual percent change in profits for the company. The following data was determined for 7 randomly selected companies:  Based upon this sample information, which of the following is the regression equation?
(Multiple Choice)
4.7/5 (43)
A positive population slope of 12 (β1 = 12) means that a 1-unit increase in x causes an average 12-unit increase in y.
(True/False)
4.8/5 (48)
If you were going to develop a scatter plot for the purpose of determining whether one of the assumptions of the regression model is being satisfied, which of the following is true?
(Multiple Choice)
4.8/5 (34)
In a simple regression model, if the regression model is deemed to be statistically significant, it means that the regression slope coefficient is significantly greater than zero.
(True/False)
4.9/5 (52)
You are given the following sample data for two variables: 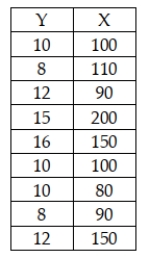 The sample correlation coefficient for these data is approximately r = 0.755.
(True/False)
4.8/5 (32)
When the correlation coefficient for the two variables was -0.23, it implies that the two variables are not correlated because the correlation coefficient cannot be negative.
(True/False)
4.8/5 (38)
The difference between a scatter plot and a scatter diagram is that the scatter plot has the independent variable on the x-axis while the independent variable is on the Y-axis in a scatter diagram.
(True/False)
4.8/5 (42)
The term that is given when two variables are correlated but there is no apparent connection between them is:
(Multiple Choice)
4.9/5 (27)
The following data for the dependent variable, y, and the independent variable, x, have been collected using simple random sampling: 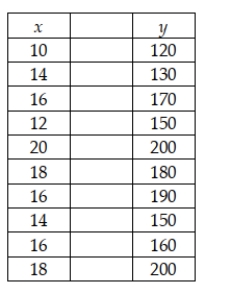 Compute the correlation coefficient.
(Multiple Choice)
4.9/5 (45)
A perfect correlation between two variables will always produce a correlation coefficient of +1.0
(True/False)
4.9/5 (36)
When using regression analysis for descriptive purposes, which of the following is of importance?
(Multiple Choice)
4.9/5 (34)
If two variables are related in a positive linear manner, the scatter plot will show points on the x,y space that are generally moving from the lower left to the upper right.
(True/False)
4.8/5 (30)
Which of the following statements is true with respect to a simple linear regression model?
(Multiple Choice)
4.8/5 (42)
The Public Utility Commission in a southern state is interested in describing the relationship between household monthly utility bills and the size of the house. A recent study of 30 randomly selected household resulted in the following regression results:  Based on the information provided, indicate what, if any, conclusions can be reached about the relationship between utility bill and the size of the house in square feet.
(Essay)
4.9/5 (33)
A study was recently done in which the following regression output was generated using Excel. SUMMARY OUTPUT 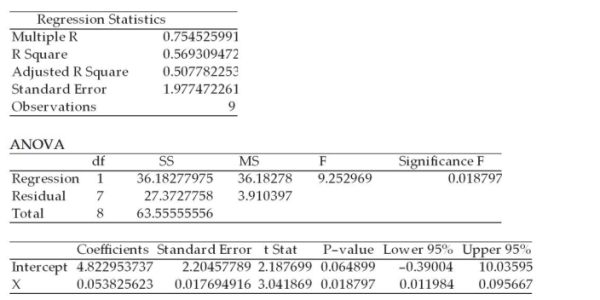 Given this, we know that approximately 57 percent of the variation in the y variable is explained by the x variable.
(True/False)
4.8/5 (36)
Filters
- Essay(6)
- Multiple Choice(54)
- Short Answer(0)
- True False(79)
- Matching(0)