Exam 8: Using Data Tables and Excel Scenarios for What If Analysis
Exam 1: Applying Fundamental Excel Skills and Tools in Problem Solving150 Questions
Exam 2: Solving Problems with Statistical Analysis Tools150 Questions
Exam 3: Determining Effective Data Display with Charts150 Questions
Exam 4: Applying Logic in Decision Making150 Questions
Exam 5: Retrieving Data for Computation, Analysis, and Reference150 Questions
Exam 6: Evaluating the Financial Impact of Loans and Investments150 Questions
Exam 7: Organizing Data for Effective Analysis150 Questions
Exam 8: Using Data Tables and Excel Scenarios for What If Analysis150 Questions
Exam 9: Enhancing Decision Making with Solver150 Questions
Exam 10: Troubleshooting Workbooks and Automating Excel Applications150 Questions
Select questions type
____________________ results are those that are based on realistic but not actual data.
(Short Answer)
4.8/5  (35)
(35)
MATCHING
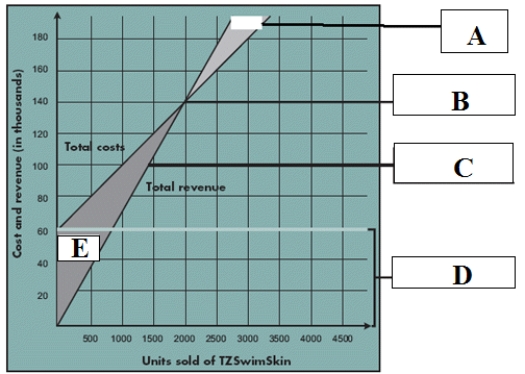 Identify the letter of the choice that best matches the break-even point in the chart above.
-Fixed costs
Identify the letter of the choice that best matches the break-even point in the chart above.
-Fixed costs
(Multiple Choice)
4.7/5 (38)
When you change the values, the data table shows you how those changes affect the results of the formulas. _________________________
(True/False)
4.8/5 (29)
All defined names have a(n) ____________________, which specifies the location in which the name is valid.
(Short Answer)
5.0/5 (42)
A(n) ____________________ is a set of values stored in a worksheet that describes different situations, such as worst-case, likely case, and best-case scenarios.
(Short Answer)
4.9/5 (41)
A defined name can be used outside its scope if it is ____, which means if its original scope is identified in its reference.
(Multiple Choice)
4.8/5 (43)
In a one-variable data table, you enter possible values for the single input variable in the last row or column of the data table.
(True/False)
4.8/5 (39)
Because what-if analysis usually involves many estimates and other projections, range analysis helps managers learn how tolerant the projected results are of changes in those estimates and assumptions.
(True/False)
4.8/5 (34)
Case 8-1
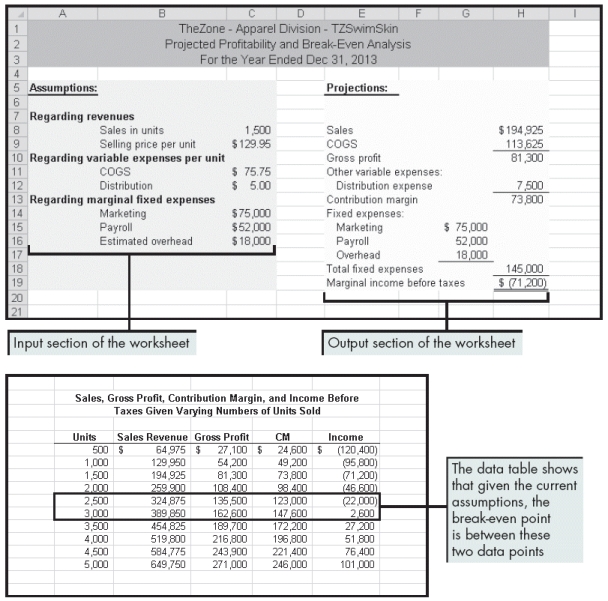 Beckham created the worksheets above to show the profitability and break-even points for his company. Please refer to the figure above as you answer the questions below.
-To conduct a sensitivity analysis, Beckham can ask: ____.
Beckham created the worksheets above to show the profitability and break-even points for his company. Please refer to the figure above as you answer the questions below.
-To conduct a sensitivity analysis, Beckham can ask: ____.
(Multiple Choice)
4.7/5 (42)
You can use the Scenario Manager dialog box to change a scenario's ____.
(Multiple Choice)
4.8/5 (46)
A ____ extracts, organizes, and summarizes data so you can analyze it by making comparisons, detecting patterns and relationships, and recognizing trends.
(Multiple Choice)
4.7/5 (28)
A data table depends on values and formulas used in a worksheet, and must appear ____ that contains this data.
(Multiple Choice)
4.9/5 (35)
A range name, also called a(n) ____________________ name, can refer to a cell, range of cells, formula, or constant value in Excel.
(Short Answer)
4.9/5 (42)
Changing cells and result cells are listed by the names you gave them when you ____.
(Multiple Choice)
4.7/5 (35)
To create a two-variable data table, you must first set up a data source file.
(True/False)
4.9/5 (36)
Defined names can be deleted or edited in the ____ dialog box.
(Multiple Choice)
4.8/5 (43)
You use the ____ to define and save sets of values as scenarios, and then you view and change them as necessary to produce and compare different results.
(Multiple Choice)
4.8/5 (40)
To open the Data Table dialog box, click the DATA tab on the ribbon, click the ____ Analysis button in the Data Tools group, and then click the Data Table command.
(Multiple Choice)
4.9/5 (32)
You can use the Scenario Manager to create two types of scenario reports: a scenario summary and a scenario ____.
(Multiple Choice)
4.8/5 (35)
MATCHING
Identify the letter of the choice that best matches the break-even point in the chart above.
-Break-even point
(Multiple Choice)
4.8/5 (35)
Filters
- Essay(3)
- Multiple Choice(92)
- Short Answer(20)
- True False(35)
- Matching(0)