Deck 17: Economic Growth and Globalization
Full screen (f)
Question
Question
Question
Question
Question
Question
Question
Question
Question
Question
Question
Question
Question
Question
Question
Question
Question
Question
Question
Question
Question
Question
Question
Question
Question
Question
Question
Question
Question
Question
Question
Question
Question
Question
The figure below most closely depicts 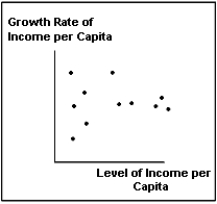
A) the growth pattern of Western Europe.
B) the growth pattern of the whole world.
C) the growth experience of the various states of the United States.
D) the growth pattern of the developed world.
E) None of these
A) the growth pattern of Western Europe.
B) the growth pattern of the whole world.
C) the growth experience of the various states of the United States.
D) the growth pattern of the developed world.
E) None of these
Question
Question
Question
Question
Question
Question
Question
Question
Question
Question
The table below shows the level of GDP per capita in 1900 for four regions of the world, as well as their growth rates between 1900 and 1938. Plot this table to determine whether catch-up is likely to occur among these regions. Does growth theory explain the growth experience of these regions between 1900 and 1938? 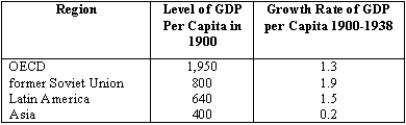
Question
Question
Question
Question
Question
Question
Question
What can be said about the accuracy of growth theory predictions for the group of countries shown in the table below? 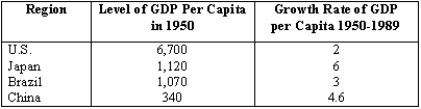
Question
Question
Question
Question
Question
Question
Question
Question
Question
Question
Question
Question
Question
Question
Question
Question
Question
Question
Question
Question
Question
Question
Question
Question
Question
Question
Question
Question
Question

Unlock Deck
Sign up to unlock the cards in this deck!
Unlock Deck
Unlock Deck
1/164
Play
Full screen (f)
Deck 17: Economic Growth and Globalization
1
Economic growth theory predicts that poor countries will catch up with rich countries because
A) productivity has tended to grow faster in the poor countries over time than in the rich countries.
B) the higher level of capital per worker in poor countries will attract more investment funds.
C) the higher level of capital per worker in rich countries will attract fewer investment funds.
D) the higher level of productivity in poor countries will attract more investment funds.
E) the higher level of productivity in rich countries will attract more investment funds.
the higher level of capital per worker in rich countries will attract fewer investment funds.
2
All else equal, regions with high capital per worker ratios should exhibit slower rates of growth than regions with low capital per worker ratios.
True
3
A country located on the lower-right-hand corner of the catch-up line is
A) Not enough information is given.
B) a rich country experiencing slow growth rates.
C) a poor country experiencing slow growth rates.
D) a poor country experiencing rapid growth rates.
E) a rich country enjoying rapid growth rates.
A) Not enough information is given.
B) a rich country experiencing slow growth rates.
C) a poor country experiencing slow growth rates.
D) a poor country experiencing rapid growth rates.
E) a rich country enjoying rapid growth rates.
a rich country experiencing slow growth rates.
4
A country located on the upper-left-hand corner of the catch-up line is
A) a rich country enjoying rapid growth rates.
B) a poor country experiencing slow growth rates.
C) a rich country experiencing slow growth rates.
D) a poor country experiencing rapid growth rates.
E) Not enough information is given.
A) a rich country enjoying rapid growth rates.
B) a poor country experiencing slow growth rates.
C) a rich country experiencing slow growth rates.
D) a poor country experiencing rapid growth rates.
E) Not enough information is given.
Unlock Deck
Unlock for access to all 164 flashcards in this deck.
Unlock Deck
k this deck
5
The historical growth experience of California
A) was consistent with the catch-up line.
B) was opposite to the catch-up line.
C) cannot be explained by the catch-up line.
D) was consistent with the catch-up line only from 1960 to 2000.
E) was sometime consistent with the catch-up line and sometime against it.
A) was consistent with the catch-up line.
B) was opposite to the catch-up line.
C) cannot be explained by the catch-up line.
D) was consistent with the catch-up line only from 1960 to 2000.
E) was sometime consistent with the catch-up line and sometime against it.
Unlock Deck
Unlock for access to all 164 flashcards in this deck.
Unlock Deck
k this deck
6
The theory of diminishing returns leads to the prediction that poor countries will catch up with rich countries.
Unlock Deck
Unlock for access to all 164 flashcards in this deck.
Unlock Deck
k this deck
7
The main purpose of the catch-up line is to show
A) how uneven the growth rate has been in different countries or regions of the world.
B) income inequality between different countries or regions.
C) how well the productivity level predicts the rate of productivity growth.
D) how well the productivity growth rate predicts the level of productivity.
E) that catch-up has occurred.
Unlock Deck
Unlock for access to all 164 flashcards in this deck.
Unlock Deck
k this deck
8
If country Z has a higher level of productivity than country X, we would predict country Z's future rate of growth to be less than country X's.
Unlock Deck
Unlock for access to all 164 flashcards in this deck.
Unlock Deck
k this deck
9
Data from the 50 U.S. states support the catch-up line theory.
Unlock Deck
Unlock for access to all 164 flashcards in this deck.
Unlock Deck
k this deck
10
As the U.S. secretary of the Treasury, this person has dealt in 2009 with a financial crisis that revealed the interconnectedness of the world.
A) Alan Greenspan.
B) Ben Bernanke.
C) Barak Obama.
D) Dick Cheney.
E) Tim Geithner.
A) Alan Greenspan.
B) Ben Bernanke.
C) Barak Obama.
D) Dick Cheney.
E) Tim Geithner.
Unlock Deck
Unlock for access to all 164 flashcards in this deck.
Unlock Deck
k this deck
11
A line showing the inverse relationship between the level of productivity and the growth rate of productivity is referred to as the
A) production function.
B) productivity function.
C) aggregate demand curve.
D) catch-up line.
E) growth accounting line.
A) production function.
B) productivity function.
C) aggregate demand curve.
D) catch-up line.
E) growth accounting line.
Unlock Deck
Unlock for access to all 164 flashcards in this deck.
Unlock Deck
k this deck
12
One drawback of globalization is that
A) economic fluctuations in one country will have an effect on other countries.
B) more countries will carry a national debt.
C) some countries can more easily exploit other countries.
D) one country can gain only if another country loses.
E) some countries will lose because of competition from foreign producers.
Unlock Deck
Unlock for access to all 164 flashcards in this deck.
Unlock Deck
k this deck
13
Economic growth theory predicts that
A) the amount of capital per hour of work is not a factor in determining growth.
B) regions with low levels of productivity will grow faster than regions with high levels of productivity.
C) the higher the amount of capital per hour worked, the more likely a country is to grow.
D) an economy's rate of growth is directly related to the amount of capital per hour worked.
E) only countries with low amounts of capital per hour of work can grow.
Unlock Deck
Unlock for access to all 164 flashcards in this deck.
Unlock Deck
k this deck
14
Economic growth theory predicts that poor countries will
A) never be able to catch up with rich countries.
B) not be able to catch up with rich countries because rich countries will always have a higher growth potential than poor countries.
C) be able to catch up with rich countries because the existing level of low productivity in poor countries attracts investment.
D) never be able to catch up with rich countries because the existing level of low productivity in poor countries deters investment.
E) be able to catch up with rich countries because rich countries will run out of investment opportunities and will be forced to rely on investment opportunities in the poor countries.
Unlock Deck
Unlock for access to all 164 flashcards in this deck.
Unlock Deck
k this deck
15
According to the catch-up phenomenon, a rich country like the United States will
A) grow at a slower rate than a poor country.
B) grow at a constant rate indefinitely.
C) grow faster over time.
D) become a poor country over time.
E) become less productive immediately.
A) grow at a slower rate than a poor country.
B) grow at a constant rate indefinitely.
C) grow faster over time.
D) become a poor country over time.
E) become less productive immediately.
Unlock Deck
Unlock for access to all 164 flashcards in this deck.
Unlock Deck
k this deck
16
Data from the 50 U.S. states show that higher-income states have higher growth rates.
Unlock Deck
Unlock for access to all 164 flashcards in this deck.
Unlock Deck
k this deck
17
Data for the states within the United States show that states with low real income per capita in 1880
A) tended to grow at faster rates.
B) tended to grow at slower rates.
C) tended to have negative growth rates.
D) have higher income per capita than states with high real income per capita in 1880.
E) do not exist today.
A) tended to grow at faster rates.
B) tended to grow at slower rates.
C) tended to have negative growth rates.
D) have higher income per capita than states with high real income per capita in 1880.
E) do not exist today.
Unlock Deck
Unlock for access to all 164 flashcards in this deck.
Unlock Deck
k this deck
18
According to economic growth theory, if the spread of technology is not difficult, we would expect
A) countries with lower productivity to adopt newer technology and raise their productivity.
B) countries with high levels of income per capita to continue growing faster than countries with low incomes per capita.
C) the elimination of diminishing returns to labor.
D) an increase in the diminishing returns to capital.
E) the elimination of diminishing returns to capital.
Unlock Deck
Unlock for access to all 164 flashcards in this deck.
Unlock Deck
k this deck
19
The global financial crisis that began in December of 2007 has revealed that the world is not as interconnected as most economists expected.
Unlock Deck
Unlock for access to all 164 flashcards in this deck.
Unlock Deck
k this deck
20
The catch-up line
A) is vertical.
B) is horizontal.
C) is downward sloping.
D) is upward sloping.
E) has a V-shape.
A) is vertical.
B) is horizontal.
C) is downward sloping.
D) is upward sloping.
E) has a V-shape.
Unlock Deck
Unlock for access to all 164 flashcards in this deck.
Unlock Deck
k this deck
21
South Korea's development in the last 40 years (or lack thereof) represents clear evidence against the economic growth theory, as its data do not fall along the catch-up line.
Unlock Deck
Unlock for access to all 164 flashcards in this deck.
Unlock Deck
k this deck
22
In terms of the catch-up line for advanced countries from 1960 to 2005, Japan is an example of a country that was richer and therefore grew less rapidly.
Unlock Deck
Unlock for access to all 164 flashcards in this deck.
Unlock Deck
k this deck
23
Which of the following statements is true?
A) Bangladesh, Indonesia, South Korea, and Ethiopia had the same level of real GDP per capita in 1960 as well as the same rate of economic growth between 1960 and 2005.
B) Bangladesh, Indonesia, South Korea, and Ethiopia had the same rate of economic growth between 1960 and 2005; however, South Korea's and Singapore's levels of real GDP per capita were twice that of Bangladesh and Ethiopia.
C) Indonesia's and South Korea's growth rates between 1960 and 2005 and their level of per capita real GDP in 1960 were twice that of Bangladesh and Ethiopia.
D) Indonesia's and South Korea's growth rates between 1960 and 2005 were much higher than Bangladesh's and Ethiopia's even though the level of real per capita GDP in 1960 was almost the same for all four of these countries.
E) What happened in terms of economic growth to Bangladesh and Ethiopia between 1960 and 2005 did not happen to any other poor countries.
Unlock Deck
Unlock for access to all 164 flashcards in this deck.
Unlock Deck
k this deck
24
Between 1960 and 2005 Indonesia and South Korea had higher growth rates than Nigeria and Ethiopia even though the levels of real per capita income in Indonesia and South Korea were much higher in 1960.
Unlock Deck
Unlock for access to all 164 flashcards in this deck.
Unlock Deck
k this deck
25
Evidence suggests that catch-up is not occurring among all countries of the world.
Unlock Deck
Unlock for access to all 164 flashcards in this deck.
Unlock Deck
k this deck
26
In terms of the catch-up line for advanced countries from 1960 to 2005, New Zealand is an example of a country that
A) was richer and therefore grew less rapidly.
B) was poorer and therefore grew less rapidly.
C) was richer and therefore grew more rapidly.
D) was poorer and therefore grew more rapidly.
E) None of these
A) was richer and therefore grew less rapidly.
B) was poorer and therefore grew less rapidly.
C) was richer and therefore grew more rapidly.
D) was poorer and therefore grew more rapidly.
E) None of these
Unlock Deck
Unlock for access to all 164 flashcards in this deck.
Unlock Deck
k this deck
27
GDP per capita has been a good predictor of productivity growth in the developed countries.
Unlock Deck
Unlock for access to all 164 flashcards in this deck.
Unlock Deck
k this deck
28
The catch-up line indicates that a lower growth rate productivity is related to a higher level of productivity.
Unlock Deck
Unlock for access to all 164 flashcards in this deck.
Unlock Deck
k this deck
29
Evidence from the developing countries supports the predictions of economic growth theory.
Unlock Deck
Unlock for access to all 164 flashcards in this deck.
Unlock Deck
k this deck
30
Nigeria's development in the last 40 years (or lack thereof) represents evidence against the economic growth theory, as its data do not fall along the catch-up line.
Unlock Deck
Unlock for access to all 164 flashcards in this deck.
Unlock Deck
k this deck
31
Which of the following statements is true?
A) All countries with low productivity levels in 1960 grew slowly between 1960 and 2000.
B) Since the United States had the highest productivity level in 1960, it was the slowest-growing country in the world between 1960 and 2000.
C) Countries with high productivity levels in 1960 grew the fastest between 1960 and 2000.
D) All countries with low productivity levels in 1960 grew rapidly between 1960 and 2000.
E) There is little correlation between the productivity level in 1960 and the growth rate between 1960 and 2000 for the developing countries.
Unlock Deck
Unlock for access to all 164 flashcards in this deck.
Unlock Deck
k this deck
32
Japan is an example of a country
A) that had lower per capita income than the United States in 1960 and grew more rapidly than the United States between 1960 and 2005.
B) that had lower per capita income than the United States in 1960 and grew less rapidly than the United States between 1960 and 2005.
C) that did not grow between 1960 and 2005.
D) that had higher per capita income than the United States in 1960 and grew less rapidly than the United States between 1960 and 2005.
E) in transition.
Unlock Deck
Unlock for access to all 164 flashcards in this deck.
Unlock Deck
k this deck
33
Which of the following statements is true?
A) There is no correlation between a state's per capita income in 1880 and its growth rate over the past century.
B) States with low income per capita in 1880 had the same growth rates over the past century as states that had higher income per capita in 1880.
C) States with low income per capita in 1880 had higher growth rates over the past century than states that had higher income per capita in 1880.
D) States with low income per capita in 1880 had lower growth rates over the past century than states that had higher income per capita in 1880.
E) States with low income per capita in 1880 used aggressive growth policies to accelerate their growth rates.
Unlock Deck
Unlock for access to all 164 flashcards in this deck.
Unlock Deck
k this deck
34
The figure below most closely depicts
A) the growth pattern of Western Europe.
B) the growth pattern of the whole world.
C) the growth experience of the various states of the United States.
D) the growth pattern of the developed world.
E) None of these
A) the growth pattern of Western Europe.
B) the growth pattern of the whole world.
C) the growth experience of the various states of the United States.
D) the growth pattern of the developed world.
E) None of these
Unlock Deck
Unlock for access to all 164 flashcards in this deck.
Unlock Deck
k this deck
35
For the world as a whole, the level of per capita GDP is a poor predictor of a country's economic growth.
Unlock Deck
Unlock for access to all 164 flashcards in this deck.
Unlock Deck
k this deck
36
Data from the most advanced economies support the catch-up theory.
Unlock Deck
Unlock for access to all 164 flashcards in this deck.
Unlock Deck
k this deck
37
Growth theory predictions support what has been happening in the world economy over the past 100 years.
Unlock Deck
Unlock for access to all 164 flashcards in this deck.
Unlock Deck
k this deck
38
For the most advanced countries, there is an inverse relationship between the growth rate and the productivity level.
Unlock Deck
Unlock for access to all 164 flashcards in this deck.
Unlock Deck
k this deck
39
Which of the following statements is true?
A) Growth theory cannot explain the growth pattern experienced by the whole world.
B) Growth theory does not explain the growth pattern experienced by the United States.
C) Growth theory does not explain the growth pattern experienced by the developed countries of the world.
D) Growth theory explains the growth pattern experienced by the whole world.
E) The growth experiences of Portugal and Spain are counter to what growth theory would have predicted.
Unlock Deck
Unlock for access to all 164 flashcards in this deck.
Unlock Deck
k this deck
40
When comparing the advanced countries of the world,
A) countries with high per capita income in 1960 experienced high growth rates between 1960 and 2005.
B) every country experienced the same growth rate between 1960 and 2005, regardless of its size in 1960.
C) the evidence does not support the catch-up behavior predicted by growth theory.
D) countries with low per capita income in 1960 experienced low growth rates between 1960 and 2005.
E) the evidence supports the catch-up behavior predicted by growth theory.
Unlock Deck
Unlock for access to all 164 flashcards in this deck.
Unlock Deck
k this deck
41
The percentage of the world population with an income less than $5,000 is approximately
A) 45 percent.
B) 90 percent.
C) 10 percent.
D) 2 percent.
E) 20 percent.
A) 45 percent.
B) 90 percent.
C) 10 percent.
D) 2 percent.
E) 20 percent.
Unlock Deck
Unlock for access to all 164 flashcards in this deck.
Unlock Deck
k this deck
42
The share of the population in the world living with less than two U.S. dollars a day is
A) about 50 percent.
B) about 25 percent.
C) 10 percent.
D) 2 percent.
E) 90 percent.
A) about 50 percent.
B) about 25 percent.
C) 10 percent.
D) 2 percent.
E) 90 percent.
Unlock Deck
Unlock for access to all 164 flashcards in this deck.
Unlock Deck
k this deck
43
Does the growth experience of poorer countries of the world support the predictions of growth theory? Why or why not?
Unlock Deck
Unlock for access to all 164 flashcards in this deck.
Unlock Deck
k this deck
44
The table below shows the level of GDP per capita in 1900 for four regions of the world, as well as their growth rates between 1900 and 1938. Plot this table to determine whether catch-up is likely to occur among these regions. Does growth theory explain the growth experience of these regions between 1900 and 1938?
Unlock Deck
Unlock for access to all 164 flashcards in this deck.
Unlock Deck
k this deck
45
According to economic growth theory, what should happen to the productivity level in all countries of the world in the long run? What is a key assumption of this prediction?
Unlock Deck
Unlock for access to all 164 flashcards in this deck.
Unlock Deck
k this deck
46
An emerging market is a country that
A) became a country after World War II.
B) was once poor but has since grown rapidly.
C) is at a stage of development ahead of an advanced economy.
D) has experienced no economic development.
E) has always depended on the growth of other countries.
A) became a country after World War II.
B) was once poor but has since grown rapidly.
C) is at a stage of development ahead of an advanced economy.
D) has experienced no economic development.
E) has always depended on the growth of other countries.
Unlock Deck
Unlock for access to all 164 flashcards in this deck.
Unlock Deck
k this deck
47
Which of the following is a unique feature of poor countries?
A) Limited stocks of capital per worker
B) Diminishing returns to capital
C) Poor distribution systems
D) Poor educational systems
E) Political repression
A) Limited stocks of capital per worker
B) Diminishing returns to capital
C) Poor distribution systems
D) Poor educational systems
E) Political repression
Unlock Deck
Unlock for access to all 164 flashcards in this deck.
Unlock Deck
k this deck
48
Which of the following is an industrialized country?
A) Bangladesh
B) Russia
C) Korea
D) Italy
E) China
A) Bangladesh
B) Russia
C) Korea
D) Italy
E) China
Unlock Deck
Unlock for access to all 164 flashcards in this deck.
Unlock Deck
k this deck
49
According to economic growth theory, how does a country's current productivity level predict its future growth rate?
Unlock Deck
Unlock for access to all 164 flashcards in this deck.
Unlock Deck
k this deck
50
Which of the following is a developing country?
A) Australia
B) Portugal
C) Japan
D) Indonesia
E) Italy
A) Australia
B) Portugal
C) Japan
D) Indonesia
E) Italy
Unlock Deck
Unlock for access to all 164 flashcards in this deck.
Unlock Deck
k this deck
51
What can be said about the accuracy of growth theory predictions for the group of countries shown in the table below?
Unlock Deck
Unlock for access to all 164 flashcards in this deck.
Unlock Deck
k this deck
52
For the majority of people in the world, per capita income is
A) greater than $7,000.
B) greater than $10,000.
C) greater than $15,000.
D) less than $5,000.
E) greater than $5,000.
A) greater than $7,000.
B) greater than $10,000.
C) greater than $15,000.
D) less than $5,000.
E) greater than $5,000.
Unlock Deck
Unlock for access to all 164 flashcards in this deck.
Unlock Deck
k this deck
53
Which of the following is considered a developing country?
A) United States
B) Japan
C) China
D) Canada
E) Korea
A) United States
B) Japan
C) China
D) Canada
E) Korea
Unlock Deck
Unlock for access to all 164 flashcards in this deck.
Unlock Deck
k this deck
54
Explain how the catch-up theory depends upon diminishing returns to capital, the adaptability of technology, and the free, riskless flow of investment funds.
Unlock Deck
Unlock for access to all 164 flashcards in this deck.
Unlock Deck
k this deck
55
The richest countries in the world are those with a per capita income of more than
A) $1,000.
B) $5,000.
C) $50,000.
D) $120,000.
E) $20,000.
A) $1,000.
B) $5,000.
C) $50,000.
D) $120,000.
E) $20,000.
Unlock Deck
Unlock for access to all 164 flashcards in this deck.
Unlock Deck
k this deck
56
Which of the following is considered an emerging market country?
A) United States
B) Japan
C) Mexico
D) Germany
E) Italy
A) United States
B) Japan
C) Mexico
D) Germany
E) Italy
Unlock Deck
Unlock for access to all 164 flashcards in this deck.
Unlock Deck
k this deck
57
Developing countries include all the following except
A) relatively poor countries.
B) emerging markets.
C) less-developed countries.
D) advanced economies.
E) low-income countries.
A) relatively poor countries.
B) emerging markets.
C) less-developed countries.
D) advanced economies.
E) low-income countries.
Unlock Deck
Unlock for access to all 164 flashcards in this deck.
Unlock Deck
k this deck
58
Which of the following is an emerging market country?
A) Japan
B) Philippines
C) Italy
D) Ethiopia
E) Chile
A) Japan
B) Philippines
C) Italy
D) Ethiopia
E) Chile
Unlock Deck
Unlock for access to all 164 flashcards in this deck.
Unlock Deck
k this deck
59
Economic development is
A) the branch of economics that studies economic growth.
B) another name for economic growth.
C) the branch of economics that studies why the catch-up theory has not applied in all parts of the world.
D) the branch of economics that studies the history of economic growth.
E) another name for welfare economics.
Unlock Deck
Unlock for access to all 164 flashcards in this deck.
Unlock Deck
k this deck
60
Have the predictions of growth theory proven true for the states of the United States? Why?
Unlock Deck
Unlock for access to all 164 flashcards in this deck.
Unlock Deck
k this deck
61
China is now the world's second largest economy and so it is classified as an advanced economy.
Unlock Deck
Unlock for access to all 164 flashcards in this deck.
Unlock Deck
k this deck
62
Which of the following statements is true?
A) China has a lower level of GDP per capita than Japan, but a higher level of GDP than Japan.
B) China's GDP and GDP per capita are lower than Japan's.
C) China's GDP and GDP per capita are greater than Japan's.
D) China has a higher level of GDP per capita than Japan, but a lower level of GDP than Japan.
E) China's GDP is the same as Japan's, and its level of GDP per capita is lower than Japan's.
Unlock Deck
Unlock for access to all 164 flashcards in this deck.
Unlock Deck
k this deck
63
The term developing country describes those countries that are relatively poor.
Unlock Deck
Unlock for access to all 164 flashcards in this deck.
Unlock Deck
k this deck
64
Which of the following is not a true fact about economic development in today's world?
A) Every year, some 3 million people die for lack of immunization worldwide.
B) Every year, some 1 million people die from malaria worldwide.
C) Every year, some 3 million people die from water-related diseases worldwide.
D) Every year, some 2 million people die from exposure to stove smoke inside their houses worldwide.
E) Today there are less than 200 million people living on less than the equivalent of $2 a day worldwide.
Unlock Deck
Unlock for access to all 164 flashcards in this deck.
Unlock Deck
k this deck
65
Today, there are more than 3 billion people, which is about half the human race, who live on less than the equivalent of $2 per day.
Unlock Deck
Unlock for access to all 164 flashcards in this deck.
Unlock Deck
k this deck
66
The majority of the people in the world have a per capita income less than $5,000.
Unlock Deck
Unlock for access to all 164 flashcards in this deck.
Unlock Deck
k this deck
67
Economic development economists focus primarily on how less developed countries can attract more investment funds from developed countries.
Unlock Deck
Unlock for access to all 164 flashcards in this deck.
Unlock Deck
k this deck
68
Of the total amount of the world's GDP, approximately what percentage comes from developing countries in Africa?
A) 3 percent
B) 15 percent
C) 10 percent
D) 20 percent
E) 25 percent
A) 3 percent
B) 15 percent
C) 10 percent
D) 20 percent
E) 25 percent
Unlock Deck
Unlock for access to all 164 flashcards in this deck.
Unlock Deck
k this deck
69
Approximately what percentage of the world's GDP is produced by the developing countries in Asia?
A) 10 percent
B) 15 percent
C) 5 percent
D) 27 percent
E) 60 percent
A) 10 percent
B) 15 percent
C) 5 percent
D) 27 percent
E) 60 percent
Unlock Deck
Unlock for access to all 164 flashcards in this deck.
Unlock Deck
k this deck
70
Two countries that don't conform to the North-South income distribution pattern are
A) Japan and Uruguay.
B) Korea and Japan.
C) Australia and New Zealand.
D) Italy and Portugal.
E) Norway and Ireland.
A) Japan and Uruguay.
B) Korea and Japan.
C) Australia and New Zealand.
D) Italy and Portugal.
E) Norway and Ireland.
Unlock Deck
Unlock for access to all 164 flashcards in this deck.
Unlock Deck
k this deck
71
More than 50 percent of the world's GDP comes from industrialized countries.
Unlock Deck
Unlock for access to all 164 flashcards in this deck.
Unlock Deck
k this deck
72
All of the following are part of the "Emerging Africa" except
A) Tanzania.
B) South Africa.
C) Ghana.
D) Zambia.
E) Zimbawe.
A) Tanzania.
B) South Africa.
C) Ghana.
D) Zambia.
E) Zimbawe.
Unlock Deck
Unlock for access to all 164 flashcards in this deck.
Unlock Deck
k this deck
73
For the most part, when making international geographic distinctions, it is accurate to say that
A) the South is generally richer than the North.
B) the West is generally richer than the East.
C) there is no geographic pattern between rich and poor countries.
D) the East is generally richer than the West.
E) the North is generally richer than the South.
A) the South is generally richer than the North.
B) the West is generally richer than the East.
C) there is no geographic pattern between rich and poor countries.
D) the East is generally richer than the West.
E) the North is generally richer than the South.
Unlock Deck
Unlock for access to all 164 flashcards in this deck.
Unlock Deck
k this deck
74
The majority of the world's population has an annual income between $5,000 and $10,000.
Unlock Deck
Unlock for access to all 164 flashcards in this deck.
Unlock Deck
k this deck
75
China's GDP is larger than Japan's.
Unlock Deck
Unlock for access to all 164 flashcards in this deck.
Unlock Deck
k this deck
76
An emerging market country is a developing country.
Unlock Deck
Unlock for access to all 164 flashcards in this deck.
Unlock Deck
k this deck
77
A developing country refers to a country that is growing rapidly.
Unlock Deck
Unlock for access to all 164 flashcards in this deck.
Unlock Deck
k this deck
78
Of the total amount of GDP produced in the world in 2009, industrialized countries produce approximately
A) 75 percent.
B) 33 percent.
C) 15 percent.
D) 25 percent.
E) 54 percent.
A) 75 percent.
B) 33 percent.
C) 15 percent.
D) 25 percent.
E) 54 percent.
Unlock Deck
Unlock for access to all 164 flashcards in this deck.
Unlock Deck
k this deck
79
Huge disparities in world income distribution remain today.
Unlock Deck
Unlock for access to all 164 flashcards in this deck.
Unlock Deck
k this deck
80
Income per capita in sub-Saharan African countries is about 2 percent to 3 percent of that in the United States.
Unlock Deck
Unlock for access to all 164 flashcards in this deck.
Unlock Deck
k this deck
Unlock Deck
Unlock for access to all 164 flashcards in this deck.


