Deck 13: The Economics of Public Policy
Full screen (f)
Question
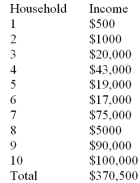
Refer to the table above.Exactly __________ households earn less than the mean level of income.
A) 7
B) 6
C) 5
D) 4
E) 3
Question
Refer to the table above.The top two quintiles' combined share of income is
A) 32%.
B) 67%.
C) 73%.
D) 83%.
E) 96%.
Question
Question
Refer to the table above.The bottom (lowest)quintile has a share of income equal to
A) 2%.
B) 4%.
C) 0.4%.
D) 1%.
E) 0.1%.
Question
Question
Question
Question
Question
Question
Question
Refer to the table above.The income distribution for the 10 households
A) is uniform.
B) is equitable.
C) has a low degree of inequality.
D) has a high degree of inequality.
E) is optimal.
Question
Question
Refer to the table above.The average income of the bottom (lowest)quintile is __________ and the average income of the top (highest)quintile is __________.
A) $11,000;$95,000
B) $750;$95,000
C) $750;$59,000
D) $500;$100,000
E) $1000;$95,000
Question
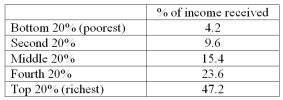
Refer to the information above.The top 40% of Canadians earned what percentage share of income?
A) More than 60.
B) 60.
C) 23.6.
D) 13.8.
E) 9.6.
Question
Refer to the information above.Which of the following is correct?
A) The Gini index is greater than 1.
B) The Gini index is equal to 0.
C) The Gini index is less than 1.
D) The Gini index is less than 0.
E) The Gini index is 20.04.
Question
Refer to the table above.The average income of the ten households is
A) $370,500.
B) $71,400.
C) $42,600.
D) $39,100.
E) $37,050.
Question
Question
Question
Question
Refer to the information above.The bottom 40% of Canadians earned what percentage share of income?
A) More than 60.
B) 60.
C) 23.6.
D) 13.8.
E) 9.6.
Question
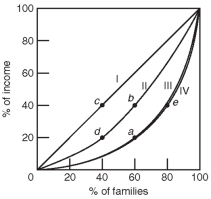
Refer to the above graph,which shows four different Lorenz curves (I,II,III,and IV).Which point indicates that 60% of the families receive only 40% of the income?
A) a.
B) b.
C) c.
D) d.
E) e.
Question
Question
Question
Refer to the above graph,which shows four different Lorenz curves (I,II,III,and IV).The movement from point b to point e in the graph would indicate that
A) 40% of income now goes to 80% of families,rather than 60% of families.
B) 80% of income now goes to 40% of families,rather than 60% of families.
C) 40% of income now goes to 60% of families,rather than 80% of families.
D) 60% of families now receive 20% of income,rather than 60% of income.
E) 20% of income now goes to 80% of families,rather than 40% of families.
Question
Question
Question
According to the Lorenz curve shown below,the poorest 50% of the families earns 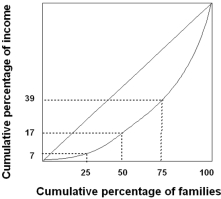
A) 7% of the income.
B) 10% of the income.
C) 17% of the income.
D) 39% of the income.
E) 61% of the income.
A) 7% of the income.
B) 10% of the income.
C) 17% of the income.
D) 39% of the income.
E) 61% of the income.
Question
According to the Lorenz curve shown,the middle quintile of families earns 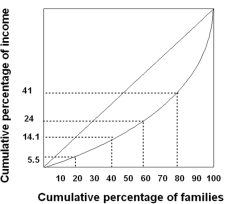
A) 14.1% of the income.
B) 24% of the income.
C) 9.9% of the income.
D) 38.1% of the income.
E) 50.0% of the income.
A) 14.1% of the income.
B) 24% of the income.
C) 9.9% of the income.
D) 38.1% of the income.
E) 50.0% of the income.
Question
Question
Question
Refer to the above graph,which shows four different Lorenz curves (I,II,III,and IV).Which change would indicate that there has been a decrease in income inequality? A movement from point
A) c to a.
B) a to d.
C) d to a.
D) b to e.
E) a toe.
Question
Refer to the graph below.If the area of region A is 0.17 and the area of region B is 0.33,then the Gini coefficient is. 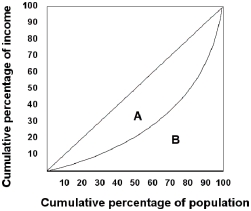
A) 0.0561.
B) 0.34.
C) 0.515.
D) 1.94.
E) 2.04.
A) 0.0561.
B) 0.34.
C) 0.515.
D) 1.94.
E) 2.04.
Question
Refer to the above graph,which shows four different Lorenz curves (I,II,III,and IV).The greatest increase in income inequality would occur with a shift in a Lorenz curve from
A) II to III.
B) I to IV.
C) IV to III.
D) IV to I.
E) II to I.
Question
Question
Question
Question
Question
Question
Refer to the table above.The extra total income under distribution C compared to distribution A can be thought of as
A) exploitation of the poor.
B) the cost of inequality.
C) the greed of the wealthy.
D) exploitation by the wealthy.
E) justification for mandatory income redistribution.
Question
Question
Question
Question
Question
Question
Question
Question
Question
Question
Question
Question
Question
Question
Question
Question
Question
Question
Question
Question
Question
Question
Question
Question
Question
Question
Question
Question
Question
Question
Question
Question
Question
Question
Question
Question
Question
Question
Question
Question
Question

Unlock Deck
Sign up to unlock the cards in this deck!
Unlock Deck
Unlock Deck
1/111
Play
Full screen (f)
Deck 13: The Economics of Public Policy
1
Refer to the table above.Exactly __________ households earn less than the mean level of income.
A) 7
B) 6
C) 5
D) 4
E) 3
6
2
Refer to the table above.The top two quintiles' combined share of income is
A) 32%.
B) 67%.
C) 73%.
D) 83%.
E) 96%.
83%.
3
The Gini coefficient can be calculated by measuring the area
A) between the Lorenz curve and the line of perfect equality,divided by the area under the line of perfect equality.
B) under the Lorenz curve,divided the area under the line of perfect equality.
C) under the line of perfect equality,divided by the area under the Lorenz curve.
D) under the line of perfect equality,divided by the area above the Lorenz curve.
E) above the line of perfect equality,divided by the area under the Lorenz curve.
between the Lorenz curve and the line of perfect equality,divided by the area under the line of perfect equality.
4
Refer to the table above.The bottom (lowest)quintile has a share of income equal to
A) 2%.
B) 4%.
C) 0.4%.
D) 1%.
E) 0.1%.
Unlock Deck
Unlock for access to all 111 flashcards in this deck.
Unlock Deck
k this deck
5
In Canada,from 1951 to 2009,the share of income controlled by the bottom 60% of households __________,while the share of the top 20% of households __________.
A) decreased;decreased
B) increased a small amount;increased significantly
C) increased;decreased
D) decreased;increased
E) remained stable;increased significantly
A) decreased;decreased
B) increased a small amount;increased significantly
C) increased;decreased
D) decreased;increased
E) remained stable;increased significantly
Unlock Deck
Unlock for access to all 111 flashcards in this deck.
Unlock Deck
k this deck
6
The poverty intensity index includes measures of
A) the poverty rate and the average poverty gap.
B) the poverty intensity index,the poverty cut-off index,and the Gini index.
C) the poverty cut-off index,the income tax cut-off index,and the Gini index.
D) the poverty intensity rate,the marginal poverty rate,and the average poverty rate.
E) the job loss index,the unemployment index,and the job retaining index.
Unlock Deck
Unlock for access to all 111 flashcards in this deck.
Unlock Deck
k this deck
7
If a society exhibits perfect equality in the distribution of income,such that each household receives an equal share of aggregate income,then the Lorenz curve would be
A) a 45º line from the origin.
B) a perfectly smooth U-shaped curve.
C) the x-axis.
D) the y-axis.
E) a downward-sloping curve that resembles a demand curve.
A) a 45º line from the origin.
B) a perfectly smooth U-shaped curve.
C) the x-axis.
D) the y-axis.
E) a downward-sloping curve that resembles a demand curve.
Unlock Deck
Unlock for access to all 111 flashcards in this deck.
Unlock Deck
k this deck
8
If we graph the relationship between the cumulative percentage of income received on the vertical axis and the cumulative percentage of population on the horizontal axis,we end up with a
A) Per-Capita Income curve.
B) Lorenz curve.
C) Gini curve.
D) Gini coefficient.
E) Poverty Intensity index.
A) Per-Capita Income curve.
B) Lorenz curve.
C) Gini curve.
D) Gini coefficient.
E) Poverty Intensity index.
Unlock Deck
Unlock for access to all 111 flashcards in this deck.
Unlock Deck
k this deck
9
Since the early 1980s,the pattern of income growth in the United States and the United Kingdom has been one of
A) no change for all income groups.
B) small income gains for low-income groups and enormous income gains for high-income groups.
C) smaller income gains for all groups compared to the prior 30 years.
D) large income gains for the middle class and no income gains for low-and high-income groups.
E) randomness.
Unlock Deck
Unlock for access to all 111 flashcards in this deck.
Unlock Deck
k this deck
10
A Lorenz curve is a graph that
A) ranges between zero and one.
B) measures the percentage of aggregate income received by households ranked from poorest to richest.
C) measures the percentage of aggregate income received by households ranked from richest to poorest.
D) shows an index of the amount of inequality in a population.
E) shows a negative income tax system.
Unlock Deck
Unlock for access to all 111 flashcards in this deck.
Unlock Deck
k this deck
11
Refer to the table above.The income distribution for the 10 households
A) is uniform.
B) is equitable.
C) has a low degree of inequality.
D) has a high degree of inequality.
E) is optimal.
Unlock Deck
Unlock for access to all 111 flashcards in this deck.
Unlock Deck
k this deck
12
The level of income most commonly used in Canada to define the poverty line is called the
A) relative measure of poverty.
B) absolute measure of poverty.
C) low-income cut-off.
D) PWT line.
E) necessity income.
A) relative measure of poverty.
B) absolute measure of poverty.
C) low-income cut-off.
D) PWT line.
E) necessity income.
Unlock Deck
Unlock for access to all 111 flashcards in this deck.
Unlock Deck
k this deck
13
Refer to the table above.The average income of the bottom (lowest)quintile is __________ and the average income of the top (highest)quintile is __________.
A) $11,000;$95,000
B) $750;$95,000
C) $750;$59,000
D) $500;$100,000
E) $1000;$95,000
Unlock Deck
Unlock for access to all 111 flashcards in this deck.
Unlock Deck
k this deck
14
Refer to the information above.The top 40% of Canadians earned what percentage share of income?
A) More than 60.
B) 60.
C) 23.6.
D) 13.8.
E) 9.6.
Unlock Deck
Unlock for access to all 111 flashcards in this deck.
Unlock Deck
k this deck
15
Refer to the information above.Which of the following is correct?
A) The Gini index is greater than 1.
B) The Gini index is equal to 0.
C) The Gini index is less than 1.
D) The Gini index is less than 0.
E) The Gini index is 20.04.
Unlock Deck
Unlock for access to all 111 flashcards in this deck.
Unlock Deck
k this deck
16
Refer to the table above.The average income of the ten households is
A) $370,500.
B) $71,400.
C) $42,600.
D) $39,100.
E) $37,050.
Unlock Deck
Unlock for access to all 111 flashcards in this deck.
Unlock Deck
k this deck
17
The most commonly-used poverty line in Canada is
A) the Gini index.
B) the LICO (low-income cut-off).
C) the Lorenz coefficient.
D) the income tax bracket.
E) the negative income tax rate.
A) the Gini index.
B) the LICO (low-income cut-off).
C) the Lorenz coefficient.
D) the income tax bracket.
E) the negative income tax rate.
Unlock Deck
Unlock for access to all 111 flashcards in this deck.
Unlock Deck
k this deck
18
The percentage share of aggregate income controlled by the top 20% of families in Canada grew by __________ percentage points from 1951 to 2009.
A) 4
B) 12
C) 33
D) 40
E) more than 50
A) 4
B) 12
C) 33
D) 40
E) more than 50
Unlock Deck
Unlock for access to all 111 flashcards in this deck.
Unlock Deck
k this deck
19
Different Lorenz curves for the same nation measured at different points in time show the changes in
A) the actual degree of income inequality over time.
B) the actual population over time.
C) the actual disposable income earned by various sectors of the population over time.
D) income inequality with respect to the trends in the distribution of income in the world over time.
E) actual taxes paid over time.
Unlock Deck
Unlock for access to all 111 flashcards in this deck.
Unlock Deck
k this deck
20
Refer to the information above.The bottom 40% of Canadians earned what percentage share of income?
A) More than 60.
B) 60.
C) 23.6.
D) 13.8.
E) 9.6.
Unlock Deck
Unlock for access to all 111 flashcards in this deck.
Unlock Deck
k this deck
21
Refer to the above graph,which shows four different Lorenz curves (I,II,III,and IV).Which point indicates that 60% of the families receive only 40% of the income?
A) a.
B) b.
C) c.
D) d.
E) e.
Unlock Deck
Unlock for access to all 111 flashcards in this deck.
Unlock Deck
k this deck
22
Between 1982 and 2004 in Canada,while income gains for most groups were stagnant,the income share of the top-earning 1 percent of families ________ from ________ to ________ of taxable income.
A) rose;1%;7.4%
B) rose;7.4%;11.2%
C) rose;23.7%;46.8%
D) fell;46.8%;23.7%
E) fell;11.2%;7.4%
A) rose;1%;7.4%
B) rose;7.4%;11.2%
C) rose;23.7%;46.8%
D) fell;46.8%;23.7%
E) fell;11.2%;7.4%
Unlock Deck
Unlock for access to all 111 flashcards in this deck.
Unlock Deck
k this deck
23
If everyone in a country has the same income,then the area between the Lorenz curve and the line of perfect equality is ________,and the Gini coefficient equals ________.
A) zero;zero
B) zero;one
C) large;zero
D) large;one
E) infinite;zero
A) zero;zero
B) zero;one
C) large;zero
D) large;one
E) infinite;zero
Unlock Deck
Unlock for access to all 111 flashcards in this deck.
Unlock Deck
k this deck
24
Refer to the above graph,which shows four different Lorenz curves (I,II,III,and IV).The movement from point b to point e in the graph would indicate that
A) 40% of income now goes to 80% of families,rather than 60% of families.
B) 80% of income now goes to 40% of families,rather than 60% of families.
C) 40% of income now goes to 60% of families,rather than 80% of families.
D) 60% of families now receive 20% of income,rather than 60% of income.
E) 20% of income now goes to 80% of families,rather than 40% of families.
Unlock Deck
Unlock for access to all 111 flashcards in this deck.
Unlock Deck
k this deck
25
The combined wealth of the richest 1% of Americans
A) exceeds the GDP of China and India combined.
B) exceeds the wealth holdings of all Americans below the 95th percentile.
C) exceeds the wealth holdings of all Americans below the 80th percentile.
D) has been unchanged since 1978.
E) has fallen.
A) exceeds the GDP of China and India combined.
B) exceeds the wealth holdings of all Americans below the 95th percentile.
C) exceeds the wealth holdings of all Americans below the 80th percentile.
D) has been unchanged since 1978.
E) has fallen.
Unlock Deck
Unlock for access to all 111 flashcards in this deck.
Unlock Deck
k this deck
26
The two elements of poverty intensity are the ________,which is the percentage of the population whose income falls below the poverty line,and the ________,which is the average shortfall between the actual income of poor people and the poverty line.
A) Gini coefficient;Lorenz curve
B) Lorenz curve;Gini coefficient
C) poverty rate;LICO
D) LICO;poverty rate
E) poverty rate;average poverty gap
A) Gini coefficient;Lorenz curve
B) Lorenz curve;Gini coefficient
C) poverty rate;LICO
D) LICO;poverty rate
E) poverty rate;average poverty gap
Unlock Deck
Unlock for access to all 111 flashcards in this deck.
Unlock Deck
k this deck
27
According to the Lorenz curve shown below,the poorest 50% of the families earns
A) 7% of the income.
B) 10% of the income.
C) 17% of the income.
D) 39% of the income.
E) 61% of the income.
A) 7% of the income.
B) 10% of the income.
C) 17% of the income.
D) 39% of the income.
E) 61% of the income.
Unlock Deck
Unlock for access to all 111 flashcards in this deck.
Unlock Deck
k this deck
28
According to the Lorenz curve shown,the middle quintile of families earns
A) 14.1% of the income.
B) 24% of the income.
C) 9.9% of the income.
D) 38.1% of the income.
E) 50.0% of the income.
A) 14.1% of the income.
B) 24% of the income.
C) 9.9% of the income.
D) 38.1% of the income.
E) 50.0% of the income.
Unlock Deck
Unlock for access to all 111 flashcards in this deck.
Unlock Deck
k this deck
29
If the Lorenz curve moves closer to the diagonal,the level of inequality
A) must have risen.
B) must have fallen.
C) could have risen or fallen
D) must have remained the same.
E) could have risen or remained the same.
A) must have risen.
B) must have fallen.
C) could have risen or fallen
D) must have remained the same.
E) could have risen or remained the same.
Unlock Deck
Unlock for access to all 111 flashcards in this deck.
Unlock Deck
k this deck
30
The degree of inequality in the distribution of income in an economy is depicted in a(n)
A) Lorenz curve.
B) Phillips curve.
C) Engels curve.
D) indifference curve.
E) demand curve.
A) Lorenz curve.
B) Phillips curve.
C) Engels curve.
D) indifference curve.
E) demand curve.
Unlock Deck
Unlock for access to all 111 flashcards in this deck.
Unlock Deck
k this deck
31
Refer to the above graph,which shows four different Lorenz curves (I,II,III,and IV).Which change would indicate that there has been a decrease in income inequality? A movement from point
A) c to a.
B) a to d.
C) d to a.
D) b to e.
E) a toe.
Unlock Deck
Unlock for access to all 111 flashcards in this deck.
Unlock Deck
k this deck
32
Refer to the graph below.If the area of region A is 0.17 and the area of region B is 0.33,then the Gini coefficient is.
A) 0.0561.
B) 0.34.
C) 0.515.
D) 1.94.
E) 2.04.
A) 0.0561.
B) 0.34.
C) 0.515.
D) 1.94.
E) 2.04.
Unlock Deck
Unlock for access to all 111 flashcards in this deck.
Unlock Deck
k this deck
33
Refer to the above graph,which shows four different Lorenz curves (I,II,III,and IV).The greatest increase in income inequality would occur with a shift in a Lorenz curve from
A) II to III.
B) I to IV.
C) IV to III.
D) IV to I.
E) II to I.
Unlock Deck
Unlock for access to all 111 flashcards in this deck.
Unlock Deck
k this deck
34
When comparing Canada to the United States and northern European countries in the mid-2000s,the highest Gini coefficient was found in ________;the next highest was found in ________;and the lowest was found in ________.
A) the northern European countries;Canada;the United States
B) Canada;the United States;the northern European countries
C) Canada;the northern European countries;the United States
D) the United States;the northern European countries;Canada
E) the United States;Canada;the northern European countries
A) the northern European countries;Canada;the United States
B) Canada;the United States;the northern European countries
C) Canada;the northern European countries;the United States
D) the United States;the northern European countries;Canada
E) the United States;Canada;the northern European countries
Unlock Deck
Unlock for access to all 111 flashcards in this deck.
Unlock Deck
k this deck
35
Between 1980 and 2009,the Gini coefficient of total income in Canada
A) decreased.
B) stayed the same.
C) increased.
D) turned negative.
E) went to infinity.
A) decreased.
B) stayed the same.
C) increased.
D) turned negative.
E) went to infinity.
Unlock Deck
Unlock for access to all 111 flashcards in this deck.
Unlock Deck
k this deck
36
If one person in a country has all the income,then the Gini coefficient equals
A) 0.
B) 1/2.
C) 1.
D) infinity.
E) -1.
A) 0.
B) 1/2.
C) 1.
D) infinity.
E) -1.
Unlock Deck
Unlock for access to all 111 flashcards in this deck.
Unlock Deck
k this deck
37
The Lorenz curve is a graph that shows the
A) distribution of wealth.
B) degree of income inequality.
C) effect of discrimination on incomes.
D) trade-off between equality and efficiency.
E) optimal amount of a public good.
A) distribution of wealth.
B) degree of income inequality.
C) effect of discrimination on incomes.
D) trade-off between equality and efficiency.
E) optimal amount of a public good.
Unlock Deck
Unlock for access to all 111 flashcards in this deck.
Unlock Deck
k this deck
38
Between 1976 and 2009 in Canada,the poverty rate displayed ________ long-term trend,and the average poverty gap displayed ________ long-term trend.
A) no;a significant upward
B) a slight upward;a slight downward
C) a significant upward;a significant upward
D) a slight downward;a slight upward
E) a significant downward;no
A) no;a significant upward
B) a slight upward;a slight downward
C) a significant upward;a significant upward
D) a slight downward;a slight upward
E) a significant downward;no
Unlock Deck
Unlock for access to all 111 flashcards in this deck.
Unlock Deck
k this deck
39
Refer to the table above.The extra total income under distribution C compared to distribution A can be thought of as
A) exploitation of the poor.
B) the cost of inequality.
C) the greed of the wealthy.
D) exploitation by the wealthy.
E) justification for mandatory income redistribution.
Unlock Deck
Unlock for access to all 111 flashcards in this deck.
Unlock Deck
k this deck
40
If income were distributed completely equally,the Lorenz curve would be a
A) 45º line.
B) horizontal line.
C) vertical line.
D) downward-sloping curve.
E) downward-sloping straight line.
A) 45º line.
B) horizontal line.
C) vertical line.
D) downward-sloping curve.
E) downward-sloping straight line.
Unlock Deck
Unlock for access to all 111 flashcards in this deck.
Unlock Deck
k this deck
41
If a family has income that it does not spend on consumption,then the family will have ________ change in their ________.
A) a negative;borrowing
B) a negative;wealth
C) no;wealth
D) a positive;borrowing
E) a positive;wealth
A) a negative;borrowing
B) a negative;wealth
C) no;wealth
D) a positive;borrowing
E) a positive;wealth
Unlock Deck
Unlock for access to all 111 flashcards in this deck.
Unlock Deck
k this deck
42
For a family's wealth to increase,it must be true that either the value of their assets has ________ or the value of their liabilities has ________.
A) decreased;decreased
B) increased;increased
C) decreased;increased
D) increased;decreased
E) not changed;not changed
A) decreased;decreased
B) increased;increased
C) decreased;increased
D) increased;decreased
E) not changed;not changed
Unlock Deck
Unlock for access to all 111 flashcards in this deck.
Unlock Deck
k this deck
43
Income and wealth are related by the following identity:
A) income + consumption = change in wealth.
B) income - consumption = change in wealth.
C) wealth + consumption = change in income.
D) wealth - consumption = change in income.
E) wealth - income = change in consumption.
A) income + consumption = change in wealth.
B) income - consumption = change in wealth.
C) wealth + consumption = change in income.
D) wealth - consumption = change in income.
E) wealth - income = change in consumption.
Unlock Deck
Unlock for access to all 111 flashcards in this deck.
Unlock Deck
k this deck
44
Increasing wealth inequality is a concern for Canada because it means that
A) many Canadians will not have savings to support themselves in retirement.
B) the public pension system will not be needed.
C) registered pension plans are covering more Canadians every year.
D) the poorest half of Canadian families have more wealth than the top 1 percent.
E) the poorest half of Canadian families have more wealth than the richest half.
Unlock Deck
Unlock for access to all 111 flashcards in this deck.
Unlock Deck
k this deck
45
To preserve the equality of opportunity,________ developed countries collect taxes on large inheritances;Canada ________ an inheritance tax.
A) most;has
B) most;does not have
C) a few;has
D) a few;does not have
E) hardly any;has
A) most;has
B) most;does not have
C) a few;has
D) a few;does not have
E) hardly any;has
Unlock Deck
Unlock for access to all 111 flashcards in this deck.
Unlock Deck
k this deck
46
In general,there is ________ inequality in the distribution of wealth compared to the distribution of income.
A) around the same
B) more
C) less
D) either the same or less
E) an unknown level of
A) around the same
B) more
C) less
D) either the same or less
E) an unknown level of
Unlock Deck
Unlock for access to all 111 flashcards in this deck.
Unlock Deck
k this deck
47
For the middle class,their key assets are ________,while for the top 10 percent of households,their key assets are ________.
A) financial assets;family homes
B) cars and recreational vehicles;family homes
C) family homes;cars and recreational vehicles
D) family homes;financial assets
E) financial assets;cars and recreational vehicles
A) financial assets;family homes
B) cars and recreational vehicles;family homes
C) family homes;cars and recreational vehicles
D) family homes;financial assets
E) financial assets;cars and recreational vehicles
Unlock Deck
Unlock for access to all 111 flashcards in this deck.
Unlock Deck
k this deck
48
Between 1984 and 2005 in Canada,the wealth of the poorest 40 percent of Canadian families ________,while the wealth of the top 40 percent ________.
A) rose substantially;rose substantially
B) fell substantially;fell substantially
C) did not change;did not change
D) rose substantially;stagnated
E) did not change;rose substantially
A) rose substantially;rose substantially
B) fell substantially;fell substantially
C) did not change;did not change
D) rose substantially;stagnated
E) did not change;rose substantially
Unlock Deck
Unlock for access to all 111 flashcards in this deck.
Unlock Deck
k this deck
49
In Canada in 2005,the poorest 30 percent of the population had ________ wealth,as their assets were ________ their liabilities.
A) high;greater than
B) no;equal to
C) no;greater than
D) negative;equal to
E) negative;less than
A) high;greater than
B) no;equal to
C) no;greater than
D) negative;equal to
E) negative;less than
Unlock Deck
Unlock for access to all 111 flashcards in this deck.
Unlock Deck
k this deck
50
To calculate a person's wealth,we add up the value of their ________ and subtract the total amount of their ________.
A) assets;income
B) income;assets
C) liabilities;income
D) income;liabilities
E) assets;liabilities
A) assets;income
B) income;assets
C) liabilities;income
D) income;liabilities
E) assets;liabilities
Unlock Deck
Unlock for access to all 111 flashcards in this deck.
Unlock Deck
k this deck
51
Which of the following would NOT be considered one of a family's assets,used in calculating wealth?
A) The value of their primary residence.
B) The value of their vacation home.
C) Their chequing account.
D) The mortgage on their primary residence.
E) Their stock holdings.
A) The value of their primary residence.
B) The value of their vacation home.
C) Their chequing account.
D) The mortgage on their primary residence.
E) Their stock holdings.
Unlock Deck
Unlock for access to all 111 flashcards in this deck.
Unlock Deck
k this deck
52
Which of the following is NOT a reason why a person from a rich family will be wealthy even if the person does not earn a high income?
A) The person receives interest from inherited assets.
B) The person receives dividend payments from inherited assets.
C) The person receives profits from inherited assets.
D) The person pays inheritance taxes.
E) The person owns a house inherited from family members.
A) The person receives interest from inherited assets.
B) The person receives dividend payments from inherited assets.
C) The person receives profits from inherited assets.
D) The person pays inheritance taxes.
E) The person owns a house inherited from family members.
Unlock Deck
Unlock for access to all 111 flashcards in this deck.
Unlock Deck
k this deck
53
The question of what constitutes a fair distribution of income
A) has a large consensus among economists and politicians.
B) can be derived from an analytical model.
C) has been settled.
D) is subject to considerable debate and disagreement.
E) is a non-economic issue,only a moral issue.
A) has a large consensus among economists and politicians.
B) can be derived from an analytical model.
C) has been settled.
D) is subject to considerable debate and disagreement.
E) is a non-economic issue,only a moral issue.
Unlock Deck
Unlock for access to all 111 flashcards in this deck.
Unlock Deck
k this deck
54
A retired senior citizen is more likely to have low ________ but high ________,while a young NHL player is more likely to have high ________ but low ________.
A) income;wealth;income;wealth
B) wealth;income;wealth;income
C) consumption;income;consumption;income
D) wealth;consumption;wealth;consumption
E) assets;liabilities;assets;liabilities
A) income;wealth;income;wealth
B) wealth;income;wealth;income
C) consumption;income;consumption;income
D) wealth;consumption;wealth;consumption
E) assets;liabilities;assets;liabilities
Unlock Deck
Unlock for access to all 111 flashcards in this deck.
Unlock Deck
k this deck
55
For a family's wealth to decrease,it must be true that either the value of their assets has ________ or the value of their liabilities has ________.
A) decreased;decreased
B) increased;increased
C) decreased;increased
D) increased;decreased
E) not changed;not changed
A) decreased;decreased
B) increased;increased
C) decreased;increased
D) increased;decreased
E) not changed;not changed
Unlock Deck
Unlock for access to all 111 flashcards in this deck.
Unlock Deck
k this deck
56
Which of the following is NOT a reason why most countries have estate or inheritance taxes?
A) Because large,unearned incomes strike many people as being unfair.
B) To raise revenue.
C) To punish wealthy families at a time of despair.
D) To decrease inequality.
E) To preserve equality of opportunity.
A) Because large,unearned incomes strike many people as being unfair.
B) To raise revenue.
C) To punish wealthy families at a time of despair.
D) To decrease inequality.
E) To preserve equality of opportunity.
Unlock Deck
Unlock for access to all 111 flashcards in this deck.
Unlock Deck
k this deck
57
Wealth is a(n)________ and income is a ________.
A) flow;stock
B) flow;flow
C) stock;flow
D) stock;stock
E) asset;liability
A) flow;stock
B) flow;flow
C) stock;flow
D) stock;stock
E) asset;liability
Unlock Deck
Unlock for access to all 111 flashcards in this deck.
Unlock Deck
k this deck
58
Compared to Canada,the distribution of wealth in the United States is
A) about the same.
B) more unequal.
C) less unequal.
D) more unequal,but getting less unequal.
E) less unequal,but getting more unequal.
A) about the same.
B) more unequal.
C) less unequal.
D) more unequal,but getting less unequal.
E) less unequal,but getting more unequal.
Unlock Deck
Unlock for access to all 111 flashcards in this deck.
Unlock Deck
k this deck
59
Between 1984 and 2005 in Canada,the Gini index of wealth inequality ________ from ________ to ________.
A) rose;0.379;0.429
B) rose;0.691;0.746
C) fell;0.429;0.379
D) fell;0.746;0.691
E) fell;4.1;46.8
A) rose;0.379;0.429
B) rose;0.691;0.746
C) fell;0.429;0.379
D) fell;0.746;0.691
E) fell;4.1;46.8
Unlock Deck
Unlock for access to all 111 flashcards in this deck.
Unlock Deck
k this deck
60
Which of the following would NOT be considered one of a family's liabilities,used in calculating wealth?
A) The mortgage on their primary residence.
B) The balance on their car loan.
C) The balance on their credit cards.
D) Their student loans.
E) The value of their recreational vehicle.
A) The mortgage on their primary residence.
B) The balance on their car loan.
C) The balance on their credit cards.
D) Their student loans.
E) The value of their recreational vehicle.
Unlock Deck
Unlock for access to all 111 flashcards in this deck.
Unlock Deck
k this deck
61
According to John Rawls,if income were given to a group of people before they knew their talents,they would likely prefer an income distribution that rewarded
A) laziness.
B) high IQ.
C) artistic gifts.
D) everyone with an equal share of income.
E) innovation.
A) laziness.
B) high IQ.
C) artistic gifts.
D) everyone with an equal share of income.
E) innovation.
Unlock Deck
Unlock for access to all 111 flashcards in this deck.
Unlock Deck
k this deck
62
The reason people in John Rawls' thought experiment would choose a more equal distribution of income is
A) their concern for the welfare of their fellows.
B) that Karl Marx was right.
C) that people are risk-loving.
D) that it is the easiest distribution to implement.
E) that people are risk-averse.
A) their concern for the welfare of their fellows.
B) that Karl Marx was right.
C) that people are risk-loving.
D) that it is the easiest distribution to implement.
E) that people are risk-averse.
Unlock Deck
Unlock for access to all 111 flashcards in this deck.
Unlock Deck
k this deck
63
John Rawls argues that some inequalities are necessary in order to provide incentives for
A) labour supply only.
B) saving only.
C) effort only.
D) labour supply and saving only.
E) labour supply,saving,and effort.
A) labour supply only.
B) saving only.
C) effort only.
D) labour supply and saving only.
E) labour supply,saving,and effort.
Unlock Deck
Unlock for access to all 111 flashcards in this deck.
Unlock Deck
k this deck
64
In general,a needs-tested welfare benefit will
A) reduce the incentive to work.
B) have no effect,positive or negative,on the incentive to work.
C) enhance the incentive to work.
D) ensure that only the truly needy get benefits.
E) encourage honesty about earnings.
A) reduce the incentive to work.
B) have no effect,positive or negative,on the incentive to work.
C) enhance the incentive to work.
D) ensure that only the truly needy get benefits.
E) encourage honesty about earnings.
Unlock Deck
Unlock for access to all 111 flashcards in this deck.
Unlock Deck
k this deck
65
In John Rawls' view,the degree of income inequality produced by competitive markets is
A) small.
B) greater than the amount people would prefer.
C) consistent with the ideal amount.
D) acceptable.
E) less than the ideal amount.
A) small.
B) greater than the amount people would prefer.
C) consistent with the ideal amount.
D) acceptable.
E) less than the ideal amount.
Unlock Deck
Unlock for access to all 111 flashcards in this deck.
Unlock Deck
k this deck
66
Leo is a welfare recipient who qualifies for two needs-tested cash benefits.If he does not earn any income,he receives $225 from each benefit.For each dollar he earns,each benefit is reduced by 75 cents until the benefit equals zero.
Refer to the above information.In the absence of earnings,Leo will receive __________ in benefits.
A) $225
B) $450
C) $400
D) $200
E) $337
Refer to the above information.In the absence of earnings,Leo will receive __________ in benefits.
A) $225
B) $450
C) $400
D) $200
E) $337
Unlock Deck
Unlock for access to all 111 flashcards in this deck.
Unlock Deck
k this deck
67
To say that a given welfare program is needs-tested indicates that
A) in order to qualify,one must pass a written test.
B) the size of the payment reflects the mean value of consumption based on family size.
C) in order to qualify,one must show that one needs to find a job.
D) the more income one earns,the smaller the size of the benefit.
E) the government has the need to cover the expenditure.
Unlock Deck
Unlock for access to all 111 flashcards in this deck.
Unlock Deck
k this deck
68
Utilitarianism is based on the concept of
A) perfect competition.
B) imperfect competition.
C) diminishing marginal product.
D) diminishing marginal utility.
E) negative externalities.
A) perfect competition.
B) imperfect competition.
C) diminishing marginal product.
D) diminishing marginal utility.
E) negative externalities.
Unlock Deck
Unlock for access to all 111 flashcards in this deck.
Unlock Deck
k this deck
69
Leo is a welfare recipient who qualifies for two needs-tested cash benefits.If he does not earn any income,he receives $225 from each benefit.For each dollar he earns,each benefit is reduced by 75 cents until the benefit equals zero.
Refer to the above information.If Leo earns $150,he will receive total benefits in the amount of
A) $375.
B) $325.
C) $225.
D) $75.
E) $0.
Refer to the above information.If Leo earns $150,he will receive total benefits in the amount of
A) $375.
B) $325.
C) $225.
D) $75.
E) $0.
Unlock Deck
Unlock for access to all 111 flashcards in this deck.
Unlock Deck
k this deck
70
Nobel Prize winner Amartya Sen argues that poverty does not just mean low income,but also what he refers to as
A) the scarcity of potential.
B) the deprivation of capabilities.
C) the denial of ability.
D) the deficiency of aptitude.
E) the shortage of competence.
A) the scarcity of potential.
B) the deprivation of capabilities.
C) the denial of ability.
D) the deficiency of aptitude.
E) the shortage of competence.
Unlock Deck
Unlock for access to all 111 flashcards in this deck.
Unlock Deck
k this deck
71
According to John Rawls,individuals would accept some degree of income inequality if
A) it resulted in a significantly larger amount of total income.
B) they would benefit from the inequality.
C) it resulted in a slightly larger amount of total income.
D) it were redistributed from those with more to those with less.
E) they were realistic.
A) it resulted in a significantly larger amount of total income.
B) they would benefit from the inequality.
C) it resulted in a slightly larger amount of total income.
D) it were redistributed from those with more to those with less.
E) they were realistic.
Unlock Deck
Unlock for access to all 111 flashcards in this deck.
Unlock Deck
k this deck
72
Which of the following is NOT a normative question regarding economic inequality?
A) What degree of redistribution is appropriate?
B) Does redistribution reduce the incentive to work?
C) Should taxes and transfers depend on the process that generates income?
D) Is redistribution equally appropriate for both those able to work and the disabled?
E) Should the origin of disability (i.e. ,reckless driving versus a workplace accident)matter?
Unlock Deck
Unlock for access to all 111 flashcards in this deck.
Unlock Deck
k this deck
73
The moral theory in which the best income distribution is the one that maximizes total utility is called
A) uniformitarianism.
B) totalism.
C) utilitarianism.
D) communism.
E) capitalism.
A) uniformitarianism.
B) totalism.
C) utilitarianism.
D) communism.
E) capitalism.
Unlock Deck
Unlock for access to all 111 flashcards in this deck.
Unlock Deck
k this deck
74
John Rawls asks us to imagine ourselves choosing the rules for distributing income behind
A) a scarf of unawareness.
B) a sheet of unknowing.
C) a curtain of conjecture.
D) a veil of ignorance.
E) a blanket of speculation.
A) a scarf of unawareness.
B) a sheet of unknowing.
C) a curtain of conjecture.
D) a veil of ignorance.
E) a blanket of speculation.
Unlock Deck
Unlock for access to all 111 flashcards in this deck.
Unlock Deck
k this deck
75
Which of the following is NOT one of the capabilities that Amartya Sen considers to be basic?
A) The capability to appear in public without shame.
B) The ability to visit friends or go to work.
C) The capability to understand the world around us.
D) The ability to drive a car.
E) The ability to function without pain.
A) The capability to appear in public without shame.
B) The ability to visit friends or go to work.
C) The capability to understand the world around us.
D) The ability to drive a car.
E) The ability to function without pain.
Unlock Deck
Unlock for access to all 111 flashcards in this deck.
Unlock Deck
k this deck
76
Suppose that Tim and Terri have the same marginal utility from consuming ice cream cones: 100,50,25,and 12 for the first four cones,respectively.Suppose also that Tim is currently consuming 3 cones,while Terri is consuming none.The transfer of one cone from Tim to Terri would result in an overall ________ in utility equal to ________.
A) increase;125
B) increase;100
C) increase;75
D) decrease;125
E) decrease;75
A) increase;125
B) increase;100
C) increase;75
D) decrease;125
E) decrease;75
Unlock Deck
Unlock for access to all 111 flashcards in this deck.
Unlock Deck
k this deck
77
Which of the following is NOT a reason to see inequality in income between individual X and individual Y?
A) X was born into a wealthy family,while Y was not.
B) X has a disability making it difficult to work,while Y does not.
C) X goes to university in the East,while Y goes to university in the West.
D) X is black,while Y is white.
E) X's father owns a multi-million dollar company,while Y's father is a janitor.
Unlock Deck
Unlock for access to all 111 flashcards in this deck.
Unlock Deck
k this deck
78
The principle of diminishing marginal utility implies that,the closer a society is to absolute equality,the ________ is the size of the gains in total utility caused by further ________ in inequality.
A) larger;increases
B) larger;reductions
C) smaller;increases
D) smaller;reductions
E) more important;increases
A) larger;increases
B) larger;reductions
C) smaller;increases
D) smaller;reductions
E) more important;increases
Unlock Deck
Unlock for access to all 111 flashcards in this deck.
Unlock Deck
k this deck
79
The justification made by utilitarianism for redistributing income is based on the idea that
A) wealthy people provide society with less utility than those of modest means.
B) it is morally fair.
C) the gains of the wealthy are frequently undeserved.
D) the marginal utility of income declines as income increases.
E) the marginal utility of income rises as income increases.
A) wealthy people provide society with less utility than those of modest means.
B) it is morally fair.
C) the gains of the wealthy are frequently undeserved.
D) the marginal utility of income declines as income increases.
E) the marginal utility of income rises as income increases.
Unlock Deck
Unlock for access to all 111 flashcards in this deck.
Unlock Deck
k this deck
80
An advocate of utilitarianism would argue that an extra $1000
A) provides a greater increase in utility to a poor person than to a wealthy person.
B) is of no value to the truly wealthy.
C) provides the same increase in utility for both the wealthy and the poor.
D) provides the same decrease in utility for both the wealthy and the poor.
E) is taxed so heavily that the wealthy have little incentive to earn it.
Unlock Deck
Unlock for access to all 111 flashcards in this deck.
Unlock Deck
k this deck
Unlock Deck
Unlock for access to all 111 flashcards in this deck.


