Deck 13: Simulation Modeling
Full screen (f)
Question
Question
Question
Question
Question
Question
Question
Question
Question
Question
Question
Question
Question
Question
Question
Question
Question
Question
Question
Question
Question
Question
Question
Question
Question
Question
Table 13-1
The table below represents the probability distribution for machine breakdowns in a day of operation.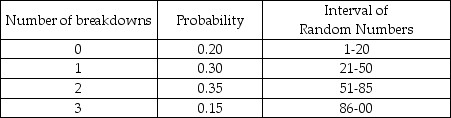
According to Table 13-1,what is the probability of at least one breakdown?
A)0.2
B)0.3
C)0.5
D)0.8
E)0.85
The table below represents the probability distribution for machine breakdowns in a day of operation.
According to Table 13-1,what is the probability of at least one breakdown?
A)0.2
B)0.3
C)0.5
D)0.8
E)0.85
Question
Question
Question
Question
Question
Question
Table 13-1
The table below represents the probability distribution for machine breakdowns in a day of operation.
According to Table 13-1,what is the cumulative probability of 2 breakdowns?
A)0.35
B)0.50
C)0.85
D)0.15
E)0.20
The table below represents the probability distribution for machine breakdowns in a day of operation.
According to Table 13-1,what is the cumulative probability of 2 breakdowns?
A)0.35
B)0.50
C)0.85
D)0.15
E)0.20
Question
Question
Table 13-1
The table below represents the probability distribution for machine breakdowns in a day of operation.
According to Table 13-1,if a random number of 00 is drawn,what would the simulated number of breakdowns be?
A)0
B)1
C)2
D)3
E)Not enough information provided
The table below represents the probability distribution for machine breakdowns in a day of operation.
According to Table 13-1,if a random number of 00 is drawn,what would the simulated number of breakdowns be?
A)0
B)1
C)2
D)3
E)Not enough information provided
Question
Question
Question
Table 13-2
A new young mother has opened a cloth diaper service.She is interested in simulating the number of diapers required for a one-year-old.She hopes to use this data to show the cost effectiveness of cloth diapers.The table below shows the number of diapers demanded daily and the probabilities associated with each level of demand.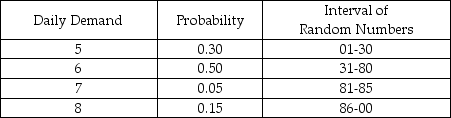
According to Table 13-2,if the random number 40 were generated for a particular day,what would the simulated demand be for that day?
A)5
B)6
C)7
D)20
E)None of the above
Question
Question
Question
Question
Table 13-5 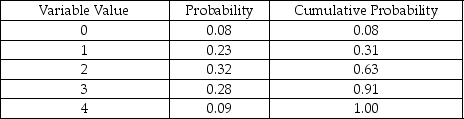
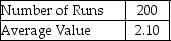
According to Table 13-5,which presents a summary of the Monte Carlo output from a simulation of 200 runs,there are 5 possible values for the variable of concern.If this variable represents the number of machine breakdowns during a day,what is the probability that the number of breakdowns is 2 or fewer?
A)0.23
B)0.31
C)0.32
D)0.63
E)None of the above
Question
Table 13-4
A pawn shop in Arlington,Texas,has a drive-through window to better serve customers.The following tables provide information about the time between arrivals and the service times required at the window on a particularly busy day of the week.All times are in minutes.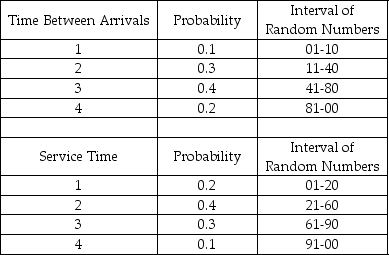 The first random number generated for arrivals is used to tell when the first customer arrives after opening.
According to Table 13-4,the time between successive arrivals is 1,2,3,or 4 minutes.If the store opens at 8:00 a.m. ,and random numbers are used to generate arrivals,what time would the first customer arrive if the first random number were 02?
A)8:01
B)8:02
C)8:03
D)8:04
E)None of the above
A pawn shop in Arlington,Texas,has a drive-through window to better serve customers.The following tables provide information about the time between arrivals and the service times required at the window on a particularly busy day of the week.All times are in minutes.
The first random number generated for arrivals is used to tell when the first customer arrives after opening.According to Table 13-4,the time between successive arrivals is 1,2,3,or 4 minutes.If the store opens at 8:00 a.m. ,and random numbers are used to generate arrivals,what time would the first customer arrive if the first random number were 02?
A)8:01
B)8:02
C)8:03
D)8:04
E)None of the above
Question
Table 13-3
A pharmacy is considering hiring another pharmacist to better serve customers.To help analyze this situation,records are kept to determine how many customers will arrive in any 10-minute interval.Based on 100 ten-minute intervals,the following probability distribution has been developed and random numbers assigned to each event.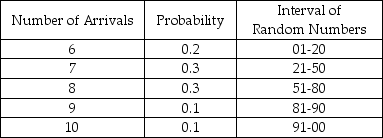
According to Table 13-3,the number of arrivals in any 10-minute period is between 6 and 10 inclusive.Suppose the next 3 random numbers were 02,81,and 18.These numbers are used to simulate arrivals into the pharmacy.What would the average number of arrivals per 10-minute period be based on this set of occurrences?
A)6
B)7
C)8
D)9
E)None of the above
Question
Question
Table 13-3
A pharmacy is considering hiring another pharmacist to better serve customers.To help analyze this situation,records are kept to determine how many customers will arrive in any 10-minute interval.Based on 100 ten-minute intervals,the following probability distribution has been developed and random numbers assigned to each event.
According to Table 13-3,the number of arrivals in any 10-minute period is between 6 and 10,inclusive.Suppose the next three random numbers were 20,50,and 79,and these were used to simulate arrivals in the next three 10-minute intervals.How many customers would have arrived during this 30-minute time period?
A)18
B)19
C)20
D)21
E)None of the above
Question
Table 13-3
A pharmacy is considering hiring another pharmacist to better serve customers.To help analyze this situation,records are kept to determine how many customers will arrive in any 10-minute interval.Based on 100 ten-minute intervals,the following probability distribution has been developed and random numbers assigned to each event.
According to Table 13-3,the number of arrivals in any 10-minute period is between 6 and 10,inclusive.Suppose the next three random numbers were 18,89,and 67,and these were used to simulate arrivals in the next three 10-minute intervals.How many customers would have arrived during this 30-minute time period?
A)22
B)23
C)24
D)25
E)None of the above
Question
Table 13-4
A pawn shop in Arlington,Texas,has a drive-through window to better serve customers.The following tables provide information about the time between arrivals and the service times required at the window on a particularly busy day of the week.All times are in minutes. The first random number generated for arrivals is used to tell when the first customer arrives after opening.
According to Table 13-4,the time between successive arrivals is 1,2,3,or 4 minutes.The store opens at 8:00 a.m. ,and random numbers are used to generate arrivals and service times.The first 3 random numbers to generate arrivals are 09,89,and 26.What time does the third customer arrive?
A)8:07
B)8:08
C)8:09
D)8:10
E)None of the above
A pawn shop in Arlington,Texas,has a drive-through window to better serve customers.The following tables provide information about the time between arrivals and the service times required at the window on a particularly busy day of the week.All times are in minutes.
The first random number generated for arrivals is used to tell when the first customer arrives after opening.According to Table 13-4,the time between successive arrivals is 1,2,3,or 4 minutes.The store opens at 8:00 a.m. ,and random numbers are used to generate arrivals and service times.The first 3 random numbers to generate arrivals are 09,89,and 26.What time does the third customer arrive?
A)8:07
B)8:08
C)8:09
D)8:10
E)None of the above
Question
Question
Question
Table 13-5
According to Table 13-5,which presents a summary of the Monte Carlo output from a simulation of 200 runs,there are 5 possible values for the variable of concern.If random numbers between 01 and 100 are used to generate values,then a random draw of 72 would produce a variable value of
A)0.
B)1.
C)2.
D)3.
E)4.
Question
Question
Question
Table 13-2
A new young mother has opened a cloth diaper service.She is interested in simulating the number of diapers required for a one-year-old.She hopes to use this data to show the cost effectiveness of cloth diapers.The table below shows the number of diapers demanded daily and the probabilities associated with each level of demand.
According to Table 13-2,if the random number 96 were generated for a particular day,what would the simulated demand be for that day?
A)5
B)6
C)7
D)8
E)None of the above
Question
Table 13-4
A pawn shop in Arlington,Texas,has a drive-through window to better serve customers.The following tables provide information about the time between arrivals and the service times required at the window on a particularly busy day of the week.All times are in minutes. The first random number generated for arrivals is used to tell when the first customer arrives after opening.
According to Table 13-4,the time between successive arrivals is 1,2,3,or 4 minutes.The store opens at 8:00 a.m. ,and random numbers are used to generate arrivals and service times.The first random number to generate an arrival is 39,while the first service time is generated by the random number 94.What time would the first customer finish transacting business?
A)8:03
B)8:04
C)8:05
D)8:06
E)None of the above
A pawn shop in Arlington,Texas,has a drive-through window to better serve customers.The following tables provide information about the time between arrivals and the service times required at the window on a particularly busy day of the week.All times are in minutes.
The first random number generated for arrivals is used to tell when the first customer arrives after opening.According to Table 13-4,the time between successive arrivals is 1,2,3,or 4 minutes.The store opens at 8:00 a.m. ,and random numbers are used to generate arrivals and service times.The first random number to generate an arrival is 39,while the first service time is generated by the random number 94.What time would the first customer finish transacting business?
A)8:03
B)8:04
C)8:05
D)8:06
E)None of the above
Question
Table 13-4
A pawn shop in Arlington,Texas,has a drive-through window to better serve customers.The following tables provide information about the time between arrivals and the service times required at the window on a particularly busy day of the week.All times are in minutes. The first random number generated for arrivals is used to tell when the first customer arrives after opening.
According to Table 13-4,the time between successive arrivals is 1,2,3,or 4 minutes.The store opens at 8:00 a.m. ,and random numbers are used to generate arrivals and service times.The first two random numbers for arrivals are 95 and 08.The first two random numbers for service times are 92 and 18.At what time does the second customer finish transacting business?
A)8:07
B)8:08
C)8:09
D)8:10
E)None of the above
A pawn shop in Arlington,Texas,has a drive-through window to better serve customers.The following tables provide information about the time between arrivals and the service times required at the window on a particularly busy day of the week.All times are in minutes.
The first random number generated for arrivals is used to tell when the first customer arrives after opening.According to Table 13-4,the time between successive arrivals is 1,2,3,or 4 minutes.The store opens at 8:00 a.m. ,and random numbers are used to generate arrivals and service times.The first two random numbers for arrivals are 95 and 08.The first two random numbers for service times are 92 and 18.At what time does the second customer finish transacting business?
A)8:07
B)8:08
C)8:09
D)8:10
E)None of the above
Question
Question
Question
Question
Table 13-5
According to Table 13-5,which presents a summary of the Monte Carlo output from a simulation of 200 runs,there are 5 possible values for the variable of concern.If this variable represents the number of machine breakdowns during a day,what is the probability that the number of breakdowns is more than 4?
A)0
B)0.08
C)0.09
D)1.00
E)None of the above
Question
Table 13-2
A new young mother has opened a cloth diaper service.She is interested in simulating the number of diapers required for a one-year-old.She hopes to use this data to show the cost effectiveness of cloth diapers.The table below shows the number of diapers demanded daily and the probabilities associated with each level of demand.
According to Table 13-2,what is the cumulative probability that demand is less than or equal to 7?
A)0.85
B)0.95
C)0.80
D)0.15
E)None of the above
Question
Question
Question
Consider the interval of random numbers presented below.The following random numbers have been generated: 99,98,26,09,49,52,33,89,21,37.Simulate 10 hours of arrivals at this gas station.What is the average number of arrivals during this period? 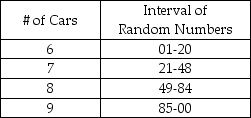
Question
Question
Question
A certain grocery store has created the following tables of intervals of random numbers with regard to the number of people who arrive at its three checkout stands ready to check out,and the time it takes to check out the individuals.Simulate the utilization rate of the three checkout stands over four minutes using the following random numbers for arrivals: 07,60,49,and 95.Use the following random numbers for service: 77,76,51,and 16.Describe the results at the end of the four-minute period. 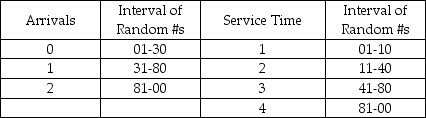
Question
A certain grocery store has noted the following figures with regard to the number of people who arrive at its three checkout stands ready to check out,and the time it takes to check out the individuals. 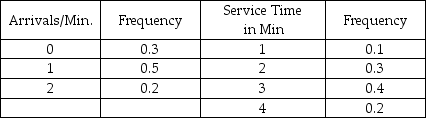 Create an appropriate table of interval of random numbers for both variables.
Create an appropriate table of interval of random numbers for both variables. Question
Question
Question
Question
A computer help desk receives new daily customer arrivals according to the following probability distribution: 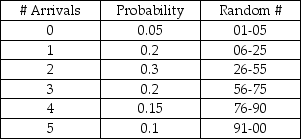 The number of customers that the help desk has the capability to serve per day is based on the following probability distribution:
 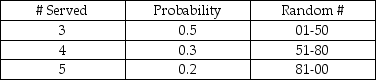 If the number of arrivals exceeds the # served capability,the customers will receive top priority the next day.The random numbers drawn for a 5-day simulation are as follows:
 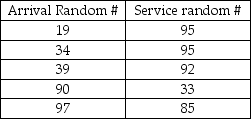 What will the average number of delays be for the 5-day simulation?
The number of customers that the help desk has the capability to serve per day is based on the following probability distribution: If the number of arrivals exceeds the # served capability,the customers will receive top priority the next day.The random numbers drawn for a 5-day simulation are as follows: What will the average number of delays be for the 5-day simulation? Question
Question
Customer arrivals adhere to the following probability distribution: 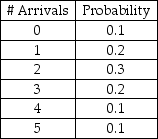 Create an appropriate table of interval of random numbers.
Create an appropriate table of interval of random numbers. Question
The demand for refrigerators at an appliance store adheres to the following probability distribution: 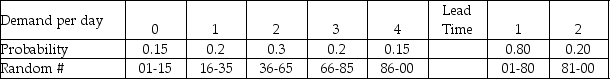 The store orders 4 refrigerators per day to have in stock to meet demand.They are trying to maintain low inventory levels.The holding cost is $5/unit/day.The ordering cost is $20 per order.The lost sale cost is $10/unit.A simulation is to be developed to estimate the average daily inventory cost over 5 days.The table below shows the random numbers to be used for refrigerator demand and lead time on orders:
 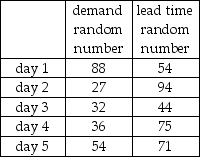 Assuming that beginning inventory is equal to 5 with no prior orders in transit,what is the overall average daily cost of inventory for the 5 days?
The store orders 4 refrigerators per day to have in stock to meet demand.They are trying to maintain low inventory levels.The holding cost is $5/unit/day.The ordering cost is $20 per order.The lost sale cost is $10/unit.A simulation is to be developed to estimate the average daily inventory cost over 5 days.The table below shows the random numbers to be used for refrigerator demand and lead time on orders: Assuming that beginning inventory is equal to 5 with no prior orders in transit,what is the overall average daily cost of inventory for the 5 days? Question
Question
Question
Question
The time between arrivals at a drive-through window of a fast-food restaurant follows the distribution given below.The service time distribution is also given in the table below.Use the random numbers provided to simulate the activity of the first five arrivals.Assume that the window opens at 11:00 a.m.and the first arrival after this is based on the first interarrival time generated. 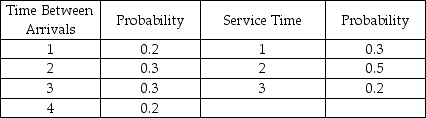 Random numbers for arrivals: 14,74,27,03
Random numbers for service times: 88,32,36,24
What times does the fourth customer leave the system?
Random numbers for arrivals: 14,74,27,03Random numbers for service times: 88,32,36,24
What times does the fourth customer leave the system?
Question
The number of cars arriving at a self-service gasoline station during the last 50 hours of operation are as follows: 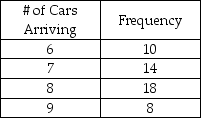 Create an appropriate table of interval of random numbers.
Create an appropriate table of interval of random numbers.
Unlock Deck
Sign up to unlock the cards in this deck!
Unlock Deck
Unlock Deck
1/79
Play
Full screen (f)
Deck 13: Simulation Modeling
1
One disadvantage of simulation is that it does not allow for "what-if?" types of questions.
False
2
The wider the variation among results produced by using different sets of random numbers,the longer we need to run the simulation to obtain reliable results.
True
3
Simulation of a business or process is generally performed by building a mathematical model to represent the process or system.
True
4
The four disadvantages of simulation are cost,its trial-and-error nature,time compression,and uniqueness.
Unlock Deck
Unlock for access to all 79 flashcards in this deck.
Unlock Deck
k this deck
5
Simulation can use any probability distribution that the user defines;it does not require standard distributions.
Unlock Deck
Unlock for access to all 79 flashcards in this deck.
Unlock Deck
k this deck
6
The Monte Carlo simulation was developed as a quantitative technique by the great mathematician John von Neumann during World War I.
Unlock Deck
Unlock for access to all 79 flashcards in this deck.
Unlock Deck
k this deck
7
Simulation models are designed to generate optimal solutions,which can then be applied to real-world situations.
Unlock Deck
Unlock for access to all 79 flashcards in this deck.
Unlock Deck
k this deck
8
A major advantage of using simulation techniques is to be able to study the interactive effect of individual components/variables.
Unlock Deck
Unlock for access to all 79 flashcards in this deck.
Unlock Deck
k this deck
9
If we are using a Monte Carlo simulation model,we should expect the model to produce the same results for each set of random numbers used.
Unlock Deck
Unlock for access to all 79 flashcards in this deck.
Unlock Deck
k this deck
10
Despite the power of simulation,less than 20% of the largest U.S.corporations use simulation in corporate planning.
Unlock Deck
Unlock for access to all 79 flashcards in this deck.
Unlock Deck
k this deck
11
Simulation models are limited to using standard probability distributions such as Poisson,exponential,normal,etc.
Unlock Deck
Unlock for access to all 79 flashcards in this deck.
Unlock Deck
k this deck
12
Simulation is very flexible.Thus,its solutions and inferences are usually transferable to other problems.
Unlock Deck
Unlock for access to all 79 flashcards in this deck.
Unlock Deck
k this deck
13
The probability of selecting any random number in a two digit table is 1/100.
Unlock Deck
Unlock for access to all 79 flashcards in this deck.
Unlock Deck
k this deck
14
Simulation models are useful for economic order quantity problems with probabilistic demand and lead time.
Unlock Deck
Unlock for access to all 79 flashcards in this deck.
Unlock Deck
k this deck
15
While it is powerful,simulation is not considered to be a flexible quantitative analysis tool.
Unlock Deck
Unlock for access to all 79 flashcards in this deck.
Unlock Deck
k this deck
16
When using a random number generator,one should never start in the middle of the table of random numbers.
Unlock Deck
Unlock for access to all 79 flashcards in this deck.
Unlock Deck
k this deck
17
Simulation models may contain both deterministic and probabilistic variables.
Unlock Deck
Unlock for access to all 79 flashcards in this deck.
Unlock Deck
k this deck
18
The Monte Carlo simulation is used with variables that are probabilistic.
Unlock Deck
Unlock for access to all 79 flashcards in this deck.
Unlock Deck
k this deck
19
One of the major advantages of simulation is "time compression," i.e. ,the ability to study in a relatively short period,activities that would,in reality,take place over a period of days,months,or even years.
Unlock Deck
Unlock for access to all 79 flashcards in this deck.
Unlock Deck
k this deck
20
To "simulate" is to try to duplicate the features,appearance,and characteristics of a real system.
Unlock Deck
Unlock for access to all 79 flashcards in this deck.
Unlock Deck
k this deck
21
The Monte Carlo simulation was developed by
A)John von Neumann.
B)Eric von Brock.
C)A.K.Erlang.
D)P.K.Poisson.
E)J.D.Monte Carlo.
A)John von Neumann.
B)Eric von Brock.
C)A.K.Erlang.
D)P.K.Poisson.
E)J.D.Monte Carlo.
Unlock Deck
Unlock for access to all 79 flashcards in this deck.
Unlock Deck
k this deck
22
Validation relates to building the right model.
Unlock Deck
Unlock for access to all 79 flashcards in this deck.
Unlock Deck
k this deck
23
Simulation that is used with queuing models are probabilistic and do not have Poisson arrivals nor exponential service times.
Unlock Deck
Unlock for access to all 79 flashcards in this deck.
Unlock Deck
k this deck
24
A flow diagram is helpful in the logical coding procedures for programming a simulation process.
Unlock Deck
Unlock for access to all 79 flashcards in this deck.
Unlock Deck
k this deck
25
If,for a simple queuing or waiting line problem,we compare the solution from an analytical model with that from a simulation,we will typically find them to be exactly the same.
Unlock Deck
Unlock for access to all 79 flashcards in this deck.
Unlock Deck
k this deck
26
Table 13-1
The table below represents the probability distribution for machine breakdowns in a day of operation.
According to Table 13-1,what is the probability of at least one breakdown?
A)0.2
B)0.3
C)0.5
D)0.8
E)0.85
The table below represents the probability distribution for machine breakdowns in a day of operation.
According to Table 13-1,what is the probability of at least one breakdown?
A)0.2
B)0.3
C)0.5
D)0.8
E)0.85
Unlock Deck
Unlock for access to all 79 flashcards in this deck.
Unlock Deck
k this deck
27
When establishing a probability distribution based on historical outcomes,the relative frequency for each possible outcome of a variable is found by dividing the frequency of each outcome by the total number of observations.
Unlock Deck
Unlock for access to all 79 flashcards in this deck.
Unlock Deck
k this deck
28
The advantage of simulation over queuing or waiting line models is that simulation allows us to relax our assumptions regarding arrival and service distributions.
Unlock Deck
Unlock for access to all 79 flashcards in this deck.
Unlock Deck
k this deck
29
What is the probability of selecting any random number from a two digit table?
A)0.001
B)0.01
C)0.10
D)0.02
E)Not enough information provided
A)0.001
B)0.01
C)0.10
D)0.02
E)Not enough information provided
Unlock Deck
Unlock for access to all 79 flashcards in this deck.
Unlock Deck
k this deck
30
Operational gaming involves a single player competing with the computer simulated game.
Unlock Deck
Unlock for access to all 79 flashcards in this deck.
Unlock Deck
k this deck
31
Deterministic inventory models require the use of simulation.
Unlock Deck
Unlock for access to all 79 flashcards in this deck.
Unlock Deck
k this deck
32
Table 13-1
The table below represents the probability distribution for machine breakdowns in a day of operation.
According to Table 13-1,what is the cumulative probability of 2 breakdowns?
A)0.35
B)0.50
C)0.85
D)0.15
E)0.20
The table below represents the probability distribution for machine breakdowns in a day of operation.
According to Table 13-1,what is the cumulative probability of 2 breakdowns?
A)0.35
B)0.50
C)0.85
D)0.15
E)0.20
Unlock Deck
Unlock for access to all 79 flashcards in this deck.
Unlock Deck
k this deck
33
There are three categories of simulation models: Monte Carlo,operational gaming,and systems simulation.
Unlock Deck
Unlock for access to all 79 flashcards in this deck.
Unlock Deck
k this deck
34
Table 13-1
The table below represents the probability distribution for machine breakdowns in a day of operation.
According to Table 13-1,if a random number of 00 is drawn,what would the simulated number of breakdowns be?
A)0
B)1
C)2
D)3
E)Not enough information provided
The table below represents the probability distribution for machine breakdowns in a day of operation.
According to Table 13-1,if a random number of 00 is drawn,what would the simulated number of breakdowns be?
A)0
B)1
C)2
D)3
E)Not enough information provided
Unlock Deck
Unlock for access to all 79 flashcards in this deck.
Unlock Deck
k this deck
35
Which of the following is not an advantage of simulation?
A)It allows for the study of what-if questions.
B)Each simulation model is unique.
C)It allows the study of interaction of components or variables to determine which are important.
D)It allows time compression.
E)None of the above
A)It allows for the study of what-if questions.
B)Each simulation model is unique.
C)It allows the study of interaction of components or variables to determine which are important.
D)It allows time compression.
E)None of the above
Unlock Deck
Unlock for access to all 79 flashcards in this deck.
Unlock Deck
k this deck
36
In assigning random numbers in a Monte Carlo simulation,
A)it is important to develop a cumulative probability distribution.
B)it is important to use a normal distribution for all variables simulated.
C)it is not important to assign probabilities to an exact range of random number intervals.
D)All of the above
E)None of the above
A)it is important to develop a cumulative probability distribution.
B)it is important to use a normal distribution for all variables simulated.
C)it is not important to assign probabilities to an exact range of random number intervals.
D)All of the above
E)None of the above
Unlock Deck
Unlock for access to all 79 flashcards in this deck.
Unlock Deck
k this deck
37
Table 13-2
A new young mother has opened a cloth diaper service.She is interested in simulating the number of diapers required for a one-year-old.She hopes to use this data to show the cost effectiveness of cloth diapers.The table below shows the number of diapers demanded daily and the probabilities associated with each level of demand.
According to Table 13-2,if the random number 40 were generated for a particular day,what would the simulated demand be for that day?
A)5
B)6
C)7
D)20
E)None of the above
Unlock Deck
Unlock for access to all 79 flashcards in this deck.
Unlock Deck
k this deck
38
Simulation can be effectively used in many
A)inventory problems.
B)plant layout problems.
C)maintenance policy problems.
D)sales forecasting problems.
E)All of the above
A)inventory problems.
B)plant layout problems.
C)maintenance policy problems.
D)sales forecasting problems.
E)All of the above
Unlock Deck
Unlock for access to all 79 flashcards in this deck.
Unlock Deck
k this deck
39
If,in a simple queuing or waiting line problem,we wish to know the maximum likely waiting time,or the maximum likely length of the line,we must use a simulation model.
Unlock Deck
Unlock for access to all 79 flashcards in this deck.
Unlock Deck
k this deck
40
Simulation of maintenance problems can help management analyze various staffing strategies based on machine downtime and labor cost.
Unlock Deck
Unlock for access to all 79 flashcards in this deck.
Unlock Deck
k this deck
41
Table 13-5
According to Table 13-5,which presents a summary of the Monte Carlo output from a simulation of 200 runs,there are 5 possible values for the variable of concern.If this variable represents the number of machine breakdowns during a day,what is the probability that the number of breakdowns is 2 or fewer?
A)0.23
B)0.31
C)0.32
D)0.63
E)None of the above
Unlock Deck
Unlock for access to all 79 flashcards in this deck.
Unlock Deck
k this deck
42
Table 13-4
A pawn shop in Arlington,Texas,has a drive-through window to better serve customers.The following tables provide information about the time between arrivals and the service times required at the window on a particularly busy day of the week.All times are in minutes. The first random number generated for arrivals is used to tell when the first customer arrives after opening.
According to Table 13-4,the time between successive arrivals is 1,2,3,or 4 minutes.If the store opens at 8:00 a.m. ,and random numbers are used to generate arrivals,what time would the first customer arrive if the first random number were 02?
A)8:01
B)8:02
C)8:03
D)8:04
E)None of the above
A pawn shop in Arlington,Texas,has a drive-through window to better serve customers.The following tables provide information about the time between arrivals and the service times required at the window on a particularly busy day of the week.All times are in minutes.
The first random number generated for arrivals is used to tell when the first customer arrives after opening.According to Table 13-4,the time between successive arrivals is 1,2,3,or 4 minutes.If the store opens at 8:00 a.m. ,and random numbers are used to generate arrivals,what time would the first customer arrive if the first random number were 02?
A)8:01
B)8:02
C)8:03
D)8:04
E)None of the above
Unlock Deck
Unlock for access to all 79 flashcards in this deck.
Unlock Deck
k this deck
43
Table 13-3
A pharmacy is considering hiring another pharmacist to better serve customers.To help analyze this situation,records are kept to determine how many customers will arrive in any 10-minute interval.Based on 100 ten-minute intervals,the following probability distribution has been developed and random numbers assigned to each event.
According to Table 13-3,the number of arrivals in any 10-minute period is between 6 and 10 inclusive.Suppose the next 3 random numbers were 02,81,and 18.These numbers are used to simulate arrivals into the pharmacy.What would the average number of arrivals per 10-minute period be based on this set of occurrences?
A)6
B)7
C)8
D)9
E)None of the above
Unlock Deck
Unlock for access to all 79 flashcards in this deck.
Unlock Deck
k this deck
44
Simulation models can be broken down into which of the following three categories?
A)Monte Carlo,queuing,and inventory
B)queuing,inventory,and maintenance policy
C)Monte Carlo,operational gaming,systems simulation
D)inventory,systems simulation,and operational gaming
E)None of the above
A)Monte Carlo,queuing,and inventory
B)queuing,inventory,and maintenance policy
C)Monte Carlo,operational gaming,systems simulation
D)inventory,systems simulation,and operational gaming
E)None of the above
Unlock Deck
Unlock for access to all 79 flashcards in this deck.
Unlock Deck
k this deck
45
Table 13-3
A pharmacy is considering hiring another pharmacist to better serve customers.To help analyze this situation,records are kept to determine how many customers will arrive in any 10-minute interval.Based on 100 ten-minute intervals,the following probability distribution has been developed and random numbers assigned to each event.
According to Table 13-3,the number of arrivals in any 10-minute period is between 6 and 10,inclusive.Suppose the next three random numbers were 20,50,and 79,and these were used to simulate arrivals in the next three 10-minute intervals.How many customers would have arrived during this 30-minute time period?
A)18
B)19
C)20
D)21
E)None of the above
Unlock Deck
Unlock for access to all 79 flashcards in this deck.
Unlock Deck
k this deck
46
Table 13-3
A pharmacy is considering hiring another pharmacist to better serve customers.To help analyze this situation,records are kept to determine how many customers will arrive in any 10-minute interval.Based on 100 ten-minute intervals,the following probability distribution has been developed and random numbers assigned to each event.
According to Table 13-3,the number of arrivals in any 10-minute period is between 6 and 10,inclusive.Suppose the next three random numbers were 18,89,and 67,and these were used to simulate arrivals in the next three 10-minute intervals.How many customers would have arrived during this 30-minute time period?
A)22
B)23
C)24
D)25
E)None of the above
Unlock Deck
Unlock for access to all 79 flashcards in this deck.
Unlock Deck
k this deck
47
Table 13-4
A pawn shop in Arlington,Texas,has a drive-through window to better serve customers.The following tables provide information about the time between arrivals and the service times required at the window on a particularly busy day of the week.All times are in minutes. The first random number generated for arrivals is used to tell when the first customer arrives after opening.
According to Table 13-4,the time between successive arrivals is 1,2,3,or 4 minutes.The store opens at 8:00 a.m. ,and random numbers are used to generate arrivals and service times.The first 3 random numbers to generate arrivals are 09,89,and 26.What time does the third customer arrive?
A)8:07
B)8:08
C)8:09
D)8:10
E)None of the above
A pawn shop in Arlington,Texas,has a drive-through window to better serve customers.The following tables provide information about the time between arrivals and the service times required at the window on a particularly busy day of the week.All times are in minutes.
The first random number generated for arrivals is used to tell when the first customer arrives after opening.According to Table 13-4,the time between successive arrivals is 1,2,3,or 4 minutes.The store opens at 8:00 a.m. ,and random numbers are used to generate arrivals and service times.The first 3 random numbers to generate arrivals are 09,89,and 26.What time does the third customer arrive?
A)8:07
B)8:08
C)8:09
D)8:10
E)None of the above
Unlock Deck
Unlock for access to all 79 flashcards in this deck.
Unlock Deck
k this deck
48
Which of the following is not considered one of the 5 steps of Monte Carlo Simulation?
A)establishing probability distributions for important input variables
B)generating random number
C)building a cumulative probability distribution for each input variable
D)establishing an objective function
E)simulating a series of trials
A)establishing probability distributions for important input variables
B)generating random number
C)building a cumulative probability distribution for each input variable
D)establishing an objective function
E)simulating a series of trials
Unlock Deck
Unlock for access to all 79 flashcards in this deck.
Unlock Deck
k this deck
49
The logic in a simulation model is presented graphically through which of the following?
A)scatterplot
B)flowchart
C)blueprint
D)decision tree
E)None of the above
A)scatterplot
B)flowchart
C)blueprint
D)decision tree
E)None of the above
Unlock Deck
Unlock for access to all 79 flashcards in this deck.
Unlock Deck
k this deck
50
Table 13-5
According to Table 13-5,which presents a summary of the Monte Carlo output from a simulation of 200 runs,there are 5 possible values for the variable of concern.If random numbers between 01 and 100 are used to generate values,then a random draw of 72 would produce a variable value of
A)0.
B)1.
C)2.
D)3.
E)4.
Unlock Deck
Unlock for access to all 79 flashcards in this deck.
Unlock Deck
k this deck
51
The process of comparing a model to the real system that it represents to make sure it is accurate is called
A)validation.
B)verification.
C)simulation.
D)experimentation.
E)None of the above
A)validation.
B)verification.
C)simulation.
D)experimentation.
E)None of the above
Unlock Deck
Unlock for access to all 79 flashcards in this deck.
Unlock Deck
k this deck
52
The use of simulations in competitive situations is called
A)Monte Carlo simulation.
B)systems simulation.
C)operational gaming.
D)virtual reality.
E)None of the above
A)Monte Carlo simulation.
B)systems simulation.
C)operational gaming.
D)virtual reality.
E)None of the above
Unlock Deck
Unlock for access to all 79 flashcards in this deck.
Unlock Deck
k this deck
53
Table 13-2
A new young mother has opened a cloth diaper service.She is interested in simulating the number of diapers required for a one-year-old.She hopes to use this data to show the cost effectiveness of cloth diapers.The table below shows the number of diapers demanded daily and the probabilities associated with each level of demand.
According to Table 13-2,if the random number 96 were generated for a particular day,what would the simulated demand be for that day?
A)5
B)6
C)7
D)8
E)None of the above
Unlock Deck
Unlock for access to all 79 flashcards in this deck.
Unlock Deck
k this deck
54
Table 13-4
A pawn shop in Arlington,Texas,has a drive-through window to better serve customers.The following tables provide information about the time between arrivals and the service times required at the window on a particularly busy day of the week.All times are in minutes. The first random number generated for arrivals is used to tell when the first customer arrives after opening.
According to Table 13-4,the time between successive arrivals is 1,2,3,or 4 minutes.The store opens at 8:00 a.m. ,and random numbers are used to generate arrivals and service times.The first random number to generate an arrival is 39,while the first service time is generated by the random number 94.What time would the first customer finish transacting business?
A)8:03
B)8:04
C)8:05
D)8:06
E)None of the above
A pawn shop in Arlington,Texas,has a drive-through window to better serve customers.The following tables provide information about the time between arrivals and the service times required at the window on a particularly busy day of the week.All times are in minutes.
The first random number generated for arrivals is used to tell when the first customer arrives after opening.According to Table 13-4,the time between successive arrivals is 1,2,3,or 4 minutes.The store opens at 8:00 a.m. ,and random numbers are used to generate arrivals and service times.The first random number to generate an arrival is 39,while the first service time is generated by the random number 94.What time would the first customer finish transacting business?
A)8:03
B)8:04
C)8:05
D)8:06
E)None of the above
Unlock Deck
Unlock for access to all 79 flashcards in this deck.
Unlock Deck
k this deck
55
Table 13-4
A pawn shop in Arlington,Texas,has a drive-through window to better serve customers.The following tables provide information about the time between arrivals and the service times required at the window on a particularly busy day of the week.All times are in minutes. The first random number generated for arrivals is used to tell when the first customer arrives after opening.
According to Table 13-4,the time between successive arrivals is 1,2,3,or 4 minutes.The store opens at 8:00 a.m. ,and random numbers are used to generate arrivals and service times.The first two random numbers for arrivals are 95 and 08.The first two random numbers for service times are 92 and 18.At what time does the second customer finish transacting business?
A)8:07
B)8:08
C)8:09
D)8:10
E)None of the above
A pawn shop in Arlington,Texas,has a drive-through window to better serve customers.The following tables provide information about the time between arrivals and the service times required at the window on a particularly busy day of the week.All times are in minutes.
The first random number generated for arrivals is used to tell when the first customer arrives after opening.According to Table 13-4,the time between successive arrivals is 1,2,3,or 4 minutes.The store opens at 8:00 a.m. ,and random numbers are used to generate arrivals and service times.The first two random numbers for arrivals are 95 and 08.The first two random numbers for service times are 92 and 18.At what time does the second customer finish transacting business?
A)8:07
B)8:08
C)8:09
D)8:10
E)None of the above
Unlock Deck
Unlock for access to all 79 flashcards in this deck.
Unlock Deck
k this deck
56
Which of the following scenarios would require simulation for a queuing model?
A)Poisson arrival process
B)exponential service time
C)deterministic arrival process
D)deterministic service time
E)None of the above
A)Poisson arrival process
B)exponential service time
C)deterministic arrival process
D)deterministic service time
E)None of the above
Unlock Deck
Unlock for access to all 79 flashcards in this deck.
Unlock Deck
k this deck
57
Which of the following represents the primary reason simulation cannot be used for the classic EOQ model?
A)too many parameters involved
B)too many decision variables
C)EOQ models are probabilistic
D)EOQ models are deterministic
E)None of the above
A)too many parameters involved
B)too many decision variables
C)EOQ models are probabilistic
D)EOQ models are deterministic
E)None of the above
Unlock Deck
Unlock for access to all 79 flashcards in this deck.
Unlock Deck
k this deck
58
Which of the following variables are probabilistic in an inventory model that requires simulation?
A)demand only
B)lead time only
C)holding cost only
D)Both A and B
E)A,B,and C
A)demand only
B)lead time only
C)holding cost only
D)Both A and B
E)A,B,and C
Unlock Deck
Unlock for access to all 79 flashcards in this deck.
Unlock Deck
k this deck
59
Table 13-5
According to Table 13-5,which presents a summary of the Monte Carlo output from a simulation of 200 runs,there are 5 possible values for the variable of concern.If this variable represents the number of machine breakdowns during a day,what is the probability that the number of breakdowns is more than 4?
A)0
B)0.08
C)0.09
D)1.00
E)None of the above
Unlock Deck
Unlock for access to all 79 flashcards in this deck.
Unlock Deck
k this deck
60
Table 13-2
A new young mother has opened a cloth diaper service.She is interested in simulating the number of diapers required for a one-year-old.She hopes to use this data to show the cost effectiveness of cloth diapers.The table below shows the number of diapers demanded daily and the probabilities associated with each level of demand.
According to Table 13-2,what is the cumulative probability that demand is less than or equal to 7?
A)0.85
B)0.95
C)0.80
D)0.15
E)None of the above
Unlock Deck
Unlock for access to all 79 flashcards in this deck.
Unlock Deck
k this deck
61
List the major disadvantages of simulation techniques.
Unlock Deck
Unlock for access to all 79 flashcards in this deck.
Unlock Deck
k this deck
62
The number of machine breakdowns in a day is 0,1,or 2,with probabilities 0.6,0.3,and 0.1,respectively.The following random numbers have been generated: 13,10,02,18,31,19,32,85,31,94.Use these numbers to generate the number of breakdowns for 10 consecutive days.What proportion of these days had at least one breakdown?
Unlock Deck
Unlock for access to all 79 flashcards in this deck.
Unlock Deck
k this deck
63
Consider the interval of random numbers presented below.The following random numbers have been generated: 99,98,26,09,49,52,33,89,21,37.Simulate 10 hours of arrivals at this gas station.What is the average number of arrivals during this period?
Unlock Deck
Unlock for access to all 79 flashcards in this deck.
Unlock Deck
k this deck
64
List the major advantages of simulation techniques.
Unlock Deck
Unlock for access to all 79 flashcards in this deck.
Unlock Deck
k this deck
65
Describe the conditions when simulation is useful for inventory analysis.
Unlock Deck
Unlock for access to all 79 flashcards in this deck.
Unlock Deck
k this deck
66
A certain grocery store has created the following tables of intervals of random numbers with regard to the number of people who arrive at its three checkout stands ready to check out,and the time it takes to check out the individuals.Simulate the utilization rate of the three checkout stands over four minutes using the following random numbers for arrivals: 07,60,49,and 95.Use the following random numbers for service: 77,76,51,and 16.Describe the results at the end of the four-minute period.
Unlock Deck
Unlock for access to all 79 flashcards in this deck.
Unlock Deck
k this deck
67
A certain grocery store has noted the following figures with regard to the number of people who arrive at its three checkout stands ready to check out,and the time it takes to check out the individuals. Create an appropriate table of interval of random numbers for both variables.
Create an appropriate table of interval of random numbers for both variables. Unlock Deck
Unlock for access to all 79 flashcards in this deck.
Unlock Deck
k this deck
68
What are the seven steps of simulation?
Unlock Deck
Unlock for access to all 79 flashcards in this deck.
Unlock Deck
k this deck
69
Describe the conditions when simulation is useful for queuing analysis.
Unlock Deck
Unlock for access to all 79 flashcards in this deck.
Unlock Deck
k this deck
70
Explain what is meant by a Monte Carlo simulation.
Unlock Deck
Unlock for access to all 79 flashcards in this deck.
Unlock Deck
k this deck
71
A computer help desk receives new daily customer arrivals according to the following probability distribution: The number of customers that the help desk has the capability to serve per day is based on the following probability distribution: If the number of arrivals exceeds the # served capability,the customers will receive top priority the next day.The random numbers drawn for a 5-day simulation are as follows: What will the average number of delays be for the 5-day simulation?
The number of customers that the help desk has the capability to serve per day is based on the following probability distribution: If the number of arrivals exceeds the # served capability,the customers will receive top priority the next day.The random numbers drawn for a 5-day simulation are as follows: What will the average number of delays be for the 5-day simulation? Unlock Deck
Unlock for access to all 79 flashcards in this deck.
Unlock Deck
k this deck
72
What is the difference between verification and validation?
Unlock Deck
Unlock for access to all 79 flashcards in this deck.
Unlock Deck
k this deck
73
Customer arrivals adhere to the following probability distribution: Create an appropriate table of interval of random numbers.
Create an appropriate table of interval of random numbers. Unlock Deck
Unlock for access to all 79 flashcards in this deck.
Unlock Deck
k this deck
74
The demand for refrigerators at an appliance store adheres to the following probability distribution: The store orders 4 refrigerators per day to have in stock to meet demand.They are trying to maintain low inventory levels.The holding cost is $5/unit/day.The ordering cost is $20 per order.The lost sale cost is $10/unit.A simulation is to be developed to estimate the average daily inventory cost over 5 days.The table below shows the random numbers to be used for refrigerator demand and lead time on orders: Assuming that beginning inventory is equal to 5 with no prior orders in transit,what is the overall average daily cost of inventory for the 5 days?
The store orders 4 refrigerators per day to have in stock to meet demand.They are trying to maintain low inventory levels.The holding cost is $5/unit/day.The ordering cost is $20 per order.The lost sale cost is $10/unit.A simulation is to be developed to estimate the average daily inventory cost over 5 days.The table below shows the random numbers to be used for refrigerator demand and lead time on orders: Assuming that beginning inventory is equal to 5 with no prior orders in transit,what is the overall average daily cost of inventory for the 5 days? Unlock Deck
Unlock for access to all 79 flashcards in this deck.
Unlock Deck
k this deck
75
Average daily sales of a product are 8 units.The actual number of sales each day is either 7,8,or 9,with probabilities 0.3,0.4,and 0.3,respectively.The lead time for delivery of this averages 4 days,although the time may be 3,4,or 5 days,with probabilities 0.2,0.6,and 0.2.The company plans to place an order when the inventory level drops to 32 units (based on the average demand and average lead time).The following random numbers have been generated: 60,87,46,63 (set 1)and 52,78,13,06,99,98,80,09,67,89,45 (set 2).Use set 1 of these to generate lead times and use set 2 to simulate daily demand.Simulate 2 ordering periods with this and determine how often the company runs out of stock before the shipment arrives.Assume 32 units on-hand and an order was just placed.
Unlock Deck
Unlock for access to all 79 flashcards in this deck.
Unlock Deck
k this deck
76
Explain what is meant by operational gaming and give one example.
Unlock Deck
Unlock for access to all 79 flashcards in this deck.
Unlock Deck
k this deck
77
The process of determining that the computer model is internally consistent and following the logic of the conceptual model is called
A)validation.
B)verification.
C)simulation.
D)experimentation.
E)None of the above
A)validation.
B)verification.
C)simulation.
D)experimentation.
E)None of the above
Unlock Deck
Unlock for access to all 79 flashcards in this deck.
Unlock Deck
k this deck
78
The time between arrivals at a drive-through window of a fast-food restaurant follows the distribution given below.The service time distribution is also given in the table below.Use the random numbers provided to simulate the activity of the first five arrivals.Assume that the window opens at 11:00 a.m.and the first arrival after this is based on the first interarrival time generated. Random numbers for arrivals: 14,74,27,03
Random numbers for service times: 88,32,36,24
What times does the fourth customer leave the system?
Random numbers for arrivals: 14,74,27,03Random numbers for service times: 88,32,36,24
What times does the fourth customer leave the system?
Unlock Deck
Unlock for access to all 79 flashcards in this deck.
Unlock Deck
k this deck
79
The number of cars arriving at a self-service gasoline station during the last 50 hours of operation are as follows: Create an appropriate table of interval of random numbers.
Create an appropriate table of interval of random numbers. Unlock Deck
Unlock for access to all 79 flashcards in this deck.
Unlock Deck
k this deck
Unlock Deck
Unlock for access to all 79 flashcards in this deck.


