Deck 4: Profitability Analysis
Full screen (f)
Question
Question
Question
Question
Question
Question
Net Devices Inc. The following balance sheets and income statements are for Net Devices Inc., a manufacturer of small electronic devices, including calculators, personal digital assistants and mp3 players. For purposes of these questions assume that the company has an effective tax rate of 35%.
-
Refer to the information for Net Devices Inc. What is the accounts receivable turnover ratio for Net Devices for 2011?
A) 24.65
B) 14.85
C) 14.81
D) 10.50
-
Refer to the information for Net Devices Inc. What is the accounts receivable turnover ratio for Net Devices for 2011?
A) 24.65
B) 14.85
C) 14.81
D) 10.50
Question
Question
Question
Question
Question
Question
Question
Question
Question
Net Devices Inc. The following balance sheets and income statements are for Net Devices Inc., a manufacturer of small electronic devices, including calculators, personal digital assistants and mp3 players. For purposes of these questions assume that the company has an effective tax rate of 35%.
-
Refer to the information for Net Devices Inc. What is the rate of return on assets for Net Devices for 2011?
A) 11.64%
B) 14.50%
C) 12.60%
D) 13.88%
-
Refer to the information for Net Devices Inc. What is the rate of return on assets for Net Devices for 2011?
A) 11.64%
B) 14.50%
C) 12.60%
D) 13.88%
Question
Question
Question
Question
Question
Net Devices Inc. The following balance sheets and income statements are for Net Devices Inc., a manufacturer of small electronic devices, including calculators, personal digital assistants and mp3 players. For purposes of these questions assume that the company has an effective tax rate of 35%.
-
Refer to the information for Net Devices Inc. What is the profit margin for ROA for Net Devices for 2010?
A) 7.26%
B) 4.22%
C) 5.00%
D) 3.97%
-
Refer to the information for Net Devices Inc. What is the profit margin for ROA for Net Devices for 2010?
A) 7.26%
B) 4.22%
C) 5.00%
D) 3.97%
Question
Question
Question
Question
Question
Question
Question
Question
Question
Question
Question
Question
Question
Question
Question
Question
Question
Question
Question
Question
Question
Question
Question
Question
Question
Question
Question
Question
Question
Question
Question
Question
Question
Question
Question
Question
Question
Question
Question
Question
Question
Question
Question
Question
Question
Question
Question
Question
Question
Question
Question
Question
Question
Sensitron and Douglas Tools manufacture and market power tools and accessories. Sensitron targets customers in the professional contractor market, while Douglas Tools focuses on home users and professionals. Selected financial data for the companies appears below.
 Required:

Required: Question
Question
Question
Question
Question
Question
Question

Unlock Deck
Sign up to unlock the cards in this deck!
Unlock Deck
Unlock Deck
1/95
Play
Full screen (f)
Deck 4: Profitability Analysis
1
Orca Industries Below are the two most recent balance sheets and most recent income statement for Orca Industries. The company has an effective tax rate of 35%.
-
Refer to the information for Orca Industries. The profit margin for computing ROA for Orca Industries is
A) 9.4%
B) 13.5%
C) 4.8%
D) 12.3%
-
Refer to the information for Orca Industries. The profit margin for computing ROA for Orca Industries is
A) 9.4%
B) 13.5%
C) 4.8%
D) 12.3%
9.4%
2
Asset turnover represents
A) The ability of the firm to generate income from operations for a particular level of sales.
B) The ability to generate sales from a particular investment in assets.
C) The ability to manage the level of investment in assets for a particular level of assets.
D) The number of days, on average, it takes management to turnover assets.
B
3
Orca Industries Below are the two most recent balance sheets and most recent income statement for Orca Industries. The company has an effective tax rate of 35%
-
Refer to the information for Orca Industries. The return on common shareholders' equity for Orca Industries is
A) 15.2%
B) 13.5%
C) 10%
D) 11.9%
-
Refer to the information for Orca Industries. The return on common shareholders' equity for Orca Industries is
A) 15.2%
B) 13.5%
C) 10%
D) 11.9%
15.2%
4
Which of the following industries would you expect to have, on average, high asset turnover and low profit margin?
A) Hotels
B) Grocery stores
C) Utilities
D) Oil and Gas extraction
A) Hotels
B) Grocery stores
C) Utilities
D) Oil and Gas extraction
Unlock Deck
Unlock for access to all 95 flashcards in this deck.
Unlock Deck
k this deck
5
Firms with high levels of operating leverage experience which of the following in comparison to firms with low levels of operating leverage
A) Higher levels of risk in operations.
B) Lower expected rates of return.
C) Lower variability in returns on assets.
D) Higher sales.
A) Higher levels of risk in operations.
B) Lower expected rates of return.
C) Lower variability in returns on assets.
D) Higher sales.
Unlock Deck
Unlock for access to all 95 flashcards in this deck.
Unlock Deck
k this deck
6
Net Devices Inc. The following balance sheets and income statements are for Net Devices Inc., a manufacturer of small electronic devices, including calculators, personal digital assistants and mp3 players. For purposes of these questions assume that the company has an effective tax rate of 35%.
-
Refer to the information for Net Devices Inc. What is the accounts receivable turnover ratio for Net Devices for 2011?
A) 24.65
B) 14.85
C) 14.81
D) 10.50
-
Refer to the information for Net Devices Inc. What is the accounts receivable turnover ratio for Net Devices for 2011?
A) 24.65
B) 14.85
C) 14.81
D) 10.50
Unlock Deck
Unlock for access to all 95 flashcards in this deck.
Unlock Deck
k this deck
7
Orca Industries Below are the two most recent balance sheets and most recent income statement for Orca Industries. The company has an effective tax rate of 35%.
-
Refer to the information for Orca Industries. Orca's inventory turnover is
A) 2.67
B) 3.0
C) 2.4
D) 1.0
-
Refer to the information for Orca Industries. Orca's inventory turnover is
A) 2.67
B) 3.0
C) 2.4
D) 1.0
Unlock Deck
Unlock for access to all 95 flashcards in this deck.
Unlock Deck
k this deck
8
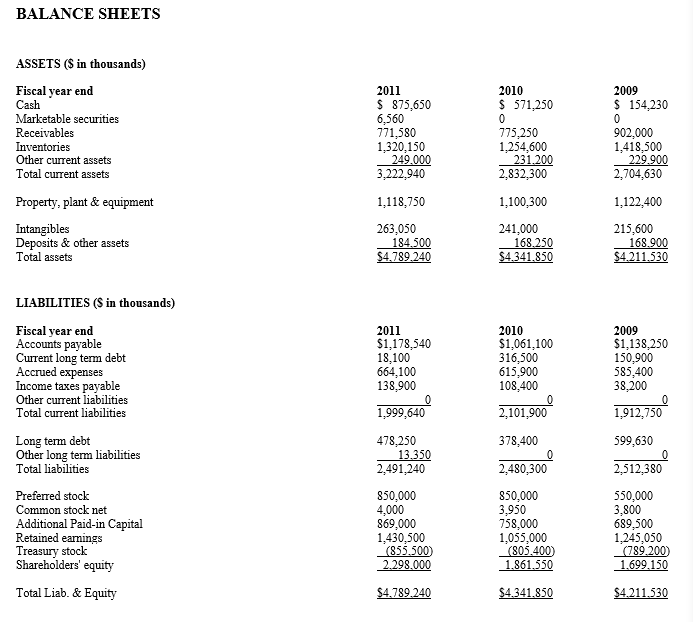
Net Devices Inc. The following balance sheets and income statements are for Net Devices Inc., a manufacturer of small electronic devices, including calculators, personal digital assistants and mp3 players. For purposes of these questions assume that the company has an effective tax rate of 35%.
BALANCE SHEETS
-
Refer to the information for Net Devices Inc. What is the inventory turnover for Net Devices for 2011?
A) 10.32
B) 8.90
C) 2.51
D) 6.23
BALANCE SHEETS
-
Refer to the information for Net Devices Inc. What is the inventory turnover for Net Devices for 2011?
A) 10.32
B) 8.90
C) 2.51
D) 6.23
Unlock Deck
Unlock for access to all 95 flashcards in this deck.
Unlock Deck
k this deck
9
Which factor does not explain differences or changes in ROA?
A) Operating leverage
B) Cyclicality of sales
C) Product life cycle
D) Financial leverage
A) Operating leverage
B) Cyclicality of sales
C) Product life cycle
D) Financial leverage
Unlock Deck
Unlock for access to all 95 flashcards in this deck.
Unlock Deck
k this deck
10
Orca Industries Below are the two most recent balance sheets and most recent income statement for Orca Industries. The company has an effective tax rate of 35%.
Refer to the information for Orca Industries. The return on assets for Orca Industries is
A) 6.8%
B) 13.5%
C) 10%
D) 12.3%
Refer to the information for Orca Industries. The return on assets for Orca Industries is
A) 6.8%
B) 13.5%
C) 10%
D) 12.3%
Unlock Deck
Unlock for access to all 95 flashcards in this deck.
Unlock Deck
k this deck
11
Return on common equity can be disaggregated into three components, which of the three is not one of the components?
A) Assets Turnover ratio
B) Profit Margin ratio
C) Debt to Equity ratio
D) Capital Structure Leverage ratio
A) Assets Turnover ratio
B) Profit Margin ratio
C) Debt to Equity ratio
D) Capital Structure Leverage ratio
Unlock Deck
Unlock for access to all 95 flashcards in this deck.
Unlock Deck
k this deck
12
Net Devices Inc. The following balance sheets and income statements are for Net Devices Inc., a manufacturer of small electronic devices, including calculators, personal digital assistants and mp3 players. For purposes of these questions assume that the company has an effective tax rate of 35%.
BALANCE SHEETS
\
-
Refer to the information for Net Devices Inc. What is Net Devices' capital structure leverage ratio for 2011?
A) 3.89
B) 1.68
C) 3.71
D) 10.32
BALANCE SHEETS
\
-
Refer to the information for Net Devices Inc. What is Net Devices' capital structure leverage ratio for 2011?
A) 3.89
B) 1.68
C) 3.71
D) 10.32
Unlock Deck
Unlock for access to all 95 flashcards in this deck.
Unlock Deck
k this deck
13
Net Devices Inc. The following balance sheets and income statements are for Net Devices Inc., a manufacturer of small electronic devices, including calculators, personal digital assistants and mp3 players. For purposes of these questions assume that the company has an effective tax rate of 35%.
BALANCE SHEETS
-
Refer to the information for Net Devices Inc. What is Net Devices' earnings per share for 2011?
A) $1.00
B) $1.70
C) $1.96
D) $0
BALANCE SHEETS
-
Refer to the information for Net Devices Inc. What is Net Devices' earnings per share for 2011?
A) $1.00
B) $1.70
C) $1.96
D) $0
Unlock Deck
Unlock for access to all 95 flashcards in this deck.
Unlock Deck
k this deck
14
Net Devices Inc. The following balance sheets and income statements are for Net Devices Inc., a manufacturer of small electronic devices, including calculators, personal digital assistants and mp3 players. For purposes of these questions assume that the company has an effective tax rate of 35%.
BALANCE SHEETS
-
Refer to the information for Net Devices Inc. What is Net Devices' return on common shareholders' equity for 2011?
A) 26.54%
B) 30.89%
C) 35.81%
D) 42.16%
BALANCE SHEETS
-
Refer to the information for Net Devices Inc. What is Net Devices' return on common shareholders' equity for 2011?
A) 26.54%
B) 30.89%
C) 35.81%
D) 42.16%
Unlock Deck
Unlock for access to all 95 flashcards in this deck.
Unlock Deck
k this deck
15
Net Devices Inc. The following balance sheets and income statements are for Net Devices Inc., a manufacturer of small electronic devices, including calculators, personal digital assistants and mp3 players. For purposes of these questions assume that the company has an effective tax rate of 35%.
-
Refer to the information for Net Devices Inc. What is the rate of return on assets for Net Devices for 2011?
A) 11.64%
B) 14.50%
C) 12.60%
D) 13.88%
-
Refer to the information for Net Devices Inc. What is the rate of return on assets for Net Devices for 2011?
A) 11.64%
B) 14.50%
C) 12.60%
D) 13.88%
Unlock Deck
Unlock for access to all 95 flashcards in this deck.
Unlock Deck
k this deck
16
Orca Industries Below are the two most recent balance sheets and most recent income statement for Orca Industries. The company has an effective tax rate of 35%.
-
Refer to the information for Orca Industries. Orca's asset turnover is
A) 1.31
B) 1
C) 1.58
D) 1.44
-
Refer to the information for Orca Industries. Orca's asset turnover is
A) 1.31
B) 1
C) 1.58
D) 1.44
Unlock Deck
Unlock for access to all 95 flashcards in this deck.
Unlock Deck
k this deck
17
Which of the following might an analyst not want to eliminate from past earnings when using past earnings to forecast future earnings?
A) nonrecurring gains from the sale of assets.
B) unusual asset impairment charges.
C) nonrecurring restructuring charges.
D) revenue from the sale of inventory.
A) nonrecurring gains from the sale of assets.
B) unusual asset impairment charges.
C) nonrecurring restructuring charges.
D) revenue from the sale of inventory.
Unlock Deck
Unlock for access to all 95 flashcards in this deck.
Unlock Deck
k this deck
18
Orca Industries Below are the two most recent balance sheets and most recent income statement for Orca Industries. The company has an effective tax rate of 35%.
-
Refer to the information for Orca Industries. Orca's accounts receivable turnover is (assume that Orca makes all sales on account)
A) 7.0
B) .53
C) 11.2
D) 10
-
Refer to the information for Orca Industries. Orca's accounts receivable turnover is (assume that Orca makes all sales on account)
A) 7.0
B) .53
C) 11.2
D) 10
Unlock Deck
Unlock for access to all 95 flashcards in this deck.
Unlock Deck
k this deck
19
One important difference between return on assets (ROA) and return on common shareholder's equity (ROCE) is
A) ROA does not differentiate based on how a company finances its assets; ROCE does.
B) ROA does not distinguish between the different types of income items, such as income from continuing operations, discontinued operations, extraordinary items and changes in accounting principles; ROCE does.
C) ROCE does not distinguish between the different types of income items, such as income from continuing operations, discontinued operations, extraordinary items and changes in accounting principles; ROA does.
D) ROCE does not differentiate based on how a company finances its assets; ROA does.
Unlock Deck
Unlock for access to all 95 flashcards in this deck.
Unlock Deck
k this deck
20
Net Devices Inc. The following balance sheets and income statements are for Net Devices Inc., a manufacturer of small electronic devices, including calculators, personal digital assistants and mp3 players. For purposes of these questions assume that the company has an effective tax rate of 35%.
-
Refer to the information for Net Devices Inc. What is the profit margin for ROA for Net Devices for 2010?
A) 7.26%
B) 4.22%
C) 5.00%
D) 3.97%
-
Refer to the information for Net Devices Inc. What is the profit margin for ROA for Net Devices for 2010?
A) 7.26%
B) 4.22%
C) 5.00%
D) 3.97%
Unlock Deck
Unlock for access to all 95 flashcards in this deck.
Unlock Deck
k this deck
21
Ramos Company included the following information in its annual report:
- Refer to the information for Ramos Company. In a common size income statement for 2011, the cost of goods sold are expressed as:
A) 130%
B) 115%
C) 64.5%
D) 63.1%
- Refer to the information for Ramos Company. In a common size income statement for 2011, the cost of goods sold are expressed as:
A) 130%
B) 115%
C) 64.5%
D) 63.1%
Unlock Deck
Unlock for access to all 95 flashcards in this deck.
Unlock Deck
k this deck
22
Ramos Company included the following information in its annual report:
- Refer to the information for Ramos Company. In a percentage change income statement over the period of 2009 to 2011, what is the change in sales?
A) 100%
B) 87.2%
C) 12.8%
D) 14.7%
- Refer to the information for Ramos Company. In a percentage change income statement over the period of 2009 to 2011, what is the change in sales?
A) 100%
B) 87.2%
C) 12.8%
D) 14.7%
Unlock Deck
Unlock for access to all 95 flashcards in this deck.
Unlock Deck
k this deck
23
The profit margin for ROA indicates the ability of a firm to generate earnings for a particular level of
A) sales
B) assets
C) working capital
D) shareholders' equity
A) sales
B) assets
C) working capital
D) shareholders' equity
Unlock Deck
Unlock for access to all 95 flashcards in this deck.
Unlock Deck
k this deck
24
Extreme Sports Company and All Sports Corporation. Below is financial information for two sporting goods retailers. Extreme Sports Company operates a retail business and franchising business. At the end 2011, Extreme Sports had 263 Company-owned and 120 franchise-operated retail stores. Extreme's stores are located in suburban, strip mall and regional mall locations, the company operates in 32 states. All Sports Corporation sells sporting goods and related products at over 2,500 Company-operated retail stores.
Selected Data for All Sports and Extreme Sports
(amounts in millions)
-
Refer to the information for Extreme Sports Company and All Sports Corporation.
What is the return on assets for All Sports?
A) 11.9%
B) 10.8%
C) 9.2%
D) 8.6%
Selected Data for All Sports and Extreme Sports
(amounts in millions)
-
Refer to the information for Extreme Sports Company and All Sports Corporation.
What is the return on assets for All Sports?
A) 11.9%
B) 10.8%
C) 9.2%
D) 8.6%
Unlock Deck
Unlock for access to all 95 flashcards in this deck.
Unlock Deck
k this deck
25
The statutory tax rate differs from a firm's average tax rate due to which of the following reasons
A) the statutory tax rate is a marginal tax rate.
B) some expenses are included in book income but do not enter into taxable income.
C) the average tax rate is for a period of three years.
D) the statutory tax rate does not effect GAAP measures of revenues and expenses.
A) the statutory tax rate is a marginal tax rate.
B) some expenses are included in book income but do not enter into taxable income.
C) the average tax rate is for a period of three years.
D) the statutory tax rate does not effect GAAP measures of revenues and expenses.
Unlock Deck
Unlock for access to all 95 flashcards in this deck.
Unlock Deck
k this deck
26
Sustainable earnings represent
A) the level of earnings expected to persist in the future.
B) the level of earnings and the growth in the levels of earnings expected to persist in the future.
C) the growth rate of future earnings.
D) retained earnings.
A) the level of earnings expected to persist in the future.
B) the level of earnings and the growth in the levels of earnings expected to persist in the future.
C) the growth rate of future earnings.
D) retained earnings.
Unlock Deck
Unlock for access to all 95 flashcards in this deck.
Unlock Deck
k this deck
27
Ramos Company included the following information in its annual report:
-
Refer to the information for Ramos Company. In a common size income statement for 2011, the operating expenses are expressed as:
A) 30.3%
B) 28.0%
C) 43.8%
D) 100%
-
Refer to the information for Ramos Company. In a common size income statement for 2011, the operating expenses are expressed as:
A) 30.3%
B) 28.0%
C) 43.8%
D) 100%
Unlock Deck
Unlock for access to all 95 flashcards in this deck.
Unlock Deck
k this deck
28
Multiples of EPSto value firms are referred to as.
A) ROA
B) price-earnings ratios
C) ROCE
D) Weighted average number of common shares outstanding
A) ROA
B) price-earnings ratios
C) ROCE
D) Weighted average number of common shares outstanding
Unlock Deck
Unlock for access to all 95 flashcards in this deck.
Unlock Deck
k this deck
29
Extreme Sports Company and All Sports Corporation. Below is financial information for two sporting goods retailers. Extreme Sports Company operates a retail business and franchising business. At the end 2011, Extreme Sports had 263 Company-owned and 120 franchise-operated retail stores. Extreme's stores are located in suburban, strip mall and regional mall locations, the company operates in 32 states. All Sports Corporation sells sporting goods and related products at over 2,500 Company-operated retail stores.
Selected Data for All Sports and Extreme Sports
(amounts in millions)
Refer to the information for Extreme Sports Company and All Sports Corporation.
Compute the return on assets for Extreme Sports
A) 3.2%
B) 5.0%
C) 8.9%
D) 1.1%
Selected Data for All Sports and Extreme Sports
(amounts in millions)
Refer to the information for Extreme Sports Company and All Sports Corporation.
Compute the return on assets for Extreme Sports
A) 3.2%
B) 5.0%
C) 8.9%
D) 1.1%
Unlock Deck
Unlock for access to all 95 flashcards in this deck.
Unlock Deck
k this deck
30
Which of the following is not a way a company can achieve a low-cost position
A) economies of scale
B) production efficiency
C) customer service
D) outsourcing
A) economies of scale
B) production efficiency
C) customer service
D) outsourcing
Unlock Deck
Unlock for access to all 95 flashcards in this deck.
Unlock Deck
k this deck
31
Which of the following would not be considered a committed fixed cost ( a cost that is incurred regardless of the level of activity during the period)?
A) depreciation expense
B) amortization expense
C) advertising expense
D) rent expense
A) depreciation expense
B) amortization expense
C) advertising expense
D) rent expense
Unlock Deck
Unlock for access to all 95 flashcards in this deck.
Unlock Deck
k this deck
32
Adjustments for dilutive securities and the adjustment to weighted average number of shares outstanding presumes that the dilutive securities are converted to common shares
A) as of the beginning of the year.
B) as of the end of the year.
C) as of the middle of the year.
D) as of the point in time where the maximum number of shares are outstanding.
A) as of the beginning of the year.
B) as of the end of the year.
C) as of the middle of the year.
D) as of the point in time where the maximum number of shares are outstanding.
Unlock Deck
Unlock for access to all 95 flashcards in this deck.
Unlock Deck
k this deck
33
Time-series analysis helps answer all of the following questions except:
A) Is the firm becoming more or less profitable over time?
B) Is the firm becoming more or less risky?
C) How is management of the firm responding to external economic forces?
D) What is the amount of assets or capital required to generate a particular level of earnings?
A) Is the firm becoming more or less profitable over time?
B) Is the firm becoming more or less risky?
C) How is management of the firm responding to external economic forces?
D) What is the amount of assets or capital required to generate a particular level of earnings?
Unlock Deck
Unlock for access to all 95 flashcards in this deck.
Unlock Deck
k this deck
34
Critics of EPS as a measure of profitability point out that it does not consider:
A) simple capital structures.
B) the amount of assets or capital required to generate a particular level of earnings.
C) the deduction of preferred stock dividends from net income.
D) Adjustments for dilutive securities and the adjustment to weighted average number of shares outstanding for complex capital structures.
Unlock Deck
Unlock for access to all 95 flashcards in this deck.
Unlock Deck
k this deck
35
Hall and Porter argue that firms have two generic alternative strategies for any particular product. These strategies are
A) low risk focus, low risk focus
B) retail customer focus, wholesale customer focus
C) product differentiation, low-cost leadership
D) low operating leverage, high operating leverage
A) low risk focus, low risk focus
B) retail customer focus, wholesale customer focus
C) product differentiation, low-cost leadership
D) low operating leverage, high operating leverage
Unlock Deck
Unlock for access to all 95 flashcards in this deck.
Unlock Deck
k this deck
36
To calculate diluted EPS, the accountant does all of the following except:
A) adds back to net income any compensation expense recognized on the employee stock options
B) adds back any interest expense (net of taxes) on convertible bonds
C) adds back any dividends on convertible preferred stock the firm subtracted in computing net income to common shareholders.
D) enters only the net incremental shares issued (shares issued under options minus assumed shares repurchased) in the computation of diluted EPS.
Unlock Deck
Unlock for access to all 95 flashcards in this deck.
Unlock Deck
k this deck
37
Ramos Company included the following information in its annual report:
- Refer to the information for Ramos Company. In a common size income statement for 2009, the cost of goods sold are expressed as:
A) 64.3%
B) 40.0%
C) 87 %
D) 103%
- Refer to the information for Ramos Company. In a common size income statement for 2009, the cost of goods sold are expressed as:
A) 64.3%
B) 40.0%
C) 87 %
D) 103%
Unlock Deck
Unlock for access to all 95 flashcards in this deck.
Unlock Deck
k this deck
38
Which of the following scenarios is consistent with a increasing cost of goods sold to sales percentage and increasing inventory turnover
A) Firm raises prices to increase its gross margin but inventory sells more slowly.
B) Weak economic conditions lead to reduced demand for a firm's products, necessitating price reductions to move goods.
C) Strong economic conditions lead to increased demand for a firm's products, allowing price increases.
D) Firm shifts its product mix toward lower margin, faster moving products.
Unlock Deck
Unlock for access to all 95 flashcards in this deck.
Unlock Deck
k this deck
39
Which of the following is the primary objective in most financial statement analysis?
A) to value a firm's equity securities.
B) to look for unrecorded liabilities.
C) to establish a firm's strategy within the industry.
D) to define markets for the firm.
A) to value a firm's equity securities.
B) to look for unrecorded liabilities.
C) to establish a firm's strategy within the industry.
D) to define markets for the firm.
Unlock Deck
Unlock for access to all 95 flashcards in this deck.
Unlock Deck
k this deck
40
Extreme Sports Company and All Sports Corporation. Below is financial information for two sporting goods retailers. Extreme Sports Company operates a retail business and franchising business. At the end 2011, Extreme Sports had 263 Company-owned and 120 franchise-operated retail stores. Extreme's stores are located in suburban, strip mall and regional mall locations, the company operates in 32 states. All Sports Corporation sells sporting goods and related products at over 2,500 Company-operated retail stores.
Selected Data for All Sports and Extreme Sports
(amounts in millions)
-
Refer to the information for Extreme Sports Company and All Sports Corporation.
Calculate All Sports' inventory turnover ratio
A) 5.3
B) 1.2
C) 3.9
D) .256
Selected Data for All Sports and Extreme Sports
(amounts in millions)
-
Refer to the information for Extreme Sports Company and All Sports Corporation.
Calculate All Sports' inventory turnover ratio
A) 5.3
B) 1.2
C) 3.9
D) .256
Unlock Deck
Unlock for access to all 95 flashcards in this deck.
Unlock Deck
k this deck
41
Ramos Company included the following information in its annual report:
- Refer to the information for Ramos Company. In a percentage change income statement over the period of 2009 to 2011, what is the change in net income?
A) 100%
B) 21.6%
C) 72.4%
D) 27.6%
- Refer to the information for Ramos Company. In a percentage change income statement over the period of 2009 to 2011, what is the change in net income?
A) 100%
B) 21.6%
C) 72.4%
D) 27.6%
Unlock Deck
Unlock for access to all 95 flashcards in this deck.
Unlock Deck
k this deck
42
Firms with ____________________ levels of operating leverage experience greater variability in their return on assets.
Unlock Deck
Unlock for access to all 95 flashcards in this deck.
Unlock Deck
k this deck
43
Firms with high operating leverage have a higher proportion of _________________________ in their cost structure.
Unlock Deck
Unlock for access to all 95 flashcards in this deck.
Unlock Deck
k this deck
44
Which of the following are better indicated by percentage change statements than common-size statements?
A) monetary changes
B) profitability
C) stability
D) growth and decline
A) monetary changes
B) profitability
C) stability
D) growth and decline
Unlock Deck
Unlock for access to all 95 flashcards in this deck.
Unlock Deck
k this deck
45
The computation of the additional shares to be issued on the exercise of stock options assumes that the firm would repurchase common shares on the open market using an
Amount equal to the sum of all the following except:
A) any cash proceeds from such exercise
B) net incremental shares issued
C) any unamortized compensation expense on those options
D) any tax benefits that would be credited to additional paid-in capital
Amount equal to the sum of all the following except:
A) any cash proceeds from such exercise
B) net incremental shares issued
C) any unamortized compensation expense on those options
D) any tax benefits that would be credited to additional paid-in capital
Unlock Deck
Unlock for access to all 95 flashcards in this deck.
Unlock Deck
k this deck
46
Carl Industries has condensed balance sheets as shown:
-
Refer to the information for Carl Industries. In a common size balance sheet for 2010, plant and equipment (net) is expressed as
A) 74.5%
B) 93.2%
C) 83%
D) 30.5%
-
Refer to the information for Carl Industries. In a common size balance sheet for 2010, plant and equipment (net) is expressed as
A) 74.5%
B) 93.2%
C) 83%
D) 30.5%
Unlock Deck
Unlock for access to all 95 flashcards in this deck.
Unlock Deck
k this deck
47
Return on assets can be disaggregated into profit margin for return on assets and ______________________________.
Unlock Deck
Unlock for access to all 95 flashcards in this deck.
Unlock Deck
k this deck
48
The three elements of risk that help in understanding differences across firms and changes over time in ROAs are:
A) product life cycles, cyclicality of sales, competitive constraint.
B) operating leverage, cyclicality of sales, product life cycles.
C) cyclicality of sales, competitive constraint, operating leverage.
D) operating leverage, competitive constraint, product life cycles.
A) product life cycles, cyclicality of sales, competitive constraint.
B) operating leverage, cyclicality of sales, product life cycles.
C) cyclicality of sales, competitive constraint, operating leverage.
D) operating leverage, competitive constraint, product life cycles.
Unlock Deck
Unlock for access to all 95 flashcards in this deck.
Unlock Deck
k this deck
49
Return on assets will likely differ across firms and across time. Three elements of risk that will help explain these differences are operating leverage, ___________________________________, and stage and length of product life cycle.
Unlock Deck
Unlock for access to all 95 flashcards in this deck.
Unlock Deck
k this deck
50
Carl Industries has condensed balance sheets as shown:
-
Refer to the information for Carl Industries. In a common size balance sheet for 2009, total liabilities and equity are expressed as
A) 25.9%
B) 100%
C) 74.1%
D) 103.6%
-
Refer to the information for Carl Industries. In a common size balance sheet for 2009, total liabilities and equity are expressed as
A) 25.9%
B) 100%
C) 74.1%
D) 103.6%
Unlock Deck
Unlock for access to all 95 flashcards in this deck.
Unlock Deck
k this deck
51
Carl Industries has condensed balance sheets as shown:
-
Refer to the information for Carl Industries. In a percentage change balance sheet over the period of 2009 to 2011, what is the change in current assets?
A) 78.6%
B) (27.3%)
C) (21.4%)
D) 100%
-
Refer to the information for Carl Industries. In a percentage change balance sheet over the period of 2009 to 2011, what is the change in current assets?
A) 78.6%
B) (27.3%)
C) (21.4%)
D) 100%
Unlock Deck
Unlock for access to all 95 flashcards in this deck.
Unlock Deck
k this deck
52
The ____________________ effect of interest expense on net income equals one minus the marginal tax rate times the interest expense.
Unlock Deck
Unlock for access to all 95 flashcards in this deck.
Unlock Deck
k this deck
53
Carl Industries has condensed balance sheets as shown:
-
Refer to the information for Carl Industries. In a percentage change balance sheet over the period of 2009 to 2011, what is the change in long-term liabilities?
A) 94.7%
B) 15.4%
C) 5.3%
D) 100%
-
Refer to the information for Carl Industries. In a percentage change balance sheet over the period of 2009 to 2011, what is the change in long-term liabilities?
A) 94.7%
B) 15.4%
C) 5.3%
D) 100%
Unlock Deck
Unlock for access to all 95 flashcards in this deck.
Unlock Deck
k this deck
54
The numerator of the return on assets ratio is net income from operations excluding the effects of any ______________________________.
Unlock Deck
Unlock for access to all 95 flashcards in this deck.
Unlock Deck
k this deck
55
In order to measure how profitable a firm is in generating a return for its common shareholders, a financial analyst would examine the return on _____________________________________________.
Unlock Deck
Unlock for access to all 95 flashcards in this deck.
Unlock Deck
k this deck
56
Common-size analysis requires the analyst to be aware that percentages can change because of all of the following except:
A) changes in expenses in the numerator independent of changes in sales
B) changes in sales independent of changes in expenses
C) interaction effects between the numerator and denominator
D) All of these are possible explanations.
A) changes in expenses in the numerator independent of changes in sales
B) changes in sales independent of changes in expenses
C) interaction effects between the numerator and denominator
D) All of these are possible explanations.
Unlock Deck
Unlock for access to all 95 flashcards in this deck.
Unlock Deck
k this deck
57
Return on assets will likely differ across firms and across time. Three elements of risk that will help explain these differences are ________________________________________, cyclicality of sales and stage and length of product life cycle.
Unlock Deck
Unlock for access to all 95 flashcards in this deck.
Unlock Deck
k this deck
58
Return on assets can be disaggregated into asset turnover and ____________________________________________________________.
Unlock Deck
Unlock for access to all 95 flashcards in this deck.
Unlock Deck
k this deck
59
Firms with simple capital structures can have which of the following?
A) outstanding convertible bonds.
B) stock options issued
C) stock warrants issued
D) declared preferred stock dividends
A) outstanding convertible bonds.
B) stock options issued
C) stock warrants issued
D) declared preferred stock dividends
Unlock Deck
Unlock for access to all 95 flashcards in this deck.
Unlock Deck
k this deck
60
Another term for earnings power is
A) nonrecurrent revenue.
B) nonrecurrent gains.
C) sustainable earnings.
D) net change in equity.
A) nonrecurrent revenue.
B) nonrecurrent gains.
C) sustainable earnings.
D) net change in equity.
Unlock Deck
Unlock for access to all 95 flashcards in this deck.
Unlock Deck
k this deck
61
The rationale for adding back the _______________________________________________________ relates to attaining consistency in the numerator and denominator of ROA.
Unlock Deck
Unlock for access to all 95 flashcards in this deck.
Unlock Deck
k this deck
62
________________________________________ is the level of earnings and the growth in the levels of earnings expected to persist in the future.
Unlock Deck
Unlock for access to all 95 flashcards in this deck.
Unlock Deck
k this deck
63
Return on assets can be a misleading ratio when analyzing technology firms because two important assets, ______________________________ and ______________________________ do not appear on their balance sheets
or
or
Unlock Deck
Unlock for access to all 95 flashcards in this deck.
Unlock Deck
k this deck
64
Economic theory suggests that higher levels of ____________________ in any activity should lead to higher levels of ___________________________________.
Unlock Deck
Unlock for access to all 95 flashcards in this deck.
Unlock Deck
k this deck
65
When an analyst uses measures of past profitability to forecast the firm's future profitability the expectation is that those revenues, gains, expenses and losses that will ____________________.
Unlock Deck
Unlock for access to all 95 flashcards in this deck.
Unlock Deck
k this deck
66
One problem with using EPS as a measure of profitability is that it does not consider the amount of ____________________ or ____________________ required to generate a particular level of earnings.
or
or
Unlock Deck
Unlock for access to all 95 flashcards in this deck.
Unlock Deck
k this deck
67
Firms that have either convertible securities or stock options or warrants outstanding have __________________________________________________.
Unlock Deck
Unlock for access to all 95 flashcards in this deck.
Unlock Deck
k this deck
68
All else being equal, firms with high levels of ________________________________________ incur more risk in their operations and should earn higher rates of return.
Unlock Deck
Unlock for access to all 95 flashcards in this deck.
Unlock Deck
k this deck
69
The ability of a firm to generate income from operations given a particular level of sales is measured by the ______________________________.
Unlock Deck
Unlock for access to all 95 flashcards in this deck.
Unlock Deck
k this deck
70
Inventory turnover is calculated by dividing ________________________________________ by average inventories.
Unlock Deck
Unlock for access to all 95 flashcards in this deck.
Unlock Deck
k this deck
71
To reduce the risk inherent in ______________________________ a company should strive for a high proportion of variable costs in its cost structure.
Unlock Deck
Unlock for access to all 95 flashcards in this deck.
Unlock Deck
k this deck
72
When calculating return on common stockholders' equity the financial analyst subtracts ________________________________________ from net income.
Unlock Deck
Unlock for access to all 95 flashcards in this deck.
Unlock Deck
k this deck
73
Sensitron and Douglas Tools manufacture and market power tools and accessories. Sensitron targets customers in the professional contractor market, while Douglas Tools focuses on home users and professionals. Selected financial data for the companies appears below.
Required:
Required: Unlock Deck
Unlock for access to all 95 flashcards in this deck.
Unlock Deck
k this deck
74
Firms and industries characterized by heavy fixed capacity costs and lengthy periods required to add new capacity operate under a ___________________________________.
Unlock Deck
Unlock for access to all 95 flashcards in this deck.
Unlock Deck
k this deck
75
Accounts receivable turnover is calculated by dividing ________________________________________ by average net accounts receivable.
Unlock Deck
Unlock for access to all 95 flashcards in this deck.
Unlock Deck
k this deck
76
The ___________________________________ of interest expense on net income equals one minus the marginal tax rate times interest expense.
Unlock Deck
Unlock for access to all 95 flashcards in this deck.
Unlock Deck
k this deck
77
The ability of a firm to manage the level of investment in assets for a particular level of sales is measured by the ______________________________.
Unlock Deck
Unlock for access to all 95 flashcards in this deck.
Unlock Deck
k this deck
78
EPS is an ambiguous measure of profitability because it reflects operating performance in the numerator and ________________________________________ in the denominator.
Unlock Deck
Unlock for access to all 95 flashcards in this deck.
Unlock Deck
k this deck
79
Return on common shareholders' equity can be disaggregated into profit margin, asset turnover and __________________________________________________.
Unlock Deck
Unlock for access to all 95 flashcards in this deck.
Unlock Deck
k this deck
80
Operating income is negative in an amount equal to _________________________ when revenues are zero.
Unlock Deck
Unlock for access to all 95 flashcards in this deck.
Unlock Deck
k this deck
Unlock Deck
Unlock for access to all 95 flashcards in this deck.


