Deck 16: Externalities
Full screen (f)
Question
Question
Question
Use the figure below to answer the following questions.
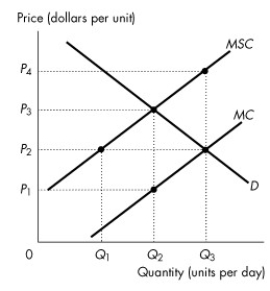 Figure 16.2.1
Refer to Figure 16.2.1.The figure shows the private marginal cost curve,the social marginal cost curve and the market demand curve.If the market is unregulated,then
A)the quantity produced is efficient but price is too low.
B)the quantity produced is less than the efficient quantity.
C)the quantity produced is greater than the efficient quantity.
D)the quantity produced is efficient but the price is too high.
E)the externality is eliminated.
Figure 16.2.1Refer to Figure 16.2.1.The figure shows the private marginal cost curve,the social marginal cost curve and the market demand curve.If the market is unregulated,then
A)the quantity produced is efficient but price is too low.
B)the quantity produced is less than the efficient quantity.
C)the quantity produced is greater than the efficient quantity.
D)the quantity produced is efficient but the price is too high.
E)the externality is eliminated.
Question
Use the figure below to answer the following questions.
Figure 16.2.1
Refer to Figure 16.2.1.The figure shows the private marginal cost curve,the social marginal cost curve and the market demand curve.If the market is unregulated,then the quantity produced is
A)zero.
B)Q1.
C)Q2.
D)Q3.
E)too low.
Figure 16.2.1Refer to Figure 16.2.1.The figure shows the private marginal cost curve,the social marginal cost curve and the market demand curve.If the market is unregulated,then the quantity produced is
A)zero.
B)Q1.
C)Q2.
D)Q3.
E)too low.
Question
Question
Question
Question
Question
Use the figure below to answer the following questions.
Figure 16.2.1
Refer to Figure 16.2.1.The figure shows the private marginal cost curve,the social marginal cost curve and the market demand curve.If a constant per unit tax is imposed that generates an efficient allocation of resources,then consumers pay a per unit price of
A)zero.
B)P1.
C)P2.
D)P3.
E)P4.
Figure 16.2.1Refer to Figure 16.2.1.The figure shows the private marginal cost curve,the social marginal cost curve and the market demand curve.If a constant per unit tax is imposed that generates an efficient allocation of resources,then consumers pay a per unit price of
A)zero.
B)P1.
C)P2.
D)P3.
E)P4.
Question
Question
Use the figure below to answer the following questions.
Figure 16.2.1
Refer to Figure 16.2.1.The figure shows the private marginal cost curve,the social marginal cost curve and the market demand curve.If a constant per unit tax is imposed that generates an efficient allocation of resources,then producers receive a per unit price of
A)zero.
B)P4.
C)P3.
D)P2.
E)P1.
Figure 16.2.1Refer to Figure 16.2.1.The figure shows the private marginal cost curve,the social marginal cost curve and the market demand curve.If a constant per unit tax is imposed that generates an efficient allocation of resources,then producers receive a per unit price of
A)zero.
B)P4.
C)P3.
D)P2.
E)P1.
Question
Question
Use the figure below to answer the following questions.
Figure 16.2.1
Refer to Figure 16.2.1.The figure shows the private marginal cost curve,the social marginal cost curve and the market demand curve.If the market is unregulated,then the price is
A)P1.
B)P4.
C)below P1.
D)P2.
E)P3.
Figure 16.2.1Refer to Figure 16.2.1.The figure shows the private marginal cost curve,the social marginal cost curve and the market demand curve.If the market is unregulated,then the price is
A)P1.
B)P4.
C)below P1.
D)P2.
E)P3.
Question
Question
Question
Use the figure below to answer the following questions.
Figure 16.2.1
Refer to Figure 16.2.1.The figure shows the private marginal cost curve,the social marginal cost curve and the market demand curve.If a constant per unit tax is imposed that generates an efficient allocation of resources,then the quantity produced is
A)zero.
B)Q1.
C)Q2.
D)Q3.
E)greater than Q3.
Figure 16.2.1Refer to Figure 16.2.1.The figure shows the private marginal cost curve,the social marginal cost curve and the market demand curve.If a constant per unit tax is imposed that generates an efficient allocation of resources,then the quantity produced is
A)zero.
B)Q1.
C)Q2.
D)Q3.
E)greater than Q3.
Question
Question
Question
Use the figure below to answer the following questions.
Figure 16.2.1
Refer to Figure16.2.1.The figure shows the private marginal cost curve,the social marginal cost curve and the market demand curve.To promote an efficient allocation of resources,the government could impose a constant per unit tax equal to
A)zero.
B)P1.
C)P3 - P1.
D)P4 - P1.
E)P3 - P2.
Figure 16.2.1Refer to Figure16.2.1.The figure shows the private marginal cost curve,the social marginal cost curve and the market demand curve.To promote an efficient allocation of resources,the government could impose a constant per unit tax equal to
A)zero.
B)P1.
C)P3 - P1.
D)P4 - P1.
E)P3 - P2.
Question
Use the figure below to answer the following questions.
Figure 16.2.1
Refer to Figure 16.2.1.The figure shows the private marginal cost curve,the social marginal cost curve and the market demand curve.If the market is unregulated,then at the equilibrium output the marginal social cost of production is
A)less than the marginal benefit to consumers.
B)greater than the marginal benefit to consumers.
C)equal to the marginal benefit to consumers.
D)equal to the marginal private cost of production.
E)less than the marginal private cost of production.
Figure 16.2.1Refer to Figure 16.2.1.The figure shows the private marginal cost curve,the social marginal cost curve and the market demand curve.If the market is unregulated,then at the equilibrium output the marginal social cost of production is
A)less than the marginal benefit to consumers.
B)greater than the marginal benefit to consumers.
C)equal to the marginal benefit to consumers.
D)equal to the marginal private cost of production.
E)less than the marginal private cost of production.
Question
Use the figure below to answer the following questions.
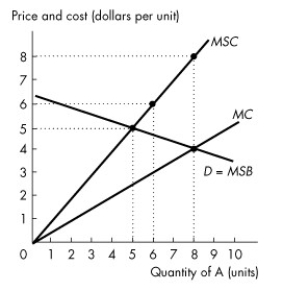 Figure 16.2.2
Refer to Figure 16.2.2.This figure shows the demand curve,the marginal private cost curve and the marginal social cost curve of good A.What is the efficient quantity of good A?
A)0 units
B)5 units
C)6 units
D)8 units
E)impossible to determine without additional information
Figure 16.2.2Refer to Figure 16.2.2.This figure shows the demand curve,the marginal private cost curve and the marginal social cost curve of good A.What is the efficient quantity of good A?
A)0 units
B)5 units
C)6 units
D)8 units
E)impossible to determine without additional information
Question
Question
Use the figure below to answer the following questions.
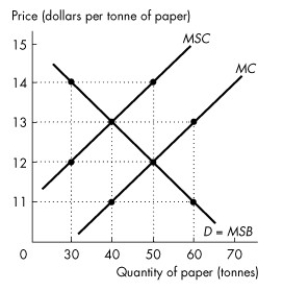 Figure 16.2.3
Refer to Figure 16.2.3.The unregulated outcome in the paper market is
A)a quantity of 40 tonnes and a price of $11 a tonne.
B)a quantity of 40 tonnes and a price of $13 a tonne.
C)a quantity of 50 tonnes and a price of $12 a tonne.
D)a quantity of 50 tonnes and a price of $14 a tonne.
E)a quantity of 60 tonnes and a price of $13 a tonne.
Figure 16.2.3Refer to Figure 16.2.3.The unregulated outcome in the paper market is
A)a quantity of 40 tonnes and a price of $11 a tonne.
B)a quantity of 40 tonnes and a price of $13 a tonne.
C)a quantity of 50 tonnes and a price of $12 a tonne.
D)a quantity of 50 tonnes and a price of $14 a tonne.
E)a quantity of 60 tonnes and a price of $13 a tonne.
Question
Question
Question
Question
Use the figure below to answer the following questions.
Figure 16.2.2
Refer to Figure 16.2.2.This figure shows the demand curve,the marginal private cost curve and the marginal social cost curve of good A.How many units of good A are produced in an unregulated market?
A)0 units
B)5 units
C)6 units
D)8 units
E)9 units
Figure 16.2.2Refer to Figure 16.2.2.This figure shows the demand curve,the marginal private cost curve and the marginal social cost curve of good A.How many units of good A are produced in an unregulated market?
A)0 units
B)5 units
C)6 units
D)8 units
E)9 units
Question
Question
Question
Use the figure below to answer the following questions.
Figure 16.2.2
Refer to Figure 16.2.2.This figure shows the demand curve,the marginal private cost curve and the marginal social cost curve of good A.Production of the 6th unit of output generates a marginal external
A)cost of $1.50.
B)cost of $3.
C)cost of $6.
D)benefit of $3.
E)benefit of $6.
Figure 16.2.2Refer to Figure 16.2.2.This figure shows the demand curve,the marginal private cost curve and the marginal social cost curve of good A.Production of the 6th unit of output generates a marginal external
A)cost of $1.50.
B)cost of $3.
C)cost of $6.
D)benefit of $3.
E)benefit of $6.
Question
Question
Question
Question
Question
Question
Question
Use the figure below to answer the following questions.
Figure 16.2.2
Refer to Figure 16.2.2.This figure shows the demand curve,the marginal private cost curve and the marginal social cost curve of good A.If the government wanted to achieve the efficient quantity of good A,it could issue marketable permits.If the marketable permits result in the efficient quantity of good A,then the quantity of good A produced is
A)0 units.
B)5 units.
C)6 units.
D)8 units.
E)a level impossible to determine without more information.
Figure 16.2.2Refer to Figure 16.2.2.This figure shows the demand curve,the marginal private cost curve and the marginal social cost curve of good A.If the government wanted to achieve the efficient quantity of good A,it could issue marketable permits.If the marketable permits result in the efficient quantity of good A,then the quantity of good A produced is
A)0 units.
B)5 units.
C)6 units.
D)8 units.
E)a level impossible to determine without more information.
Question
Question
Question
Question
Use the figure below to answer the following questions.
Figure 16.2.3
Refer to Figure 16.2.3.A tax of ________ per tonne is necessary to achieve the efficient output of ________ tonnes of paper.
A)$14;50
B)$14;30
C)$13;40
D)$2;50
E)$2;40
Figure 16.2.3Refer to Figure 16.2.3.A tax of ________ per tonne is necessary to achieve the efficient output of ________ tonnes of paper.
A)$14;50
B)$14;30
C)$13;40
D)$2;50
E)$2;40
Question
Question
Question
Use the figure below to answer the following questions.
Figure 16.2.3
Refer to Figure 16.2.3.In this market there is a marginal external
A)cost of $14 a tonne.
B)cost of $12 a tonne.
C)cost of $2 a tonne.
D)benefit of $2 a tonne.
E)benefit of $12 a tonne.
Figure 16.2.3Refer to Figure 16.2.3.In this market there is a marginal external
A)cost of $14 a tonne.
B)cost of $12 a tonne.
C)cost of $2 a tonne.
D)benefit of $2 a tonne.
E)benefit of $12 a tonne.
Question
Question
Question
Question
Question
Question
Question
Question
Question
Question
Question
Question
Question
Question
Question
Question
Question
Question
Use the figure below to answer the following questions.
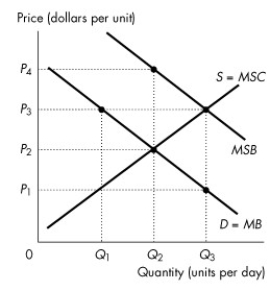 Figure 16.3.1
Refer to Figure 16.3.1.The figure shows the marginal private benefit curve,the marginal social benefit curve,and the market supply curve.If a voucher is given to consumers that generates an efficient outcome,then producers receive a price of
A)zero.
B)P1 per unit.
C)P2 per unit.
D)P3 per unit.
E)P4 per unit.
Figure 16.3.1Refer to Figure 16.3.1.The figure shows the marginal private benefit curve,the marginal social benefit curve,and the market supply curve.If a voucher is given to consumers that generates an efficient outcome,then producers receive a price of
A)zero.
B)P1 per unit.
C)P2 per unit.
D)P3 per unit.
E)P4 per unit.
Question
Question
Question
Question
Question
Use the figure below to answer the following questions.
Figure 16.3.1
Refer to Figure 16.3.1.The figure shows the marginal private benefit curve,the marginal social benefit curve,and the market supply curve.If production is left to the private market,then
A)the quantity produced is less than the efficient quantity.
B)the quantity produced is greater than the efficient quantity.
C)price is greater than marginal social benefit quantity.
D)the marginal cost curve is horizontal.
E)none of the above.
Figure 16.3.1Refer to Figure 16.3.1.The figure shows the marginal private benefit curve,the marginal social benefit curve,and the market supply curve.If production is left to the private market,then
A)the quantity produced is less than the efficient quantity.
B)the quantity produced is greater than the efficient quantity.
C)price is greater than marginal social benefit quantity.
D)the marginal cost curve is horizontal.
E)none of the above.
Question
Question
Question
Question
Question
Use the figure below to answer the following questions.
Figure 16.3.1
Refer to Figure 16.3.1.The figure shows the marginal private benefit curve,the marginal social benefit curve,and the market supply curve.If a subsidy is granted that generates an efficient quantity,then quantity produced is
A)zero.
B)Q1.
C)Q2.
D)Q3.
E)greater than Q3.
Figure 16.3.1Refer to Figure 16.3.1.The figure shows the marginal private benefit curve,the marginal social benefit curve,and the market supply curve.If a subsidy is granted that generates an efficient quantity,then quantity produced is
A)zero.
B)Q1.
C)Q2.
D)Q3.
E)greater than Q3.
Question
Question
Use the figure below to answer the following questions.
Figure 16.3.1
Refer to Figure 16.3.1.The figure shows the marginal private benefit curve,the marginal social benefit curve,and the market supply curve.To promote an efficient quantity the government could grant a subsidy equal to
A)zero.
B)P1.
C)P3 - P1.
D)P4 - P1.
E)P2 - P1.
Figure 16.3.1Refer to Figure 16.3.1.The figure shows the marginal private benefit curve,the marginal social benefit curve,and the market supply curve.To promote an efficient quantity the government could grant a subsidy equal to
A)zero.
B)P1.
C)P3 - P1.
D)P4 - P1.
E)P2 - P1.
Question
Question
Use the figure below to answer the following questions.
Figure 16.3.1
Refer to Figure 16.3.1.The figure shows the marginal private benefit curve,the marginal social benefit curve,and the market supply curve.If production is left to the private market,then the price is
A)P1.
B)P3.
C)P2.
D)greater than P4.
E)P4.
Figure 16.3.1Refer to Figure 16.3.1.The figure shows the marginal private benefit curve,the marginal social benefit curve,and the market supply curve.If production is left to the private market,then the price is
A)P1.
B)P3.
C)P2.
D)greater than P4.
E)P4.
Question
Use the figure below to answer the following questions.
Figure 16.3.1
Refer to Figure 16.3.1.The figure shows the marginal private benefit curve,the marginal social benefit curve,and the market supply curve.If production is left to the private market,then the quantity produced is
A)zero.
B)Q1.
C)Q2.
D)Q3.
E)between 0 and Q1.
Figure 16.3.1Refer to Figure 16.3.1.The figure shows the marginal private benefit curve,the marginal social benefit curve,and the market supply curve.If production is left to the private market,then the quantity produced is
A)zero.
B)Q1.
C)Q2.
D)Q3.
E)between 0 and Q1.
Question
Use the figure below to answer the following questions.
Figure 16.3.1
Refer to Figure 16.3.1.The figure shows the marginal private benefit curve,the marginal social benefit curve,and the market supply curve.If a voucher is given to consumers that generates an efficient outcome,then consumers pay
A)zero.
B)P1 per unit.
C)P2 per unit.
D)P3 per unit.
E)P4 per unit.
Figure 16.3.1Refer to Figure 16.3.1.The figure shows the marginal private benefit curve,the marginal social benefit curve,and the market supply curve.If a voucher is given to consumers that generates an efficient outcome,then consumers pay
A)zero.
B)P1 per unit.
C)P2 per unit.
D)P3 per unit.
E)P4 per unit.
Question
Question
Use the figure below to answer the following questions.
Figure 16.3.1
Refer to Figure 16.3.1.The figure shows the marginal private benefit curve,the marginal social benefit curve,and the market supply curve.If production is left to the private market,then at the equilibrium quantity the marginal social benefit from consumption is
A)less than the marginal cost to producers.
B)less than the marginal social cost of production.
C)equal to the marginal cost to producers.
D)equal to the marginal private benefit from consumption.
E)greater than the marginal cost to producers.
Figure 16.3.1Refer to Figure 16.3.1.The figure shows the marginal private benefit curve,the marginal social benefit curve,and the market supply curve.If production is left to the private market,then at the equilibrium quantity the marginal social benefit from consumption is
A)less than the marginal cost to producers.
B)less than the marginal social cost of production.
C)equal to the marginal cost to producers.
D)equal to the marginal private benefit from consumption.
E)greater than the marginal cost to producers.

Unlock Deck
Sign up to unlock the cards in this deck!
Unlock Deck
Unlock Deck
1/111
Play
Full screen (f)
Deck 16: Externalities
1
An example of an activity that creates a positive consumption externality is
A)logging,which pollutes rivers.
B)locating beehives next to an orange orchard.
C)smoking,which harms the health of a bystander.
D)a flu vaccination.
E)a noisy party.
A)logging,which pollutes rivers.
B)locating beehives next to an orange orchard.
C)smoking,which harms the health of a bystander.
D)a flu vaccination.
E)a noisy party.
D
2
An example of an activity that creates a negative consumption externality is
A)logging,which pollutes rivers.
B)locating beehives next to an orange orchard.
C)smoking,which harms the health of a bystander.
D)a flu vaccination.
E)none of the above.
A)logging,which pollutes rivers.
B)locating beehives next to an orange orchard.
C)smoking,which harms the health of a bystander.
D)a flu vaccination.
E)none of the above.
C
3
Use the figure below to answer the following questions.
Figure 16.2.1
Refer to Figure 16.2.1.The figure shows the private marginal cost curve,the social marginal cost curve and the market demand curve.If the market is unregulated,then
A)the quantity produced is efficient but price is too low.
B)the quantity produced is less than the efficient quantity.
C)the quantity produced is greater than the efficient quantity.
D)the quantity produced is efficient but the price is too high.
E)the externality is eliminated.
Figure 16.2.1Refer to Figure 16.2.1.The figure shows the private marginal cost curve,the social marginal cost curve and the market demand curve.If the market is unregulated,then
A)the quantity produced is efficient but price is too low.
B)the quantity produced is less than the efficient quantity.
C)the quantity produced is greater than the efficient quantity.
D)the quantity produced is efficient but the price is too high.
E)the externality is eliminated.
C
4
Use the figure below to answer the following questions.
Figure 16.2.1
Refer to Figure 16.2.1.The figure shows the private marginal cost curve,the social marginal cost curve and the market demand curve.If the market is unregulated,then the quantity produced is
A)zero.
B)Q1.
C)Q2.
D)Q3.
E)too low.
Figure 16.2.1Refer to Figure 16.2.1.The figure shows the private marginal cost curve,the social marginal cost curve and the market demand curve.If the market is unregulated,then the quantity produced is
A)zero.
B)Q1.
C)Q2.
D)Q3.
E)too low.
Unlock Deck
Unlock for access to all 111 flashcards in this deck.
Unlock Deck
k this deck
5
An externality is defined as
A)an additional cost imposed by the government on producers.
B)an additional gain received by consumers from decisions made by the government.
C)a cost or benefit that arises from production and falls on someone other than the producer,or a cost or benefit that arises from consumption and falls on someone other than the consumer.
D)a marginal social cost.
E)the additional amount consumers have to pay to consume an additional amount of a good or service.
Unlock Deck
Unlock for access to all 111 flashcards in this deck.
Unlock Deck
k this deck
6
A well-maintained water-front property that is enjoyed by other property owners is an example of
A)an inefficient allocation of resources.
B)a negative consumption externality.
C)a positive consumption externality.
D)a negative production externality.
E)a positive production externality.
A)an inefficient allocation of resources.
B)a negative consumption externality.
C)a positive consumption externality.
D)a negative production externality.
E)a positive production externality.
Unlock Deck
Unlock for access to all 111 flashcards in this deck.
Unlock Deck
k this deck
7
Use the table below to answer the following questions.
Table 16.2.1
-Refer to Table 16.2.1.Given in the table are the marginal private cost and the marginal social cost of the production of chemical fertilizer and the marginal social benefit from the consumption of fertilizer.Under these circumstances,
A)there are positive externalities in this market.
B)there are negative externalities in this market,equal to $10 per unit.
C)there are no externalities in this market.
D)not enough information is provided to determine whether or not there are externalities.
E)there are negative externalities in this market,equal to $20 per unit.
Unlock Deck
Unlock for access to all 111 flashcards in this deck.
Unlock Deck
k this deck
8
Effective strategies for addressing the problem of negative externalities include
A)taxing the profit of polluting companies at twice the rate of non-polluting companies.
B)imposing taxes on the activity that generates the pollution.
C)stressing the use of renewable resources.
D)imposing recycling laws.
E)closing down a polluting industry.
A)taxing the profit of polluting companies at twice the rate of non-polluting companies.
B)imposing taxes on the activity that generates the pollution.
C)stressing the use of renewable resources.
D)imposing recycling laws.
E)closing down a polluting industry.
Unlock Deck
Unlock for access to all 111 flashcards in this deck.
Unlock Deck
k this deck
9
Use the figure below to answer the following questions.
Figure 16.2.1
Refer to Figure 16.2.1.The figure shows the private marginal cost curve,the social marginal cost curve and the market demand curve.If a constant per unit tax is imposed that generates an efficient allocation of resources,then consumers pay a per unit price of
A)zero.
B)P1.
C)P2.
D)P3.
E)P4.
Figure 16.2.1Refer to Figure 16.2.1.The figure shows the private marginal cost curve,the social marginal cost curve and the market demand curve.If a constant per unit tax is imposed that generates an efficient allocation of resources,then consumers pay a per unit price of
A)zero.
B)P1.
C)P2.
D)P3.
E)P4.
Unlock Deck
Unlock for access to all 111 flashcards in this deck.
Unlock Deck
k this deck
10
Air pollution generated by a paper mill factory is an example of a
A)positive production externality.
B)positive consumption externality.
C)negative consumption externality.
D)marginal external benefit.
E)negative production externality.
A)positive production externality.
B)positive consumption externality.
C)negative consumption externality.
D)marginal external benefit.
E)negative production externality.
Unlock Deck
Unlock for access to all 111 flashcards in this deck.
Unlock Deck
k this deck
11
Use the figure below to answer the following questions.
Figure 16.2.1
Refer to Figure 16.2.1.The figure shows the private marginal cost curve,the social marginal cost curve and the market demand curve.If a constant per unit tax is imposed that generates an efficient allocation of resources,then producers receive a per unit price of
A)zero.
B)P4.
C)P3.
D)P2.
E)P1.
Figure 16.2.1Refer to Figure 16.2.1.The figure shows the private marginal cost curve,the social marginal cost curve and the market demand curve.If a constant per unit tax is imposed that generates an efficient allocation of resources,then producers receive a per unit price of
A)zero.
B)P4.
C)P3.
D)P2.
E)P1.
Unlock Deck
Unlock for access to all 111 flashcards in this deck.
Unlock Deck
k this deck
12
Which of the following illustrates the concept of external cost?
A)Bad weather reduces the size of the wheat crop.
B)A reduction in the size of the wheat crop causes income of wheat farmers to fall.
C)Smoking harms the health of the smoker.
D)Smoking harms the health of nearby nonsmokers.
E)Public health services reduce the transmission of disease.
A)Bad weather reduces the size of the wheat crop.
B)A reduction in the size of the wheat crop causes income of wheat farmers to fall.
C)Smoking harms the health of the smoker.
D)Smoking harms the health of nearby nonsmokers.
E)Public health services reduce the transmission of disease.
Unlock Deck
Unlock for access to all 111 flashcards in this deck.
Unlock Deck
k this deck
13
Use the figure below to answer the following questions.
Figure 16.2.1
Refer to Figure 16.2.1.The figure shows the private marginal cost curve,the social marginal cost curve and the market demand curve.If the market is unregulated,then the price is
A)P1.
B)P4.
C)below P1.
D)P2.
E)P3.
Figure 16.2.1Refer to Figure 16.2.1.The figure shows the private marginal cost curve,the social marginal cost curve and the market demand curve.If the market is unregulated,then the price is
A)P1.
B)P4.
C)below P1.
D)P2.
E)P3.
Unlock Deck
Unlock for access to all 111 flashcards in this deck.
Unlock Deck
k this deck
14
A homeowner planting an attractive garden in front of his house creates ________. A bakery baking bread creates ________.
A)no externality;a positive production externality
B)a positive consumption externality;no externality
C)no externality;no externality
D)a positive consumption externality;a positive production externality
E)a positive production externality;no externality
A)no externality;a positive production externality
B)a positive consumption externality;no externality
C)no externality;no externality
D)a positive consumption externality;a positive production externality
E)a positive production externality;no externality
Unlock Deck
Unlock for access to all 111 flashcards in this deck.
Unlock Deck
k this deck
15
An externality is a cost or benefit arising from an economic activity that falls on
A)consumers but not producers.
B)producers but not consumers.
C)consumers or producers.
D)someone other than consumers or producers.
E)none of the above.
A)consumers but not producers.
B)producers but not consumers.
C)consumers or producers.
D)someone other than consumers or producers.
E)none of the above.
Unlock Deck
Unlock for access to all 111 flashcards in this deck.
Unlock Deck
k this deck
16
Use the figure below to answer the following questions.
Figure 16.2.1
Refer to Figure 16.2.1.The figure shows the private marginal cost curve,the social marginal cost curve and the market demand curve.If a constant per unit tax is imposed that generates an efficient allocation of resources,then the quantity produced is
A)zero.
B)Q1.
C)Q2.
D)Q3.
E)greater than Q3.
Figure 16.2.1Refer to Figure 16.2.1.The figure shows the private marginal cost curve,the social marginal cost curve and the market demand curve.If a constant per unit tax is imposed that generates an efficient allocation of resources,then the quantity produced is
A)zero.
B)Q1.
C)Q2.
D)Q3.
E)greater than Q3.
Unlock Deck
Unlock for access to all 111 flashcards in this deck.
Unlock Deck
k this deck
17
Smoking tobacco creates a ________ externality.
A)negative consumption
B)negative production
C)positive consumption
D)positive production
E)none of the above
A)negative consumption
B)negative production
C)positive consumption
D)positive production
E)none of the above
Unlock Deck
Unlock for access to all 111 flashcards in this deck.
Unlock Deck
k this deck
18
Sixty percent of our air pollution comes from
A)solid waste disposal.
B)electric utilities.
C)a growing world population.
D)road transportation and industrial processes.
E)none of the above.
A)solid waste disposal.
B)electric utilities.
C)a growing world population.
D)road transportation and industrial processes.
E)none of the above.
Unlock Deck
Unlock for access to all 111 flashcards in this deck.
Unlock Deck
k this deck
19
Use the figure below to answer the following questions.
Figure 16.2.1
Refer to Figure16.2.1.The figure shows the private marginal cost curve,the social marginal cost curve and the market demand curve.To promote an efficient allocation of resources,the government could impose a constant per unit tax equal to
A)zero.
B)P1.
C)P3 - P1.
D)P4 - P1.
E)P3 - P2.
Figure 16.2.1Refer to Figure16.2.1.The figure shows the private marginal cost curve,the social marginal cost curve and the market demand curve.To promote an efficient allocation of resources,the government could impose a constant per unit tax equal to
A)zero.
B)P1.
C)P3 - P1.
D)P4 - P1.
E)P3 - P2.
Unlock Deck
Unlock for access to all 111 flashcards in this deck.
Unlock Deck
k this deck
20
Use the figure below to answer the following questions.
Figure 16.2.1
Refer to Figure 16.2.1.The figure shows the private marginal cost curve,the social marginal cost curve and the market demand curve.If the market is unregulated,then at the equilibrium output the marginal social cost of production is
A)less than the marginal benefit to consumers.
B)greater than the marginal benefit to consumers.
C)equal to the marginal benefit to consumers.
D)equal to the marginal private cost of production.
E)less than the marginal private cost of production.
Figure 16.2.1Refer to Figure 16.2.1.The figure shows the private marginal cost curve,the social marginal cost curve and the market demand curve.If the market is unregulated,then at the equilibrium output the marginal social cost of production is
A)less than the marginal benefit to consumers.
B)greater than the marginal benefit to consumers.
C)equal to the marginal benefit to consumers.
D)equal to the marginal private cost of production.
E)less than the marginal private cost of production.
Unlock Deck
Unlock for access to all 111 flashcards in this deck.
Unlock Deck
k this deck
21
Use the figure below to answer the following questions.
Figure 16.2.2
Refer to Figure 16.2.2.This figure shows the demand curve,the marginal private cost curve and the marginal social cost curve of good A.What is the efficient quantity of good A?
A)0 units
B)5 units
C)6 units
D)8 units
E)impossible to determine without additional information
Figure 16.2.2Refer to Figure 16.2.2.This figure shows the demand curve,the marginal private cost curve and the marginal social cost curve of good A.What is the efficient quantity of good A?
A)0 units
B)5 units
C)6 units
D)8 units
E)impossible to determine without additional information
Unlock Deck
Unlock for access to all 111 flashcards in this deck.
Unlock Deck
k this deck
22
In the absence of government intervention,a profit-maximizing firm producing a good with an external cost will produce a quantity at which
A)price is greater than marginal private cost.
B)price is less than marginal revenue.
C)price is less than marginal private cost.
D)price equals marginal private cost.
E)marginal revenue equals marginal social cost.
A)price is greater than marginal private cost.
B)price is less than marginal revenue.
C)price is less than marginal private cost.
D)price equals marginal private cost.
E)marginal revenue equals marginal social cost.
Unlock Deck
Unlock for access to all 111 flashcards in this deck.
Unlock Deck
k this deck
23
Use the figure below to answer the following questions.
Figure 16.2.3
Refer to Figure 16.2.3.The unregulated outcome in the paper market is
A)a quantity of 40 tonnes and a price of $11 a tonne.
B)a quantity of 40 tonnes and a price of $13 a tonne.
C)a quantity of 50 tonnes and a price of $12 a tonne.
D)a quantity of 50 tonnes and a price of $14 a tonne.
E)a quantity of 60 tonnes and a price of $13 a tonne.
Figure 16.2.3Refer to Figure 16.2.3.The unregulated outcome in the paper market is
A)a quantity of 40 tonnes and a price of $11 a tonne.
B)a quantity of 40 tonnes and a price of $13 a tonne.
C)a quantity of 50 tonnes and a price of $12 a tonne.
D)a quantity of 50 tonnes and a price of $14 a tonne.
E)a quantity of 60 tonnes and a price of $13 a tonne.
Unlock Deck
Unlock for access to all 111 flashcards in this deck.
Unlock Deck
k this deck
24
Use the table below to answer the following questions.
Table 16.2.2
Chemical Fertilizer Market
-Refer to Table 16.2.2.The Pigovian tax that achieves the efficient quantity of output is
A)$0.
B)$10 a tonne.
C)$20 a tonne.
D)$30 a tonne.
E)$40 a tonne.
Table 16.2.2
Chemical Fertilizer Market
-Refer to Table 16.2.2.The Pigovian tax that achieves the efficient quantity of output is
A)$0.
B)$10 a tonne.
C)$20 a tonne.
D)$30 a tonne.
E)$40 a tonne.
Unlock Deck
Unlock for access to all 111 flashcards in this deck.
Unlock Deck
k this deck
25
Use the table below to answer the following questions.
Table 16.2.1
-Refer to Table 16.2.1.Given in the table are the marginal private cost and the marginal social cost of the production of chemical fertilizer and the marginal social benefit from the consumption of fertilizer.If the market is unregulated,the quantity produced is
A)1 unit.
B)2 units.
C)3 units.
D)4 units.
E)5 units.
Unlock Deck
Unlock for access to all 111 flashcards in this deck.
Unlock Deck
k this deck
26
Use the table below to answer the following questions.
Table 16.2.1
-Refer to Table 16.2.1.Given in the table are the marginal private cost and the marginal social cost of the production of chemical fertilizer and the marginal social benefit from the consumption of fertilizer.If the market is unregulated,the market price is
A)$10 a unit.
B)$20 a unit.
C)$30 a unit.
D)$40 a unit.
E)$50 a unit.
Unlock Deck
Unlock for access to all 111 flashcards in this deck.
Unlock Deck
k this deck
27
Use the figure below to answer the following questions.
Figure 16.2.2
Refer to Figure 16.2.2.This figure shows the demand curve,the marginal private cost curve and the marginal social cost curve of good A.How many units of good A are produced in an unregulated market?
A)0 units
B)5 units
C)6 units
D)8 units
E)9 units
Figure 16.2.2Refer to Figure 16.2.2.This figure shows the demand curve,the marginal private cost curve and the marginal social cost curve of good A.How many units of good A are produced in an unregulated market?
A)0 units
B)5 units
C)6 units
D)8 units
E)9 units
Unlock Deck
Unlock for access to all 111 flashcards in this deck.
Unlock Deck
k this deck
28
Use the table below to answer the following questions.
Table 16.2.2
Chemical Fertilizer Market
-Refer to Table 16.2.2.If the fertilizer market is perfectly competitive and unregulated,output (in tonnes)is
A)1.
B)2.
C)3.
D)4.
E)5.
Table 16.2.2
Chemical Fertilizer Market
-Refer to Table 16.2.2.If the fertilizer market is perfectly competitive and unregulated,output (in tonnes)is
A)1.
B)2.
C)3.
D)4.
E)5.
Unlock Deck
Unlock for access to all 111 flashcards in this deck.
Unlock Deck
k this deck
29
Use the table below to answer the following questions.
Table 16.2.1
-Refer to Table 16.2.1.Given in the table are the marginal private cost and the marginal social cost of the production of chemical fertilizer and the marginal social benefit from the consumption of fertilizer.If the government decides to correct the externality problem,it could
A)subsidize production by $20 per unit.
B)subsidize production by $10 per unit.
C)provide the good itself.
D)tax production by $10 per unit.
E)tax production by $20 per unit.
Unlock Deck
Unlock for access to all 111 flashcards in this deck.
Unlock Deck
k this deck
30
Use the figure below to answer the following questions.
Figure 16.2.2
Refer to Figure 16.2.2.This figure shows the demand curve,the marginal private cost curve and the marginal social cost curve of good A.Production of the 6th unit of output generates a marginal external
A)cost of $1.50.
B)cost of $3.
C)cost of $6.
D)benefit of $3.
E)benefit of $6.
Figure 16.2.2Refer to Figure 16.2.2.This figure shows the demand curve,the marginal private cost curve and the marginal social cost curve of good A.Production of the 6th unit of output generates a marginal external
A)cost of $1.50.
B)cost of $3.
C)cost of $6.
D)benefit of $3.
E)benefit of $6.
Unlock Deck
Unlock for access to all 111 flashcards in this deck.
Unlock Deck
k this deck
31
Use the table below to answer the following questions.
Table 16.2.1
-Refer to Table 16.2.1.Given in the table are the marginal private cost and the marginal social cost of the production of chemical fertilizer and the marginal social benefit from the consumption of fertilizer.Assume the market is perfectly competitive.If the market is unregulated,the marginal
A)social cost equals the marginal private benefit.
B)private cost is less than the marginal social benefit.
C)private cost equals the marginal social benefit.
D)social cost equals the marginal private cost.
E)private cost is greater than the marginal social benefit.
Unlock Deck
Unlock for access to all 111 flashcards in this deck.
Unlock Deck
k this deck
32
Means of coping with negative externalities include all of the following except
A)emission charges.
B)patents.
C)property rights.
D)Pigovian taxes.
E)marketable permits.
A)emission charges.
B)patents.
C)property rights.
D)Pigovian taxes.
E)marketable permits.
Unlock Deck
Unlock for access to all 111 flashcards in this deck.
Unlock Deck
k this deck
33
Use the table below to answer the following questions.
Table 16.2.1
-Refer to Table 16.2.1.Given in the table are the marginal private cost and the marginal social cost of the production of chemical fertilizer and the marginal social benefit from the consumption of fertilizer.If the market is unregulated
A)the quantity produced is the efficient quantity.
B)the quantity produced is greater than the efficient quantity.
C)the quantity produced is less than the efficient quantity.
D)marginal external cost is maximized.
E)production is technologically inefficient.
Unlock Deck
Unlock for access to all 111 flashcards in this deck.
Unlock Deck
k this deck
34
A battery acid producer pollutes the water upstream from the Polar Bear Club,a swimming club.If transactions costs are low,the quantity of pollution will be efficient
A)only if Ronald Coase is a member of the Polar Bear Club.
B)only if Ronald Coase is not a member of the Polar Bear Club.
C)only if water property rights are assigned to the producer.
D)only if water property rights are assigned to the Polar Bear Club.
E)if water property rights are assigned either to the producer or to the Polar Bear Club.
Unlock Deck
Unlock for access to all 111 flashcards in this deck.
Unlock Deck
k this deck
35
When an additional unit of output is produced,the extra cost to society is the
A)average total cost.
B)marginal social cost.
C)marginal private cost.
D)marginal external cost.
E)marginal damage.
A)average total cost.
B)marginal social cost.
C)marginal private cost.
D)marginal external cost.
E)marginal damage.
Unlock Deck
Unlock for access to all 111 flashcards in this deck.
Unlock Deck
k this deck
36
Use the table below to answer the following questions.
Table 16.2.2
Chemical Fertilizer Market
-Refer to Table 16.2.2.Fertilizer has a marginal
A)external cost of $100 a tonne.
B)social cost of $100 a tonne.
C)external cost of $30 a tonne.
D)private cost of $30 a tonne.
E)external cost of $0.
Table 16.2.2
Chemical Fertilizer Market
-Refer to Table 16.2.2.Fertilizer has a marginal
A)external cost of $100 a tonne.
B)social cost of $100 a tonne.
C)external cost of $30 a tonne.
D)private cost of $30 a tonne.
E)external cost of $0.
Unlock Deck
Unlock for access to all 111 flashcards in this deck.
Unlock Deck
k this deck
37
Use the figure below to answer the following questions.
Figure 16.2.2
Refer to Figure 16.2.2.This figure shows the demand curve,the marginal private cost curve and the marginal social cost curve of good A.If the government wanted to achieve the efficient quantity of good A,it could issue marketable permits.If the marketable permits result in the efficient quantity of good A,then the quantity of good A produced is
A)0 units.
B)5 units.
C)6 units.
D)8 units.
E)a level impossible to determine without more information.
Figure 16.2.2Refer to Figure 16.2.2.This figure shows the demand curve,the marginal private cost curve and the marginal social cost curve of good A.If the government wanted to achieve the efficient quantity of good A,it could issue marketable permits.If the marketable permits result in the efficient quantity of good A,then the quantity of good A produced is
A)0 units.
B)5 units.
C)6 units.
D)8 units.
E)a level impossible to determine without more information.
Unlock Deck
Unlock for access to all 111 flashcards in this deck.
Unlock Deck
k this deck
38
Which one of the following is a means of coping with a negative externality?
A)emission subsidies
B)patents
C)vouchers
D)Pigovian taxes
E)copyrights
A)emission subsidies
B)patents
C)vouchers
D)Pigovian taxes
E)copyrights
Unlock Deck
Unlock for access to all 111 flashcards in this deck.
Unlock Deck
k this deck
39
Use the table below to answer the following questions.
Table 16.2.2
Chemical Fertilizer Market
-Refer to Table 16.2.2.The efficient output of fertilizer is
A)1 tonne.
B)2 tonnes.
C)3 tonnes.
D)4 tonnes.
E)5 tonnes.
Table 16.2.2
Chemical Fertilizer Market
-Refer to Table 16.2.2.The efficient output of fertilizer is
A)1 tonne.
B)2 tonnes.
C)3 tonnes.
D)4 tonnes.
E)5 tonnes.
Unlock Deck
Unlock for access to all 111 flashcards in this deck.
Unlock Deck
k this deck
40
The Coase theorem states that
A)patents and copyrights will solve the problem of external costs.
B)taxes will solve the problem of external costs.
C)global warming is hard to solve due to the prisoners' dilemma aspect of the problem.
D)property rights are social arrangements governing ownership,use and disposal of factors of production and goods and services.
E)if property rights are established,and if only a small number of parties are involved,and if transactions costs are low,then private transactions are efficient.
Unlock Deck
Unlock for access to all 111 flashcards in this deck.
Unlock Deck
k this deck
41
Use the figure below to answer the following questions.
Figure 16.2.3
Refer to Figure 16.2.3.A tax of ________ per tonne is necessary to achieve the efficient output of ________ tonnes of paper.
A)$14;50
B)$14;30
C)$13;40
D)$2;50
E)$2;40
Figure 16.2.3Refer to Figure 16.2.3.A tax of ________ per tonne is necessary to achieve the efficient output of ________ tonnes of paper.
A)$14;50
B)$14;30
C)$13;40
D)$2;50
E)$2;40
Unlock Deck
Unlock for access to all 111 flashcards in this deck.
Unlock Deck
k this deck
42
CoolU has solved its smoking problem by allocating each student 5 smoking permits a day,and allowing trading.This is an example of
A)marketable permits.
B)emission charges.
C)the Coase theorem.
D)a pollution tax.
E)a voucher.
A)marketable permits.
B)emission charges.
C)the Coase theorem.
D)a pollution tax.
E)a voucher.
Unlock Deck
Unlock for access to all 111 flashcards in this deck.
Unlock Deck
k this deck
43
When the government issues marketable permits
A)each firm buys or sells permits until its marginal benefit from polluting equals the market price of a permit.
B)firms that have a low marginal cost of reducing pollution sell their permits,and firms that have a high marginal cost of reducing pollution buy permits.
C)the incentive to pollute is greater than when the government sets emission charges.
D)the price at which firms buy and sell permits is set by the government.
E)firms that have a high marginal cost of reducing pollution sell their permits,and firms that have a low marginal cost of reducing pollution buy permits.
Unlock Deck
Unlock for access to all 111 flashcards in this deck.
Unlock Deck
k this deck
44
Use the figure below to answer the following questions.
Figure 16.2.3
Refer to Figure 16.2.3.In this market there is a marginal external
A)cost of $14 a tonne.
B)cost of $12 a tonne.
C)cost of $2 a tonne.
D)benefit of $2 a tonne.
E)benefit of $12 a tonne.
Figure 16.2.3Refer to Figure 16.2.3.In this market there is a marginal external
A)cost of $14 a tonne.
B)cost of $12 a tonne.
C)cost of $2 a tonne.
D)benefit of $2 a tonne.
E)benefit of $12 a tonne.
Unlock Deck
Unlock for access to all 111 flashcards in this deck.
Unlock Deck
k this deck
45
Pollution occurs when lumber is produced.If the lumber market is unregulated,there would be
A)overproduction of lumber compared to the efficient amount.
B)underproduction of lumber compared to the efficient amount.
C)sometimes overproduction and sometimes underproduction of lumber compared to the efficient amount.
D)an external benefit from producing lumber.
E)no deadweight loss from production.
Unlock Deck
Unlock for access to all 111 flashcards in this deck.
Unlock Deck
k this deck
46
The Coase theorem will apply only if
A)an individual who is not affected by the externality can negotiate a settlement between the parties imposing the externality and the parties that are harmed by the externality.
B)the small number of people are involved.
C)the market is perfectly competitive.
D)the courts can be used to determine the amount of compensation that must be made to the damaged party.
E)the amount of compensation that must be made to the damaged party is small.
Unlock Deck
Unlock for access to all 111 flashcards in this deck.
Unlock Deck
k this deck
47
Use the table below to answer the following question.
Table 16.2.3
-Refer to Table 16.2.3.The first two columns of the table show the demand schedule for electricity from a coal burning utility;the second and third columns show the utility's cost of producing electricity. The marginal external cost of the pollution created is equal to the marginal cost.
Suppose the government levies a pollution tax such that the utility generates the efficient quantity of electricity.The pollution tax is ________ cents a kilowatt hour.
A)2
B)4
C)6
D)8
E)10
Unlock Deck
Unlock for access to all 111 flashcards in this deck.
Unlock Deck
k this deck
48
A system of marketable permits is used to reduce acid rain caused by emissions from electric power utilities.Which of the following statements is true?
A)Market forces determine both the demand for marketable permits and their supply.
B)Public choice determines both the demand for marketable permits and their supply.
C)Market forces determine the demand for marketable permits,and property rights determine their supply.
D)Property rights determine the demand for marketable permits,and the government determines their supply.
E)Market forces determine the demand for marketable permits,and the government determines their supply.
Unlock Deck
Unlock for access to all 111 flashcards in this deck.
Unlock Deck
k this deck
49
An externality is
A)the amount by which price exceeds marginal private cost.
B)the amount by which price exceeds marginal social cost.
C)the effect of government regulation on market price and output.
D)someone who consumes a good without paying for it.
E)a cost or benefit that arises from an activity but affects people not part of the original activity.
Unlock Deck
Unlock for access to all 111 flashcards in this deck.
Unlock Deck
k this deck
50
Betty and Anna work at the same office in Calgary.They both must attend a meeting in Edmonton,and they have decided to drive to the meeting together. Betty is a cigarette smoker and her marginal benefit from smoking one package of cigarettes a day is $40.Cigarettes are $6 a pack.
Anna dislikes cigarette smoke and her marginal benefit from a smoke-free environment is $50 a day.
If Betty drives her car with Anna as a passenger,________.If Anna drives her car with Betty as a passenger,________.
A)Anna will offer Betty an amount between $34 and $50 and Betty will not smoke;Betty does not smoke because Betty will not offer Anna a high enough price to be allowed to smoke
B)Betty will smoke because she owns the property rights in the car;Betty does not smoke because Betty will not offer Anna a high enough price to be allowed to smoke
C)Betty will smoke because she owns the property rights in the car;Betty will offer Anna $51 and Betty will smoke
D)Anna will offer Betty an amount between $34 and $50 and Betty will not smoke;Betty will offer Anna $51 and Betty will smoke
E)Betty will smoke because she is the car owner;Betty will offer Anna an amount between $34 and $50 and Betty will smoke
Unlock Deck
Unlock for access to all 111 flashcards in this deck.
Unlock Deck
k this deck
51
The Coase theorem applies when transactions costs are
A)low and property rights exist.
B)low and property rights do not exist.
C)high and property rights exist.
D)high and property rights do not exist.
E)low and there are no externalities.
A)low and property rights exist.
B)low and property rights do not exist.
C)high and property rights exist.
D)high and property rights do not exist.
E)low and there are no externalities.
Unlock Deck
Unlock for access to all 111 flashcards in this deck.
Unlock Deck
k this deck
52
Consider the problem of carbon dioxide pollution due to the use of coal in electric power production.The discovery of very cheap solar power would lead to
A)less carbon dioxide pollution.
B)more carbon dioxide pollution.
C)no change in the amount of carbon dioxide pollution.
D)either more or less carbon dioxide pollution,depending on the amount of solar power pollution.
E)either no change or more carbon dioxide pollution.
A)less carbon dioxide pollution.
B)more carbon dioxide pollution.
C)no change in the amount of carbon dioxide pollution.
D)either more or less carbon dioxide pollution,depending on the amount of solar power pollution.
E)either no change or more carbon dioxide pollution.
Unlock Deck
Unlock for access to all 111 flashcards in this deck.
Unlock Deck
k this deck
53
When the marginal social cost of the production of Good A is greater than the marginal private cost of the production of Good A,then
A)a competitive,unregulated market produces less than the efficient quantity of Good A.
B)a competitive,unregulated market produces the efficient quantity of Good A.
C)a competitive,unregulated market produces more than the efficient quantity of Good A.
D)the government should levy a tax on the production of Good A that is equal to the horizontal distance between the two marginal cost curves.
E)a competitive,unregulated market does not create a deadweight loss.
Unlock Deck
Unlock for access to all 111 flashcards in this deck.
Unlock Deck
k this deck
54
According to the Coase theorem,if transactions costs are low and property rights exist,
A)negative externalities cause deadweight losses.
B)positive externalities cause deadweight losses.
C)private transactions are efficient.
D)public transactions are efficient.
E)the efficient level of pollution will be zero.
A)negative externalities cause deadweight losses.
B)positive externalities cause deadweight losses.
C)private transactions are efficient.
D)public transactions are efficient.
E)the efficient level of pollution will be zero.
Unlock Deck
Unlock for access to all 111 flashcards in this deck.
Unlock Deck
k this deck
55
Consider some type of industrial pollution that generates air pollution.This industry,if left unregulated,will produce
A)too much output because they will ignore the marginal external costs.
B)the efficient level of output.
C)too little output because they will ignore the marginal external costs.
D)too little output because they will ignore the marginal external benefits.
E)too much output because they will ignore the marginal external benefits.
Unlock Deck
Unlock for access to all 111 flashcards in this deck.
Unlock Deck
k this deck
56
If negative externalities exist,then in a market with no property rights,
A)
A)
Unlock Deck
Unlock for access to all 111 flashcards in this deck.
Unlock Deck
k this deck
57
When the production of a good has an external cost,the
A)marginal social cost curve lies below the marginal private cost curve.
B)marginal social benefit curve lies above the marginal private benefit curve.
C)equilibrium quantity in an unregulated,competitive market has a marginal social cost greater than the marginal social benefit.
D)equilibrium quantity in an unregulated,competitive market has a marginal social cost less than the marginal social benefit.
E)none of the above.
Unlock Deck
Unlock for access to all 111 flashcards in this deck.
Unlock Deck
k this deck
58
The Coase theorem tells us that in the presence of external costs in production,
A)the government must intervene in the market to assure that the efficient level of output is produced.
B)private parties can negotiate to produce the good at a level where marginal willingness to pay for the good by consumers is zero.
C)private parties can never arrive at the efficient solution.
D)then under certain conditions,private parties can arrive at the efficient solution without government involvement.
E)and if transactions costs are high,then only the private sector will be able to produce the efficient amount of the good.
Unlock Deck
Unlock for access to all 111 flashcards in this deck.
Unlock Deck
k this deck
59
One way to solve negative externality problems is
A)to organize a limited boycott of the products.
B)subsidize the externalities.
C)eliminate transactions costs when property rights are not legally established.
D)issue marketable permits to polluting firms.
E)establish and enforce patents and copyrights.
A)to organize a limited boycott of the products.
B)subsidize the externalities.
C)eliminate transactions costs when property rights are not legally established.
D)issue marketable permits to polluting firms.
E)establish and enforce patents and copyrights.
Unlock Deck
Unlock for access to all 111 flashcards in this deck.
Unlock Deck
k this deck
60
The marginal private cost curve (MC)is a positively-sloped straight line starting at the origin.If marginal external cost increases as output increases,then the marginal social cost curve is a positively-sloped straight line
A)parallel to and above the MC curve.
B)parallel to and below the MC curve.
C)starting at the origin,above the MC curve,and with a slope greater than the MC curve.
D)starting at the origin,below the MC curve,and with a slope less than the MC curve.
E)none of the above.
A)parallel to and above the MC curve.
B)parallel to and below the MC curve.
C)starting at the origin,above the MC curve,and with a slope greater than the MC curve.
D)starting at the origin,below the MC curve,and with a slope less than the MC curve.
E)none of the above.
Unlock Deck
Unlock for access to all 111 flashcards in this deck.
Unlock Deck
k this deck
61
Producing paper creates pollution.There is no externality in the consumption of paper.The efficient quantity of paper produced occurs when the
A)marginal social benefit from paper is equal to zero.
B)marginal social cost of the pollution from making paper is equal to zero.
C)marginal private cost of the pollution from making paper is equal to zero.
D)marginal private cost of paper equals the marginal private benefit from paper.
E)marginal social benefit from paper is equal to the marginal social cost of paper.
Unlock Deck
Unlock for access to all 111 flashcards in this deck.
Unlock Deck
k this deck
62
Use the figure below to answer the following questions.
Figure 16.3.1
Refer to Figure 16.3.1.The figure shows the marginal private benefit curve,the marginal social benefit curve,and the market supply curve.If a voucher is given to consumers that generates an efficient outcome,then producers receive a price of
A)zero.
B)P1 per unit.
C)P2 per unit.
D)P3 per unit.
E)P4 per unit.
Figure 16.3.1Refer to Figure 16.3.1.The figure shows the marginal private benefit curve,the marginal social benefit curve,and the market supply curve.If a voucher is given to consumers that generates an efficient outcome,then producers receive a price of
A)zero.
B)P1 per unit.
C)P2 per unit.
D)P3 per unit.
E)P4 per unit.
Unlock Deck
Unlock for access to all 111 flashcards in this deck.
Unlock Deck
k this deck
63
Use the table below to answer the following questions.
Table 16.3.1
-Refer to Table 16.3.1.The table shows marginal private benefit and the marginal social benefit from the consumption of chemical fertilizer and the marginal social cost of the production of fertilizer.Choose the correct statement.
A)The marginal external benefit is $20 per unit.
B)The marginal external cost is $10 per unit.
C)There are no externalities associated with this market.
D)The marginal external benefit is $10 per unit.
E)There is not enough information provided to determine whether or not there are externalities.
Unlock Deck
Unlock for access to all 111 flashcards in this deck.
Unlock Deck
k this deck
64
Use the table below to answer the following questions.
Table 16.3.1
-Refer to Table 16.3.1.The table shows marginal private benefit and the marginal social benefit from the consumption of chemical fertilizer and the marginal social cost of the production of fertilizer.If production is left to the private market,the quantity produced is
A)1 unit.
B)2 units.
C)3 units.
D)4 units.
E)5 units.
Unlock Deck
Unlock for access to all 111 flashcards in this deck.
Unlock Deck
k this deck
65
A chemical factory and a fishing club share a lake.Producing chemicals creates water pollution that harms the fish.Initially the lake is owned by no one.Keeping in mind the Coase theorem,suppose transactions costs are low and the chemical factory is given ownership of the lake.Compared to the situation with no property rights,the quantity of chemicals produced
A)decreases.
B)stays the same.
C)increases.
D)changes but the direction of the change is unknown.
E)decreases only if the marginal external benefit decreases.
A)decreases.
B)stays the same.
C)increases.
D)changes but the direction of the change is unknown.
E)decreases only if the marginal external benefit decreases.
Unlock Deck
Unlock for access to all 111 flashcards in this deck.
Unlock Deck
k this deck
66
Consider the production of pesticide that pollutes a lake used by a trout farmer.A marketable permit
A)creates an efficient outcome when the price of the permit is set equal to the external cost.
B)cannot result in the same outcome as when property rights are assigned to the pesticide producer.
C)cannot result in the same outcome as when property rights are assigned to the trout farm.
D)cannot result in the same outcome as when the government imposes a Pigovian tax.
E)creates an efficient outcome when the price of the permits is set equal to the external benefit.
Unlock Deck
Unlock for access to all 111 flashcards in this deck.
Unlock Deck
k this deck
67
Use the figure below to answer the following questions.
Figure 16.3.1
Refer to Figure 16.3.1.The figure shows the marginal private benefit curve,the marginal social benefit curve,and the market supply curve.If production is left to the private market,then
A)the quantity produced is less than the efficient quantity.
B)the quantity produced is greater than the efficient quantity.
C)price is greater than marginal social benefit quantity.
D)the marginal cost curve is horizontal.
E)none of the above.
Figure 16.3.1Refer to Figure 16.3.1.The figure shows the marginal private benefit curve,the marginal social benefit curve,and the market supply curve.If production is left to the private market,then
A)the quantity produced is less than the efficient quantity.
B)the quantity produced is greater than the efficient quantity.
C)price is greater than marginal social benefit quantity.
D)the marginal cost curve is horizontal.
E)none of the above.
Unlock Deck
Unlock for access to all 111 flashcards in this deck.
Unlock Deck
k this deck
68
Use the table below to answer the following questions.
Table 16.3.1
-Refer to Table 16.3.1.The table shows marginal private benefit and the marginal social benefit from the consumption of chemical fertilizer and the marginal social cost of the production of fertilizer.If production is left to the private market,the market price is
A)$70 a unit.
B)$60 a unit.
C)$50 a unit.
D)$40 a unit.
E)$30 a unit.
Unlock Deck
Unlock for access to all 111 flashcards in this deck.
Unlock Deck
k this deck
69
If the marginal private cost of producing one kilowatt of power in British Columbia equals five cents and the marginal social cost of each kilowatt equals nine cents,then the marginal external cost equals ________ per kilowatt.
A)five cents
B)nine cents
C)four cents
D)fourteen cents
E)forty-five cents
A)five cents
B)nine cents
C)four cents
D)fourteen cents
E)forty-five cents
Unlock Deck
Unlock for access to all 111 flashcards in this deck.
Unlock Deck
k this deck
70
A private cost of production is a cost that is borne by the ________ of a good or service. A social cost of production is a cost that is ________.
A)consumer;borne by the producer and by everyone else on whom the cost falls
B)consumer;not borne by the producer but borne by other people
C)producer;not borne by the producer but borne by other people
D)producer;borne by the producer and by everyone else on whom the cost falls
E)producer;borne by the consumer
Unlock Deck
Unlock for access to all 111 flashcards in this deck.
Unlock Deck
k this deck
71
If the production of a good creates pollution,then the
A)marginal social benefit curve lies above the marginal private benefit curve.
B)marginal social cost curve lies above the marginal private cost curve.
C)marginal social benefit curve lies below the marginal private benefit curve.
D)marginal social cost curve lies below the marginal private cost curve.
E)marginal social benefit curve intersects the marginal private cost curve at the efficient quantity.
Unlock Deck
Unlock for access to all 111 flashcards in this deck.
Unlock Deck
k this deck
72
Use the figure below to answer the following questions.
Figure 16.3.1
Refer to Figure 16.3.1.The figure shows the marginal private benefit curve,the marginal social benefit curve,and the market supply curve.If a subsidy is granted that generates an efficient quantity,then quantity produced is
A)zero.
B)Q1.
C)Q2.
D)Q3.
E)greater than Q3.
Figure 16.3.1Refer to Figure 16.3.1.The figure shows the marginal private benefit curve,the marginal social benefit curve,and the market supply curve.If a subsidy is granted that generates an efficient quantity,then quantity produced is
A)zero.
B)Q1.
C)Q2.
D)Q3.
E)greater than Q3.
Unlock Deck
Unlock for access to all 111 flashcards in this deck.
Unlock Deck
k this deck
73
All of the following statements about emission charges are correct except
A)the more pollution a firm creates,the more it pays in emission charges.
B)emission charges are frequently used in North America.
C)the government sets a price per unit of pollution.
D)to work out the emission charge that achieves efficiency,the government needs a lot of information about the polluting industry that is rarely available.
E)emission charges are frequently used in Europe.
Unlock Deck
Unlock for access to all 111 flashcards in this deck.
Unlock Deck
k this deck
74
Use the figure below to answer the following questions.
Figure 16.3.1
Refer to Figure 16.3.1.The figure shows the marginal private benefit curve,the marginal social benefit curve,and the market supply curve.To promote an efficient quantity the government could grant a subsidy equal to
A)zero.
B)P1.
C)P3 - P1.
D)P4 - P1.
E)P2 - P1.
Figure 16.3.1Refer to Figure 16.3.1.The figure shows the marginal private benefit curve,the marginal social benefit curve,and the market supply curve.To promote an efficient quantity the government could grant a subsidy equal to
A)zero.
B)P1.
C)P3 - P1.
D)P4 - P1.
E)P2 - P1.
Unlock Deck
Unlock for access to all 111 flashcards in this deck.
Unlock Deck
k this deck
75
When Good A is produced,pollution is also produced.When the marginal social cost of production of Good A equals marginal social benefit from Good A,then I.there is no pollution
II.resources are used efficiently
A)I only
B)II only
C)neither I nor II
D)both I and II
E)sometimes I and sometimes II,but never both simultaneously
II.resources are used efficiently
A)I only
B)II only
C)neither I nor II
D)both I and II
E)sometimes I and sometimes II,but never both simultaneously
Unlock Deck
Unlock for access to all 111 flashcards in this deck.
Unlock Deck
k this deck
76
Use the figure below to answer the following questions.
Figure 16.3.1
Refer to Figure 16.3.1.The figure shows the marginal private benefit curve,the marginal social benefit curve,and the market supply curve.If production is left to the private market,then the price is
A)P1.
B)P3.
C)P2.
D)greater than P4.
E)P4.
Figure 16.3.1Refer to Figure 16.3.1.The figure shows the marginal private benefit curve,the marginal social benefit curve,and the market supply curve.If production is left to the private market,then the price is
A)P1.
B)P3.
C)P2.
D)greater than P4.
E)P4.
Unlock Deck
Unlock for access to all 111 flashcards in this deck.
Unlock Deck
k this deck
77
Use the figure below to answer the following questions.
Figure 16.3.1
Refer to Figure 16.3.1.The figure shows the marginal private benefit curve,the marginal social benefit curve,and the market supply curve.If production is left to the private market,then the quantity produced is
A)zero.
B)Q1.
C)Q2.
D)Q3.
E)between 0 and Q1.
Figure 16.3.1Refer to Figure 16.3.1.The figure shows the marginal private benefit curve,the marginal social benefit curve,and the market supply curve.If production is left to the private market,then the quantity produced is
A)zero.
B)Q1.
C)Q2.
D)Q3.
E)between 0 and Q1.
Unlock Deck
Unlock for access to all 111 flashcards in this deck.
Unlock Deck
k this deck
78
Use the figure below to answer the following questions.
Figure 16.3.1
Refer to Figure 16.3.1.The figure shows the marginal private benefit curve,the marginal social benefit curve,and the market supply curve.If a voucher is given to consumers that generates an efficient outcome,then consumers pay
A)zero.
B)P1 per unit.
C)P2 per unit.
D)P3 per unit.
E)P4 per unit.
Figure 16.3.1Refer to Figure 16.3.1.The figure shows the marginal private benefit curve,the marginal social benefit curve,and the market supply curve.If a voucher is given to consumers that generates an efficient outcome,then consumers pay
A)zero.
B)P1 per unit.
C)P2 per unit.
D)P3 per unit.
E)P4 per unit.
Unlock Deck
Unlock for access to all 111 flashcards in this deck.
Unlock Deck
k this deck
79
The marginal private benefit curve (MB)is a negatively-sloped straight line.If marginal external benefit decreases as output increases,the marginal social benefit curve is a negatively-sloped straight line
A)parallel to and above the MB curve.
B)parallel to and below the MB curve.
C)above the MB curve and steeper than the MB curve.
D)above the MB curve and flatter than the MB curve.
E)below the MB curve and flatter than the MB curve.
A)parallel to and above the MB curve.
B)parallel to and below the MB curve.
C)above the MB curve and steeper than the MB curve.
D)above the MB curve and flatter than the MB curve.
E)below the MB curve and flatter than the MB curve.
Unlock Deck
Unlock for access to all 111 flashcards in this deck.
Unlock Deck
k this deck
80
Use the figure below to answer the following questions.
Figure 16.3.1
Refer to Figure 16.3.1.The figure shows the marginal private benefit curve,the marginal social benefit curve,and the market supply curve.If production is left to the private market,then at the equilibrium quantity the marginal social benefit from consumption is
A)less than the marginal cost to producers.
B)less than the marginal social cost of production.
C)equal to the marginal cost to producers.
D)equal to the marginal private benefit from consumption.
E)greater than the marginal cost to producers.
Figure 16.3.1Refer to Figure 16.3.1.The figure shows the marginal private benefit curve,the marginal social benefit curve,and the market supply curve.If production is left to the private market,then at the equilibrium quantity the marginal social benefit from consumption is
A)less than the marginal cost to producers.
B)less than the marginal social cost of production.
C)equal to the marginal cost to producers.
D)equal to the marginal private benefit from consumption.
E)greater than the marginal cost to producers.
Unlock Deck
Unlock for access to all 111 flashcards in this deck.
Unlock Deck
k this deck
Unlock Deck
Unlock for access to all 111 flashcards in this deck.


