Deck 3: Demand and Supply
Full screen (f)
Question
Question
Question
Question
Question
Question
Question
Question
Question
Question
Question
Question
Question
Question
Question
Question
Question
Question
Question
Question
Question
Question
Use the figure below to answer the following questions.
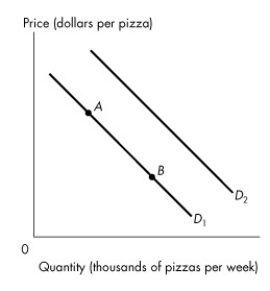 Figure 3.2.2
Refer to Figure 3.2.2.If consumers' income increases,
A)the quantity of pizzas demanded increases.
B)the demand curve for pizzas shifts from D1 to D2 if a pizza is a normal good.
C)the supply of pizzas increases.
D)the quantity of pizzas supplied decreases.
E)a movement from point A to point B on D1 occurs.
Figure 3.2.2Refer to Figure 3.2.2.If consumers' income increases,
A)the quantity of pizzas demanded increases.
B)the demand curve for pizzas shifts from D1 to D2 if a pizza is a normal good.
C)the supply of pizzas increases.
D)the quantity of pizzas supplied decreases.
E)a movement from point A to point B on D1 occurs.
Question
Use the figure below to answer the following questions.
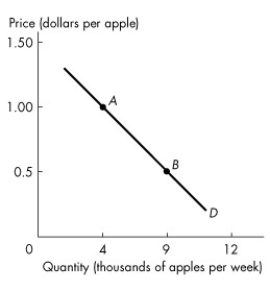 Figure 3.2.1
Point A in Figure 3.2.1 indicates that
A)$1 is the least that consumers are willing to pay for the 4,000th apple.
B)consumers will not be in equilibrium if the price of an apple is $1.
C)consumers will only pay $1 for any apple.
D)if the price is $1,consumers will plan to buy 4,000 apples.
E)if the price is more than $1,consumers will buy 9,000 apples.
Figure 3.2.1Point A in Figure 3.2.1 indicates that
A)$1 is the least that consumers are willing to pay for the 4,000th apple.
B)consumers will not be in equilibrium if the price of an apple is $1.
C)consumers will only pay $1 for any apple.
D)if the price is $1,consumers will plan to buy 4,000 apples.
E)if the price is more than $1,consumers will buy 9,000 apples.
Question
Use the figure below to answer the following questions.
Figure 3.2.2
Which one of the following would result in the demand curve shifting from D1 to D2 in Figure 3.2.2?
A)an increase in the supply of pizza
B)a rise in the price of hamburgers,a substitute for pizza
C)a rise in the price of pizza
D)a fall in the price of pizza
E)a rise in the price of Coke,a complement of pizza
Figure 3.2.2Which one of the following would result in the demand curve shifting from D1 to D2 in Figure 3.2.2?
A)an increase in the supply of pizza
B)a rise in the price of hamburgers,a substitute for pizza
C)a rise in the price of pizza
D)a fall in the price of pizza
E)a rise in the price of Coke,a complement of pizza
Question
Question
Question
Question
Question
Question
Question
Question
Question
Question
Question
Question
Question
Question
Use the figure below to answer the following questions.
Figure 3.2.2
Refer to Figure 3.2.2.Which one of the following represents a decrease in quantity demanded?
A)a shift from D1 to D2
B)a shift from D2 to D1
C)a movement from A to B
D)a movement from B to A
E)none of the above
Figure 3.2.2Refer to Figure 3.2.2.Which one of the following represents a decrease in quantity demanded?
A)a shift from D1 to D2
B)a shift from D2 to D1
C)a movement from A to B
D)a movement from B to A
E)none of the above
Question
Question
Question
Question
Question
Question
Question
Question
Question
Question
Question
Question
Question
Question
Question
Question
Question
Question
Question
Question
Question
Question
Question
Question
Question
Use the figure below to answer the following questions.
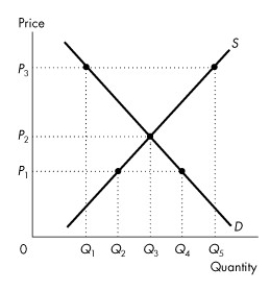 Figure 3.4.1
At price P2 in Figure 3.4.1,which one of the following is not true?
A)This market is in equilibrium.
B)The quantity demanded is equal to the quantity supplied.
C)The quantity demanded is Q1.
D)There is no surplus.
E)The quantity supplied is Q3.
Figure 3.4.1At price P2 in Figure 3.4.1,which one of the following is not true?
A)This market is in equilibrium.
B)The quantity demanded is equal to the quantity supplied.
C)The quantity demanded is Q1.
D)There is no surplus.
E)The quantity supplied is Q3.
Question
Use the figure below to answer the following questions.
Figure 3.4.1
At price P1 in Figure 3.4.1,
A)producers can sell all they plan to sell.
B)consumers can buy all they want.
C)producers are unwilling to sell any goods.
D)a surplus exists.
E)both sides of the market are able to carry out their desired transactions.
Figure 3.4.1At price P1 in Figure 3.4.1,
A)producers can sell all they plan to sell.
B)consumers can buy all they want.
C)producers are unwilling to sell any goods.
D)a surplus exists.
E)both sides of the market are able to carry out their desired transactions.
Question
Question
Question
Question
Use the figure below to answer the following questions.
Figure 3.4.1
At price P1 in Figure 3.4.1
A)there is a surplus in the amount of Q4 - Q2.
B)there is a shortage in the amount of Q4 - Q2.
C)there is a tendency for the price to fall.
D)the equilibrium quantity is Q2.
E)the equilibrium quantity is Q4.
Figure 3.4.1At price P1 in Figure 3.4.1
A)there is a surplus in the amount of Q4 - Q2.
B)there is a shortage in the amount of Q4 - Q2.
C)there is a tendency for the price to fall.
D)the equilibrium quantity is Q2.
E)the equilibrium quantity is Q4.
Question
Question
Use the figure below to answer the following questions.
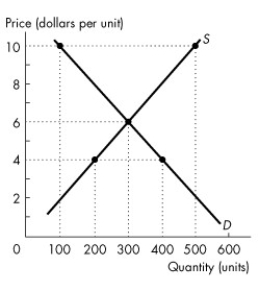 Figure 3.4.2
The equilibrium price in the market illustrated by Figure 3.4.2 is
A)$2 a unit.
B)$4 a unit.
C)$6 a unit.
D)$8 a unit.
E)$10 a unit.
Figure 3.4.2The equilibrium price in the market illustrated by Figure 3.4.2 is
A)$2 a unit.
B)$4 a unit.
C)$6 a unit.
D)$8 a unit.
E)$10 a unit.
Question
Question
Use the figure below to answer the following questions.
Figure 3.4.1
At price P3 in Figure 3.4.1,
A)this market is in equilibrium.
B)there is a shortage in the amount of Q5 - Q1.
C)there is a tendency for the price to rise.
D)equilibrium quantity is Q5.
E)there is a surplus in the amount of Q5 - Q1.
Figure 3.4.1At price P3 in Figure 3.4.1,
A)this market is in equilibrium.
B)there is a shortage in the amount of Q5 - Q1.
C)there is a tendency for the price to rise.
D)equilibrium quantity is Q5.
E)there is a surplus in the amount of Q5 - Q1.
Question
Question
Question
Question
Question
Question
Question
Question
Use the figure below to answer the following questions.
Figure 3.4.2
Refer to Figure 3.4.2.When the price is $10 a unit
A)consumers will buy only 100 units of output.
B)consumers will buy 500 units of output.
C)consumers will buy nothing.
D)a shortage occurs.
E)the surplus is zero.
Figure 3.4.2Refer to Figure 3.4.2.When the price is $10 a unit
A)consumers will buy only 100 units of output.
B)consumers will buy 500 units of output.
C)consumers will buy nothing.
D)a shortage occurs.
E)the surplus is zero.

Unlock Deck
Sign up to unlock the cards in this deck!
Unlock Deck
Unlock Deck
1/178
Play
Full screen (f)
Deck 3: Demand and Supply
1
Use the table below to answer the following questions.
Table 3.1.1
-Refer to Table 3.1.1.Between 2011 and 2012,the price of coffee relative to the price of tea ________ while the price of coffee relative to the price of cola ________.
A)rose;rose
B)rose;fell
C)fell;rose
D)fell;fell
E)fell;stayed constant
Table 3.1.1
-Refer to Table 3.1.1.Between 2011 and 2012,the price of coffee relative to the price of tea ________ while the price of coffee relative to the price of cola ________.
A)rose;rose
B)rose;fell
C)fell;rose
D)fell;fell
E)fell;stayed constant
fell;fell
2
A market where no single buyer or seller can influence the price is
A)a buyer's market.
B)a seller's market.
C)a competitive market.
D)an output market.
E)an input market.
A)a buyer's market.
B)a seller's market.
C)a competitive market.
D)an output market.
E)an input market.
C
3
The demand curve slopes downward to the right because
A)an increase in income leads to increased consumption.
B)of the law of supply.
C)of the law of demand.
D)of comparative advantage.
E)as income rises,the quantity demanded increases.
A)an increase in income leads to increased consumption.
B)of the law of supply.
C)of the law of demand.
D)of comparative advantage.
E)as income rises,the quantity demanded increases.
C
4
A relative price is
A)the ratio of one price to another.
B)an opportunity cost.
C)a quantity of a "basket" of goods and services forgone.
D)determined by demand and supply.
E)all of the above.
A)the ratio of one price to another.
B)an opportunity cost.
C)a quantity of a "basket" of goods and services forgone.
D)determined by demand and supply.
E)all of the above.
Unlock Deck
Unlock for access to all 178 flashcards in this deck.
Unlock Deck
k this deck
5
The demand and supply model determines
A)relative prices.
B)money prices.
C)supply prices.
D)demand prices.
E)absolute prices.
A)relative prices.
B)money prices.
C)supply prices.
D)demand prices.
E)absolute prices.
Unlock Deck
Unlock for access to all 178 flashcards in this deck.
Unlock Deck
k this deck
6
Which market is an example of a market for goods?
A)labour market
B)haircut market
C)manufactured input market
D)apple market
E)energy market
A)labour market
B)haircut market
C)manufactured input market
D)apple market
E)energy market
Unlock Deck
Unlock for access to all 178 flashcards in this deck.
Unlock Deck
k this deck
7
An increase in the price of ground beef
A)increases the demand for chicken,a substitute for ground beef.
B)increases the demand for hamburger buns,a complement of ground beef.
C)increases the quantity demanded of ground beef.
D)decreases the quantity demanded of ground beef.
E)both A and D.
A)increases the demand for chicken,a substitute for ground beef.
B)increases the demand for hamburger buns,a complement of ground beef.
C)increases the quantity demanded of ground beef.
D)decreases the quantity demanded of ground beef.
E)both A and D.
Unlock Deck
Unlock for access to all 178 flashcards in this deck.
Unlock Deck
k this deck
8
Which one of the following events shifts the demand curve for grape jelly to the right?
A)an increase in income if grape jelly is a normal good
B)a decrease in the price of strawberry preserves,a substitute for grape jelly
C)a decrease in the price of grape jelly
D)an increase in the price of peanut butter,a complement of grape jelly
E)a decrease in the population
A)an increase in income if grape jelly is a normal good
B)a decrease in the price of strawberry preserves,a substitute for grape jelly
C)a decrease in the price of grape jelly
D)an increase in the price of peanut butter,a complement of grape jelly
E)a decrease in the population
Unlock Deck
Unlock for access to all 178 flashcards in this deck.
Unlock Deck
k this deck
9
Suppose the price of a football is $20.00 and the price of a basketball is $10.00.The ________ of a football is ________.
A)relative price;2 basketballs per football
B)relative price;1/2 basketball per football
C)opportunity cost;$15.00
D)opportunity cost;$10.00
E)relative price;$10
A)relative price;2 basketballs per football
B)relative price;1/2 basketball per football
C)opportunity cost;$15.00
D)opportunity cost;$10.00
E)relative price;$10
Unlock Deck
Unlock for access to all 178 flashcards in this deck.
Unlock Deck
k this deck
10
The opportunity cost of good A in terms of good B is equal to the
A)money price of good A minus the money price of good B.
B)money price of good B minus the money price of good A.
C)ratio of the money price of good A to the money price of good B.
D)ratio of the money price of good B to the money price of good A.
E)money price of good A plus the money price of good B.
Unlock Deck
Unlock for access to all 178 flashcards in this deck.
Unlock Deck
k this deck
11
Use the table below to answer the following questions.
Table 3.1.1
-Refer to Table 3.1.1.In 2012,the relative price of cola in terms of tea is
A)1.00.
B)1.20.
C)0.83.
D)1.25.
E)unknown without more information.
Table 3.1.1
-Refer to Table 3.1.1.In 2012,the relative price of cola in terms of tea is
A)1.00.
B)1.20.
C)0.83.
D)1.25.
E)unknown without more information.
Unlock Deck
Unlock for access to all 178 flashcards in this deck.
Unlock Deck
k this deck
12
Use the table below to answer the following questions.
Table 3.1.1
-Refer to Table 3.1.1.In 2012,the relative price of coffee in terms of cola is
A)1.25.
B)1.00.
C)0.67.
D)1.56.
E)unknown without more information.
Table 3.1.1
-Refer to Table 3.1.1.In 2012,the relative price of coffee in terms of cola is
A)1.25.
B)1.00.
C)0.67.
D)1.56.
E)unknown without more information.
Unlock Deck
Unlock for access to all 178 flashcards in this deck.
Unlock Deck
k this deck
13
The law of demand states that,other things remaining the same,
A)the higher the price of a good,the smaller is the quantity demanded.
B)the higher the price of a good,the smaller is the quantity supplied.
C)price and quantity supplied are positively related.
D)as income increases,willingness to pay for the last unit increases.
E)the higher the price of a good,the greater is the quantity demanded.
Unlock Deck
Unlock for access to all 178 flashcards in this deck.
Unlock Deck
k this deck
14
The relative price of a good is all of the following except
A)the ratio of one price to another.
B)an opportunity cost.
C)the money price of the good divided by a price index.
D)the same as the money price of a good.
E)determined in a market.
A)the ratio of one price to another.
B)an opportunity cost.
C)the money price of the good divided by a price index.
D)the same as the money price of a good.
E)determined in a market.
Unlock Deck
Unlock for access to all 178 flashcards in this deck.
Unlock Deck
k this deck
15
Which market is an example of a market for services?
A)orange market
B)tennis lessons market
C)manufactured input market
D)energy market
E)labour market
A)orange market
B)tennis lessons market
C)manufactured input market
D)energy market
E)labour market
Unlock Deck
Unlock for access to all 178 flashcards in this deck.
Unlock Deck
k this deck
16
William Gregg owned a mill in South Carolina.In December 1862,he placed a notice in the Edgehill Advertister announcing his willingness to exchange cloth for food and other items.Here is an extract: 1 yard of cloth for 1 pound of bacon
2 yards of cloth for 1 pound of butter
4 yards of cloth for 1 pound of wool
8 yards of cloth for 1 bushel of salt
If the money price of bacon was 20¢ a pound and the money price of salt was $2.00 a bushel,people would ________.
A)buy bacon and trade it for cloth because they could buy 8 yards of cloth for only $1.60,and use that cloth to obtain a bushel of salt
B)not buy bacon and trade it for cloth because they would have to buy 8 yards of cloth for $1.60 and then give Mr.Gregg an extra $0.40 to buy a bushel of salt
C)buy bacon and trade it for cloth and then trade the cloth for salt because salt is more important for life than either cloth or bacon
D)not buy bacon and trade it for cloth because the relative price of 1 bushel of salt is only 1/8 yard of cloth
E)buy bacon and trade it for cloth because cloth is more expensive than bacon
Unlock Deck
Unlock for access to all 178 flashcards in this deck.
Unlock Deck
k this deck
17
Use the table below to answer the following questions.
Table 3.1.1
-Refer to Table 3.1.1.Between 2010 and 2011,the price of coffee relative to the price of tea ________ while the price of coffee relative to the price of cola ________.
A)rose;rose
B)rose;fell
C)fell;rose
D)fell;fell
E)fell;stayed constant
Table 3.1.1
-Refer to Table 3.1.1.Between 2010 and 2011,the price of coffee relative to the price of tea ________ while the price of coffee relative to the price of cola ________.
A)rose;rose
B)rose;fell
C)fell;rose
D)fell;fell
E)fell;stayed constant
Unlock Deck
Unlock for access to all 178 flashcards in this deck.
Unlock Deck
k this deck
18
How many sides does a market have?
A)one side - buyers
B)one side - sellers
C)two sides - buyers and sellers
D)three sides - buyers,sellers,and the government
E)two sides - domestic and foreign
A)one side - buyers
B)one side - sellers
C)two sides - buyers and sellers
D)three sides - buyers,sellers,and the government
E)two sides - domestic and foreign
Unlock Deck
Unlock for access to all 178 flashcards in this deck.
Unlock Deck
k this deck
19
Which market is an example of a resource market?
A)furniture market
B)apple market
C)automobile market
D)haircut market
E)labour market
A)furniture market
B)apple market
C)automobile market
D)haircut market
E)labour market
Unlock Deck
Unlock for access to all 178 flashcards in this deck.
Unlock Deck
k this deck
20
Use the table below to answer the following questions.
Table 3.1.1
-Refer to Table 3.1.1.In 2010,the relative price of coffee in terms of tea is
A)1.25.
B)1.10.
C)1.00.
D)0.88.
E)1.14.
Table 3.1.1
-Refer to Table 3.1.1.In 2010,the relative price of coffee in terms of tea is
A)1.25.
B)1.10.
C)1.00.
D)0.88.
E)1.14.
Unlock Deck
Unlock for access to all 178 flashcards in this deck.
Unlock Deck
k this deck
21
Good A is a normal good if
A)a rise in the price of a complement causes the demand for A to decrease.
B)income and the demand for A are negatively related.
C)a rise in the price of a substitute causes the demand for A to increase.
D)the demand for A increases when income rises.
E)good A satisfies the law of demand.
A)a rise in the price of a complement causes the demand for A to decrease.
B)income and the demand for A are negatively related.
C)a rise in the price of a substitute causes the demand for A to increase.
D)the demand for A increases when income rises.
E)good A satisfies the law of demand.
Unlock Deck
Unlock for access to all 178 flashcards in this deck.
Unlock Deck
k this deck
22
Use the figure below to answer the following questions.
Figure 3.2.2
Refer to Figure 3.2.2.If consumers' income increases,
A)the quantity of pizzas demanded increases.
B)the demand curve for pizzas shifts from D1 to D2 if a pizza is a normal good.
C)the supply of pizzas increases.
D)the quantity of pizzas supplied decreases.
E)a movement from point A to point B on D1 occurs.
Figure 3.2.2Refer to Figure 3.2.2.If consumers' income increases,
A)the quantity of pizzas demanded increases.
B)the demand curve for pizzas shifts from D1 to D2 if a pizza is a normal good.
C)the supply of pizzas increases.
D)the quantity of pizzas supplied decreases.
E)a movement from point A to point B on D1 occurs.
Unlock Deck
Unlock for access to all 178 flashcards in this deck.
Unlock Deck
k this deck
23
Use the figure below to answer the following questions.
Figure 3.2.1
Point A in Figure 3.2.1 indicates that
A)$1 is the least that consumers are willing to pay for the 4,000th apple.
B)consumers will not be in equilibrium if the price of an apple is $1.
C)consumers will only pay $1 for any apple.
D)if the price is $1,consumers will plan to buy 4,000 apples.
E)if the price is more than $1,consumers will buy 9,000 apples.
Figure 3.2.1Point A in Figure 3.2.1 indicates that
A)$1 is the least that consumers are willing to pay for the 4,000th apple.
B)consumers will not be in equilibrium if the price of an apple is $1.
C)consumers will only pay $1 for any apple.
D)if the price is $1,consumers will plan to buy 4,000 apples.
E)if the price is more than $1,consumers will buy 9,000 apples.
Unlock Deck
Unlock for access to all 178 flashcards in this deck.
Unlock Deck
k this deck
24
Use the figure below to answer the following questions.
Figure 3.2.2
Which one of the following would result in the demand curve shifting from D1 to D2 in Figure 3.2.2?
A)an increase in the supply of pizza
B)a rise in the price of hamburgers,a substitute for pizza
C)a rise in the price of pizza
D)a fall in the price of pizza
E)a rise in the price of Coke,a complement of pizza
Figure 3.2.2Which one of the following would result in the demand curve shifting from D1 to D2 in Figure 3.2.2?
A)an increase in the supply of pizza
B)a rise in the price of hamburgers,a substitute for pizza
C)a rise in the price of pizza
D)a fall in the price of pizza
E)a rise in the price of Coke,a complement of pizza
Unlock Deck
Unlock for access to all 178 flashcards in this deck.
Unlock Deck
k this deck
25
A decrease in quantity demanded is represented by a
A)rightward shift of the supply curve.
B)rightward shift of the demand curve.
C)leftward shift of the demand curve.
D)movement upward and to the left along the demand curve.
E)movement downward and to the right along the demand curve.
A)rightward shift of the supply curve.
B)rightward shift of the demand curve.
C)leftward shift of the demand curve.
D)movement upward and to the left along the demand curve.
E)movement downward and to the right along the demand curve.
Unlock Deck
Unlock for access to all 178 flashcards in this deck.
Unlock Deck
k this deck
26
A turnip is an inferior good if
A)an increase in the price of a turnip decreases the quantity of turnips that consumers want to buy.
B)an increase in income decreases the demand for turnips.
C)an increase in income increases the demand for turnips.
D)turnips violate the law of demand.
E)turnips are a low quality good.
A)an increase in the price of a turnip decreases the quantity of turnips that consumers want to buy.
B)an increase in income decreases the demand for turnips.
C)an increase in income increases the demand for turnips.
D)turnips violate the law of demand.
E)turnips are a low quality good.
Unlock Deck
Unlock for access to all 178 flashcards in this deck.
Unlock Deck
k this deck
27
The price of good A rises,and the demand curve for good B shifts leftward.We can conclude that
A)A and B are substitutes.
B)A and B are complements.
C)A and B are complements in production.
D)B is an inferior good.
E)B is a normal good.
A)A and B are substitutes.
B)A and B are complements.
C)A and B are complements in production.
D)B is an inferior good.
E)B is a normal good.
Unlock Deck
Unlock for access to all 178 flashcards in this deck.
Unlock Deck
k this deck
28
If a turnip is an inferior good,then,ceteris paribus,an increase in the price of a turnip will
A)decrease the demand for turnips.
B)increase the demand for turnips.
C)decrease the supply of turnips.
D)increase the supply of turnips.
E)none of the above.
A)decrease the demand for turnips.
B)increase the demand for turnips.
C)decrease the supply of turnips.
D)increase the supply of turnips.
E)none of the above.
Unlock Deck
Unlock for access to all 178 flashcards in this deck.
Unlock Deck
k this deck
29
Which one of the following would result in a movement from point A to point B in Figure 3.2.1?
A)a fall in the price of apples
B)a rise in the price of oranges
C)an increase in population size
D)public concern about chemicals sprayed on apples
E)a rise in the price of bananas
A)a fall in the price of apples
B)a rise in the price of oranges
C)an increase in population size
D)public concern about chemicals sprayed on apples
E)a rise in the price of bananas
Unlock Deck
Unlock for access to all 178 flashcards in this deck.
Unlock Deck
k this deck
30
Which one of the following statements best characterizes point B in Figure 3.2.1?
A)Producers would be unwilling to sell the 9,000th apple for less than $0.50.
B)The most that consumers would be willing to pay for the 9,000th apple is $0.50.
C)At a price of $0.50,consumers will be unwilling to buy any apples.
D)At a price of $0.50,there will be an apple shortage.
E)At point B,the market is in equilibrium.
Unlock Deck
Unlock for access to all 178 flashcards in this deck.
Unlock Deck
k this deck
31
The price of good X falls and the demand for good Y decreases.We can conclude that
A)X and Y are complements.
B)X and Y are independent of each other.
C)X is an inferior good.
D)X is a normal good.
E)X and Y are substitutes.
A)X and Y are complements.
B)X and Y are independent of each other.
C)X is an inferior good.
D)X is a normal good.
E)X and Y are substitutes.
Unlock Deck
Unlock for access to all 178 flashcards in this deck.
Unlock Deck
k this deck
32
Some sales managers are talking shop.Which one of the following quotations refers to a leftward shift of the demand curve?
A)"Since our competitors raised their prices,our sales have doubled."
B)"It has been an unusually mild winter;our sales of wool scarves are down from last year."
C)"We decided to cut our prices,and the increase in our sales has been remarkable."
D)"The Green movement has sparked an increase in our sales of biodegradable products."
E)None of the above.
Unlock Deck
Unlock for access to all 178 flashcards in this deck.
Unlock Deck
k this deck
33
Given Figure 3.2.1,under what condition are consumers willing to buy more than 9,000 apples per week?
A)if the price is above $1
B)if the price is between $1 and $0.50
C)if the price is below $0.50
D)if the price is between $1 and $1.50
E)if the price is $0.75
A)if the price is above $1
B)if the price is between $1 and $0.50
C)if the price is below $0.50
D)if the price is between $1 and $1.50
E)if the price is $0.75
Unlock Deck
Unlock for access to all 178 flashcards in this deck.
Unlock Deck
k this deck
34
Which one of the following would lead to an increase in the demand for hamburgers?
A)a new fad hamburger diet
B)a decrease in population size
C)a rise in the price of French fries,a complement of hamburgers
D)a decrease in consumer income if hamburgers are a normal good
E)a news report that hamburgers can cause skin diseases
A)a new fad hamburger diet
B)a decrease in population size
C)a rise in the price of French fries,a complement of hamburgers
D)a decrease in consumer income if hamburgers are a normal good
E)a news report that hamburgers can cause skin diseases
Unlock Deck
Unlock for access to all 178 flashcards in this deck.
Unlock Deck
k this deck
35
Suppose income increases.Choose the correct statement.
A)The equilibrium price of turnips falls if a turnip is an inferior good.
B)The equilibrium price of turnips rises if a turnip is an inferior good.
C)The equilibrium quantity of turnips decreases if a turnip is an inferior good.
D)The supply of turnips decreases whether or not a turnip is an inferior good.
E)Both A and C.
Unlock Deck
Unlock for access to all 178 flashcards in this deck.
Unlock Deck
k this deck
36
Which of the following "other things" are not held constant along a demand curve?
A)income
B)prices of related goods
C)the price of the good itself
D)preferences
E)expected future income and credit
A)income
B)prices of related goods
C)the price of the good itself
D)preferences
E)expected future income and credit
Unlock Deck
Unlock for access to all 178 flashcards in this deck.
Unlock Deck
k this deck
37
An increase in income
A)increases the demand for turnips if a turnip is an inferior good.
B)increases the demand for turnips if a turnip is a normal good.
C)increases the supply of turnips.
D)decreases the demand for turnips if turnips have a very low price.
E)decreases the supply of turnips.
A)increases the demand for turnips if a turnip is an inferior good.
B)increases the demand for turnips if a turnip is a normal good.
C)increases the supply of turnips.
D)decreases the demand for turnips if turnips have a very low price.
E)decreases the supply of turnips.
Unlock Deck
Unlock for access to all 178 flashcards in this deck.
Unlock Deck
k this deck
38
Use the figure below to answer the following questions.
Figure 3.2.2
Refer to Figure 3.2.2.Which one of the following represents a decrease in quantity demanded?
A)a shift from D1 to D2
B)a shift from D2 to D1
C)a movement from A to B
D)a movement from B to A
E)none of the above
Figure 3.2.2Refer to Figure 3.2.2.Which one of the following represents a decrease in quantity demanded?
A)a shift from D1 to D2
B)a shift from D2 to D1
C)a movement from A to B
D)a movement from B to A
E)none of the above
Unlock Deck
Unlock for access to all 178 flashcards in this deck.
Unlock Deck
k this deck
39
Some sales managers are talking shop.Which one of the following quotations refers to a rightward shift of the demand curve?
A)"Since our competitors raised their prices,our sales have doubled."
B)"It has been an unusually harsh winter;our sales of wool scarves are up from last year."
C)"We decided to cut our prices,and the increase in our sales has been remarkable."
D)"The Green movement has sparked an increase in our sales of biodegradable products."
E)All of the above except C.
Unlock Deck
Unlock for access to all 178 flashcards in this deck.
Unlock Deck
k this deck
40
Some sales managers are talking shop.Which of the following quotations refers to a movement along the demand curve?
A)"Since our competitors raised their prices,our sales have doubled."
B)"It has been an unusually mild winter;our sales of wool scarves are down from last year."
C)"We decided to cut our prices,and the increase in our sales has been remarkable."
D)"The Green movement has sparked an increase in our sales of biodegradable products."
E)None of the above.
Unlock Deck
Unlock for access to all 178 flashcards in this deck.
Unlock Deck
k this deck
41
An increase in supply is shown by
A)a movement down along the supply curve.
B)a movement up along the supply curve.
C)a rightward shift of the supply curve.
D)a leftward shift of the supply curve.
E)an initial movement up and then down along the same supply curve.
A)a movement down along the supply curve.
B)a movement up along the supply curve.
C)a rightward shift of the supply curve.
D)a leftward shift of the supply curve.
E)an initial movement up and then down along the same supply curve.
Unlock Deck
Unlock for access to all 178 flashcards in this deck.
Unlock Deck
k this deck
42
Some producers are chatting over a beer.Which one of the following quotations refers to a rightward shift of the supply curve?
A)"Wage increases have forced us to raise our prices."
B)"Our new,sophisticated equipment will enable us to undercut our competitors."
C)"Raw material prices have sky-rocketed;we will have to pass the cost on to our customers."
D)"We anticipate a big increase in demand.Our product price should rise,so we are planning for an increase in output."
E)Both A and C.
Unlock Deck
Unlock for access to all 178 flashcards in this deck.
Unlock Deck
k this deck
43
Which one of the following would not shift the supply curve of good X to the right?
A)a fall in the price of the factors of production used in producing X
B)an improvement in technology used in the production of X
C)a rise in the price of X
D)an increase in the price of Y,a complement in production of X
E)a fall in the price of Y,a substitute in production of X
A)a fall in the price of the factors of production used in producing X
B)an improvement in technology used in the production of X
C)a rise in the price of X
D)an increase in the price of Y,a complement in production of X
E)a fall in the price of Y,a substitute in production of X
Unlock Deck
Unlock for access to all 178 flashcards in this deck.
Unlock Deck
k this deck
44
People buy more of good 1 when the price of good 2 rises.Good 1 and good 2 are
A)complements.
B)substitutes.
C)normal goods.
D)inferior goods.
E)substitutes in production
A)complements.
B)substitutes.
C)normal goods.
D)inferior goods.
E)substitutes in production
Unlock Deck
Unlock for access to all 178 flashcards in this deck.
Unlock Deck
k this deck
45
The supply curve of a good slopes upward to the right because of
A)technological improvements over time.
B)the law of supply.
C)the law of demand.
D)the existence of substitutes in production.
E)the fact that prices tend to rise over time.
A)technological improvements over time.
B)the law of supply.
C)the law of demand.
D)the existence of substitutes in production.
E)the fact that prices tend to rise over time.
Unlock Deck
Unlock for access to all 178 flashcards in this deck.
Unlock Deck
k this deck
46
If a factor of production can be used to produce either good A or good B,then A and B are
A)substitutes in production.
B)complements in production.
C)substitutes.
D)complements.
E)normal goods.
A)substitutes in production.
B)complements in production.
C)substitutes.
D)complements.
E)normal goods.
Unlock Deck
Unlock for access to all 178 flashcards in this deck.
Unlock Deck
k this deck
47
If a producer can use its factors of production to produce either good A or good B,then a rise in the price of A
A)increases the supply of B.
B)decreases the supply of A.
C)increases the supply of A.
D)decreases the supply of B.
E)both C and D.
A)increases the supply of B.
B)decreases the supply of A.
C)increases the supply of A.
D)decreases the supply of B.
E)both C and D.
Unlock Deck
Unlock for access to all 178 flashcards in this deck.
Unlock Deck
k this deck
48
Which one of the following will shift the supply curve of good X leftward?
A)a decrease in the wages of workers employed to produce X
B)an increase in the cost of machinery used to produce X
C)a technological improvement in the production of X
D)a situation where quantity demanded exceeds quantity supplied
E)a decrease in the cost of capital used to produce X
A)a decrease in the wages of workers employed to produce X
B)an increase in the cost of machinery used to produce X
C)a technological improvement in the production of X
D)a situation where quantity demanded exceeds quantity supplied
E)a decrease in the cost of capital used to produce X
Unlock Deck
Unlock for access to all 178 flashcards in this deck.
Unlock Deck
k this deck
49
A decrease in the quantity supplied is shown by a
A)movement down along the supply curve.
B)movement up along the supply curve.
C)rightward shift of the supply curve.
D)leftward shift of the supply curve.
E)rightward shift of the demand curve.
A)movement down along the supply curve.
B)movement up along the supply curve.
C)rightward shift of the supply curve.
D)leftward shift of the supply curve.
E)rightward shift of the demand curve.
Unlock Deck
Unlock for access to all 178 flashcards in this deck.
Unlock Deck
k this deck
50
A rise in the price of a good
A)decreases demand for the good.
B)creates a movement up along the supply curve.
C)creates a movement down along the demand curve.
D)increases the supply of the good.
E)increases preferences for the good.
A)decreases demand for the good.
B)creates a movement up along the supply curve.
C)creates a movement down along the demand curve.
D)increases the supply of the good.
E)increases preferences for the good.
Unlock Deck
Unlock for access to all 178 flashcards in this deck.
Unlock Deck
k this deck
51
The law of supply tells us that other things remaining the same,as the
A)price of gasoline falls,the quantity of gasoline supplied decreases.
B)price of gasoline rises,the quantity of gasoline supplied decreases.
C)supply of gasoline increases,the price of gasoline falls.
D)cost of producing gasoline falls,the supply of gasoline will increase.
E)cost of producing gasoline increases,the price of gasoline rises.
Unlock Deck
Unlock for access to all 178 flashcards in this deck.
Unlock Deck
k this deck
52
Oatmeal is a normal good and cold cereal is a substitute for oatmeal.Raisins are a complement of oatmeal.Which of the following increases the demand for oatmeal?
A)an increase in the price of raisins
B)a decrease in income
C)a decrease in population
D)an increase in the price of cold cereal
E)an increase in the supply of oatmeal
A)an increase in the price of raisins
B)a decrease in income
C)a decrease in population
D)an increase in the price of cold cereal
E)an increase in the supply of oatmeal
Unlock Deck
Unlock for access to all 178 flashcards in this deck.
Unlock Deck
k this deck
53
A shift of the supply curve for rutabagas occurs if there is
A)a change in preferences for rutabagas.
B)a change in the price of a related good that is a substitute for rutabagas.
C)a change in income.
D)a change in the price of rutabagas.
E)none of the above.
A)a change in preferences for rutabagas.
B)a change in the price of a related good that is a substitute for rutabagas.
C)a change in income.
D)a change in the price of rutabagas.
E)none of the above.
Unlock Deck
Unlock for access to all 178 flashcards in this deck.
Unlock Deck
k this deck
54
The fact that a fall in the price of a good results in a decrease in the quantity of the good supplied illustrates
A)the law of supply.
B)the law of demand.
C)a change in supply.
D)the nature of an inferior good.
E)technological improvement.
A)the law of supply.
B)the law of demand.
C)a change in supply.
D)the nature of an inferior good.
E)technological improvement.
Unlock Deck
Unlock for access to all 178 flashcards in this deck.
Unlock Deck
k this deck
55
If goods X and Y are substitutes in production,then a rise in the price of good X
A)increases the demand for good Y.
B)decreases the demand for good Y.
C)increases the supply of good Y.
D)decreases the supply of good Y.
E)might change the supply of Y;it depends on whether X and Y are also substitutes.
A)increases the demand for good Y.
B)decreases the demand for good Y.
C)increases the supply of good Y.
D)decreases the supply of good Y.
E)might change the supply of Y;it depends on whether X and Y are also substitutes.
Unlock Deck
Unlock for access to all 178 flashcards in this deck.
Unlock Deck
k this deck
56
Which of the following will shift the supply curve of good X rightward?
A)a decrease in the wages of workers employed to produce good X
B)an increase in the cost of capital used to produce good X
C)an increase in the price of energy
D)a decrease in the number of suppliers of good X
E)the price of Y,a substitute in production for good X,rises
A)a decrease in the wages of workers employed to produce good X
B)an increase in the cost of capital used to produce good X
C)an increase in the price of energy
D)a decrease in the number of suppliers of good X
E)the price of Y,a substitute in production for good X,rises
Unlock Deck
Unlock for access to all 178 flashcards in this deck.
Unlock Deck
k this deck
57
Some producers are chatting over a beer.Which one of the following quotations refers to a movement along the supply curve?
A)"Wage increases have forced us to raise our prices."
B)"Our new,sophisticated equipment will enable us to undercut our competitors."
C)"Raw material prices have sky-rocketed;we will have to pass the cost on to our customers."
D)"We anticipate a big increase in demand.Our product price should rise,so we are planning for an increase in output."
E)"New competitors in the industry are causing prices to fall."
Unlock Deck
Unlock for access to all 178 flashcards in this deck.
Unlock Deck
k this deck
58
If Hamburger Helper is an inferior good,then,ceteris paribus,a decrease in income will lead to
A)a leftward shift of the demand curve for Hamburger Helper.
B)a rightward shift of the demand curve for Hamburger Helper.
C)a movement up along the demand curve for Hamburger Helper.
D)a movement down along the demand curve for Hamburger Helper.
E)an initial movement up and then down along the demand curve for Hamburger Helper.
Unlock Deck
Unlock for access to all 178 flashcards in this deck.
Unlock Deck
k this deck
59
Consider the market for cell phones.Suppose the price of a cell phone falls.Explain the effect of this event on the quantity of cell phones demanded and on the demand for cell phones.
A)The quantity of cell phones demanded is unchanged and the demand for cell phones increases.
B)The quantity of cell phones demanded decreases and the demand for cell phones is unchanged.
C)The quantity of cell phones demanded increases and the demand for cell phones is unchanged.
D)The quantity of cell phones demanded increases and the demand for cell phones also increases.
E)The quantity of cell phones demanded is unchanged and the demand for cell phones decreases.
Unlock Deck
Unlock for access to all 178 flashcards in this deck.
Unlock Deck
k this deck
60
If the number of suppliers of good Y increases,then
A)a movement up along the supply curve of good Y will occur.
B)a movement down along the supply curve of good Y will occur.
C)the supply curve of good Y shifts rightward.
D)the supply curve of good Y shifts leftward.
E)the supply curve of good Y will remain unchanged.
A)a movement up along the supply curve of good Y will occur.
B)a movement down along the supply curve of good Y will occur.
C)the supply curve of good Y shifts rightward.
D)the supply curve of good Y shifts leftward.
E)the supply curve of good Y will remain unchanged.
Unlock Deck
Unlock for access to all 178 flashcards in this deck.
Unlock Deck
k this deck
61
A decrease in the quantity supplied of a good is shown by
A)a movement down along the supply curve.
B)a leftward shift of the supply curve.
C)a movement up along the supply curve.
D)a rightward shift of the supply curve.
E)an initial rightward shift and then leftward shift of the supply curve.
A)a movement down along the supply curve.
B)a leftward shift of the supply curve.
C)a movement up along the supply curve.
D)a rightward shift of the supply curve.
E)an initial rightward shift and then leftward shift of the supply curve.
Unlock Deck
Unlock for access to all 178 flashcards in this deck.
Unlock Deck
k this deck
62
Use the table below to answer the following questions.
Table 3.4.1
-In Table 3.4.1,the equilibrium price is
A)$7 a unit.
B)$5 a unit.
C)$4 a unit.
D)$3 a unit.
E)$1 a unit.
Table 3.4.1
-In Table 3.4.1,the equilibrium price is
A)$7 a unit.
B)$5 a unit.
C)$4 a unit.
D)$3 a unit.
E)$1 a unit.
Unlock Deck
Unlock for access to all 178 flashcards in this deck.
Unlock Deck
k this deck
63
Use the figure below to answer the following questions.
Figure 3.4.1
At price P2 in Figure 3.4.1,which one of the following is not true?
A)This market is in equilibrium.
B)The quantity demanded is equal to the quantity supplied.
C)The quantity demanded is Q1.
D)There is no surplus.
E)The quantity supplied is Q3.
Figure 3.4.1At price P2 in Figure 3.4.1,which one of the following is not true?
A)This market is in equilibrium.
B)The quantity demanded is equal to the quantity supplied.
C)The quantity demanded is Q1.
D)There is no surplus.
E)The quantity supplied is Q3.
Unlock Deck
Unlock for access to all 178 flashcards in this deck.
Unlock Deck
k this deck
64
Use the figure below to answer the following questions.
Figure 3.4.1
At price P1 in Figure 3.4.1,
A)producers can sell all they plan to sell.
B)consumers can buy all they want.
C)producers are unwilling to sell any goods.
D)a surplus exists.
E)both sides of the market are able to carry out their desired transactions.
Figure 3.4.1At price P1 in Figure 3.4.1,
A)producers can sell all they plan to sell.
B)consumers can buy all they want.
C)producers are unwilling to sell any goods.
D)a surplus exists.
E)both sides of the market are able to carry out their desired transactions.
Unlock Deck
Unlock for access to all 178 flashcards in this deck.
Unlock Deck
k this deck
65
Use the table below to answer the following questions.
Table 3.4.1
-Refer to Table 3.4.1.The equilibrium quantity is 420 units if
A)the price is fixed at $3 a unit.
B)the price is fixed at $4 a unit.
C)the price is fixed at $5 a unit.
D)both A and C are correct.
E)none of the above.
Table 3.4.1
-Refer to Table 3.4.1.The equilibrium quantity is 420 units if
A)the price is fixed at $3 a unit.
B)the price is fixed at $4 a unit.
C)the price is fixed at $5 a unit.
D)both A and C are correct.
E)none of the above.
Unlock Deck
Unlock for access to all 178 flashcards in this deck.
Unlock Deck
k this deck
66
Use the table below to answer the following questions.
Table 3.4.1
-Refer to Table 3.4.1.If the price is $3,then the shortage is
A)zero units.
B)1,050 units.
C)180 units.
D)600 units.
E)160 units.
Table 3.4.1
-Refer to Table 3.4.1.If the price is $3,then the shortage is
A)zero units.
B)1,050 units.
C)180 units.
D)600 units.
E)160 units.
Unlock Deck
Unlock for access to all 178 flashcards in this deck.
Unlock Deck
k this deck
67
Which of the following shifts the supply curve for good X leftward?
A)a situation in which the quantity demanded of X exceeds the quantity supplied of X
B)an increase in the cost of the machinery used to produce X
C)a technological advance in the production of X
D)a decrease in the wages of workers employed to produce X
E)a situation in which the quantity supplied of X exceeds the quantity demanded of X
Unlock Deck
Unlock for access to all 178 flashcards in this deck.
Unlock Deck
k this deck
68
Use the figure below to answer the following questions.
Figure 3.4.1
At price P1 in Figure 3.4.1
A)there is a surplus in the amount of Q4 - Q2.
B)there is a shortage in the amount of Q4 - Q2.
C)there is a tendency for the price to fall.
D)the equilibrium quantity is Q2.
E)the equilibrium quantity is Q4.
Figure 3.4.1At price P1 in Figure 3.4.1
A)there is a surplus in the amount of Q4 - Q2.
B)there is a shortage in the amount of Q4 - Q2.
C)there is a tendency for the price to fall.
D)the equilibrium quantity is Q2.
E)the equilibrium quantity is Q4.
Unlock Deck
Unlock for access to all 178 flashcards in this deck.
Unlock Deck
k this deck
69
Some producers are chatting over a beer.Which one of the following quotations refers to a leftward shift of the supply curve?
A)"Wage increases have forced us to raise our prices."
B)"Our new,sophisticated equipment will enable us to undercut our competitors."
C)"Raw material prices have sky-rocketed;we will have to pass the cost on to our customers."
D)"We anticipate a big increase in demand.Our product price should rise,so we are planning for an increase in output."
E)Both A and C.
Unlock Deck
Unlock for access to all 178 flashcards in this deck.
Unlock Deck
k this deck
70
Use the figure below to answer the following questions.
Figure 3.4.2
The equilibrium price in the market illustrated by Figure 3.4.2 is
A)$2 a unit.
B)$4 a unit.
C)$6 a unit.
D)$8 a unit.
E)$10 a unit.
Figure 3.4.2The equilibrium price in the market illustrated by Figure 3.4.2 is
A)$2 a unit.
B)$4 a unit.
C)$6 a unit.
D)$8 a unit.
E)$10 a unit.
Unlock Deck
Unlock for access to all 178 flashcards in this deck.
Unlock Deck
k this deck
71
Use the table below to answer the following questions.
Table 3.4.1
-Refer to Table 3.4.1.If the price is $7,then the surplus is
A)360 units.
B)400 units.
C)160 units.
D)zero units.
E)290 units.
Table 3.4.1
-Refer to Table 3.4.1.If the price is $7,then the surplus is
A)360 units.
B)400 units.
C)160 units.
D)zero units.
E)290 units.
Unlock Deck
Unlock for access to all 178 flashcards in this deck.
Unlock Deck
k this deck
72
Use the figure below to answer the following questions.
Figure 3.4.1
At price P3 in Figure 3.4.1,
A)this market is in equilibrium.
B)there is a shortage in the amount of Q5 - Q1.
C)there is a tendency for the price to rise.
D)equilibrium quantity is Q5.
E)there is a surplus in the amount of Q5 - Q1.
Figure 3.4.1At price P3 in Figure 3.4.1,
A)this market is in equilibrium.
B)there is a shortage in the amount of Q5 - Q1.
C)there is a tendency for the price to rise.
D)equilibrium quantity is Q5.
E)there is a surplus in the amount of Q5 - Q1.
Unlock Deck
Unlock for access to all 178 flashcards in this deck.
Unlock Deck
k this deck
73
Use the table below to answer the following questions.
Table 3.4.1
-In Table 3.4.1,the equilibrium quantity is
A)200 units.
B)320 units.
C)420 units.
D)500 units.
E)none of the above;there is no equilibrium.
Table 3.4.1
-In Table 3.4.1,the equilibrium quantity is
A)200 units.
B)320 units.
C)420 units.
D)500 units.
E)none of the above;there is no equilibrium.
Unlock Deck
Unlock for access to all 178 flashcards in this deck.
Unlock Deck
k this deck
74
Which of the following decreases the supply of popcorn?
A)a decrease in the price of popcorn
B)an increase in the price of popcorn
C)a technological advance in the production of popcorn
D)a decrease in the demand for popcorn
E)a decrease in the number of popcorn producers
A)a decrease in the price of popcorn
B)an increase in the price of popcorn
C)a technological advance in the production of popcorn
D)a decrease in the demand for popcorn
E)a decrease in the number of popcorn producers
Unlock Deck
Unlock for access to all 178 flashcards in this deck.
Unlock Deck
k this deck
75
Use the table below to answer the following questions.
Table 3.4.1
-Refer to Table 3.4.1.A surplus occurs if
A)the price is $2 a unit.
B)the price is $3 a unit.
C)the price is above $4 a unit.
D)the price is $1 a unit.
E)the price is $4 a unit.
Table 3.4.1
-Refer to Table 3.4.1.A surplus occurs if
A)the price is $2 a unit.
B)the price is $3 a unit.
C)the price is above $4 a unit.
D)the price is $1 a unit.
E)the price is $4 a unit.
Unlock Deck
Unlock for access to all 178 flashcards in this deck.
Unlock Deck
k this deck
76
At a price of $4 a unit in Figure 3.4.2
A)the equilibrium quantity is 400 units.
B)there is a surplus of 200 units.
C)the quantity supplied is 400 units.
D)there is a shortage of 200 units.
E)the quantity demanded is 200 units.
A)the equilibrium quantity is 400 units.
B)there is a surplus of 200 units.
C)the quantity supplied is 400 units.
D)there is a shortage of 200 units.
E)the quantity demanded is 200 units.
Unlock Deck
Unlock for access to all 178 flashcards in this deck.
Unlock Deck
k this deck
77
At a price of $10 a unit in Figure 3.4.2
A)there is a surplus of 200 units.
B)there is a shortage of 200 units.
C)there is a surplus of 400 units.
D)there is a shortage of 400 units.
E)quantity will rise.
A)there is a surplus of 200 units.
B)there is a shortage of 200 units.
C)there is a surplus of 400 units.
D)there is a shortage of 400 units.
E)quantity will rise.
Unlock Deck
Unlock for access to all 178 flashcards in this deck.
Unlock Deck
k this deck
78
Use the table below to answer the following questions.
Table 3.4.1
-Refer to Table 3.4.1.At a price of $3 a unit
A)the market is in equilibrium.
B)there is a 180-unit surplus.
C)there is a 180-unit shortage.
D)there is a tendency for the price to rise.
E)C and D.
Table 3.4.1
-Refer to Table 3.4.1.At a price of $3 a unit
A)the market is in equilibrium.
B)there is a 180-unit surplus.
C)there is a 180-unit shortage.
D)there is a tendency for the price to rise.
E)C and D.
Unlock Deck
Unlock for access to all 178 flashcards in this deck.
Unlock Deck
k this deck
79
Use the table below to answer the following questions.
Table 3.4.1
-Refer to Table 3.4.1.A shortage occurs if
A)the price is $7 a unit.
B)the price is $4 a unit.
C)the price is $5 a unit.
D)the price is below $4 a unit.
E)the price is $6 a unit.
Table 3.4.1
-Refer to Table 3.4.1.A shortage occurs if
A)the price is $7 a unit.
B)the price is $4 a unit.
C)the price is $5 a unit.
D)the price is below $4 a unit.
E)the price is $6 a unit.
Unlock Deck
Unlock for access to all 178 flashcards in this deck.
Unlock Deck
k this deck
80
Use the figure below to answer the following questions.
Figure 3.4.2
Refer to Figure 3.4.2.When the price is $10 a unit
A)consumers will buy only 100 units of output.
B)consumers will buy 500 units of output.
C)consumers will buy nothing.
D)a shortage occurs.
E)the surplus is zero.
Figure 3.4.2Refer to Figure 3.4.2.When the price is $10 a unit
A)consumers will buy only 100 units of output.
B)consumers will buy 500 units of output.
C)consumers will buy nothing.
D)a shortage occurs.
E)the surplus is zero.
Unlock Deck
Unlock for access to all 178 flashcards in this deck.
Unlock Deck
k this deck
Unlock Deck
Unlock for access to all 178 flashcards in this deck.


