Deck 18: Community Structure
Full screen (f)
Question
Question
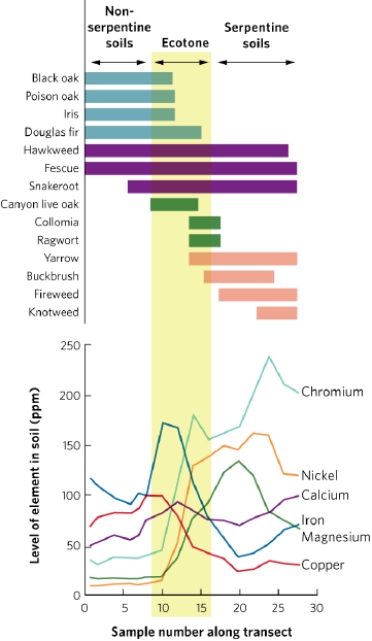 Which species is restricted to serpentine soils?
A) black oak
B) hawkweed
C) ragwort
D) fireweed
Question
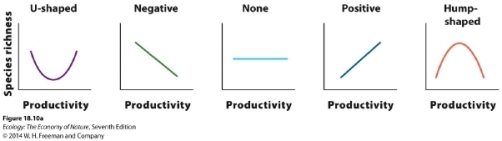 What would be the most likely species richness-productivity relationship for a community in which the species were not resource limited?
A) U-shaped
B) negative
C) none
D) positive
E) hump-shaped
Question
Question
Question
 Which species is restricted to nonserpentine soils?
A) black oak
B) hawkweed
C) ragwort
D) fireweed
Question
 Which species is restricted to the ecotone between serpentine and nonserpentine soils?
A) black oak
B) hawkweed
C) ragwort
D) fireweed
Question
Question
Question
Question
Question
 Which species would you characterize as seemingly unresponsive to changes in soil conditions across the transect?
A) black oak
B) hawkweed
C) ragwort
D) fireweed
Question
Question
Question
 What species richness-productivity relationship has the Park Grass Experiment in England demonstrated over the past 150 years?
A) U-shaped
B) negative
C) none
D) positive
E) hump-shaped
Question
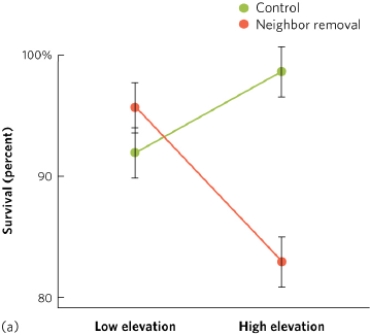 The graph suggests that
A) plant survival rate is not affected by elevation.
B) plant survival rate is not affected by the presence or absence of a neighboring species.
C) plant survival is dependent on the presence of a neighboring species.
D) plant survival is independent of the presence of a neighboring species.
Question
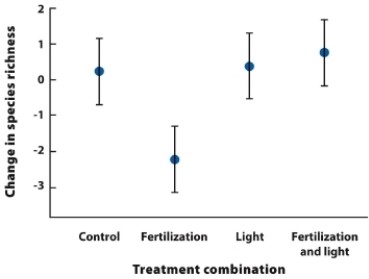 According to the experimental results shown in the figure, what factor best explains the reduction in plant species richness with addition of fertilizer?
A) inhibition of photosynthesis
B) intolerance to fertilizer
C) competition for light
D) interaction of fertilizer and light
Question
Question
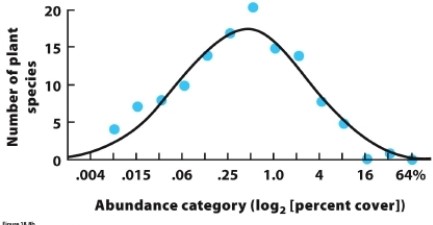 The plot shows that most species in this community are
A) moderately abundant.
B) very rare.
C) very abundant.
D) about evenly distributed.
Question
Using the figure that follows, compare species richness and evenness. 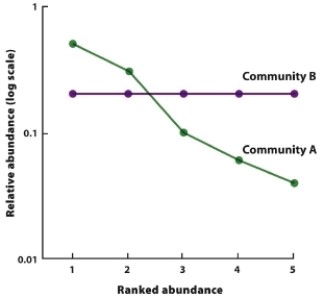
Question
Question
Question
Question
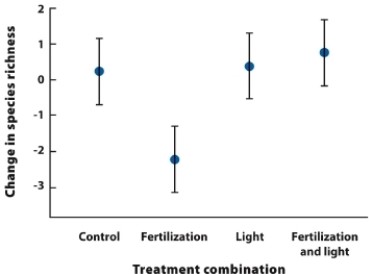 What is a reasonable explanation of the results in the figure?
A) The plants are light limited.
B) Plants that competed more successfully with additional fertilizer shaded out other plants.
C) Plant growth is best supported by addition of fertilizer and light.
D) Addition of fertilizer reduces plants' ability to use light efficiently for photosynthesis.
Question
Question
Question
Question
Question
Question
Question
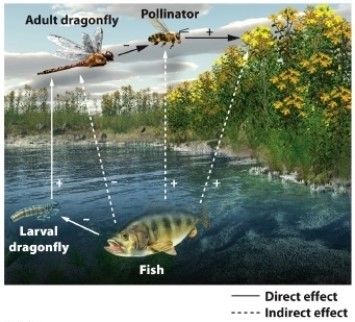 The presence of fish has a positive effect on shoreline flowering plants. Which lines in the diagram reflect a negative direct effect?
A) fish adult dragonfly
B) fish pollinator
C) fish larval dragonfly
D) adult dragonfly plants
Question
Question
Question
Question
Question
Question
Question
Question
Question
Question
Question
Question
Question
Question
Question
Question
Question
Question
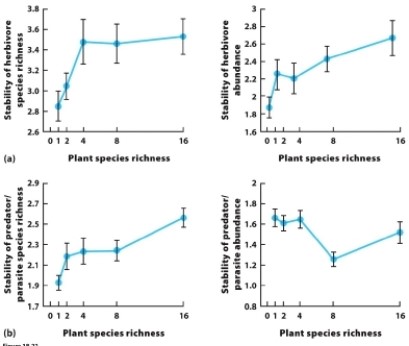 Which response variable (on the y axis) did NOT increase with plant species richness?
A) stability of herbivore species richness
B) stability of herbivore abundance
C) stability of predator and parasite species richness
D) stability of predator and parasite abundance
Question
Question
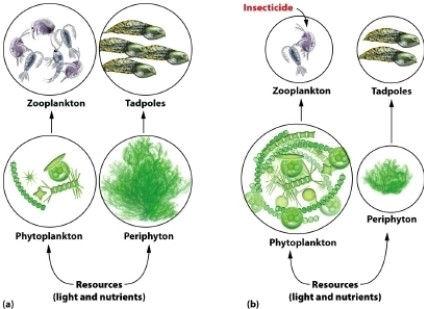 Which of the following statements would NOT be true about the species relationship in the figure?
A) Zooplankton consume phytoplankton.
B) Zooplankton consume periphyton.
C) Tadpoles consume periphyton.
D) Tadpole abundance is related to the abundance of its food resource.
Question
Question
Question
Question
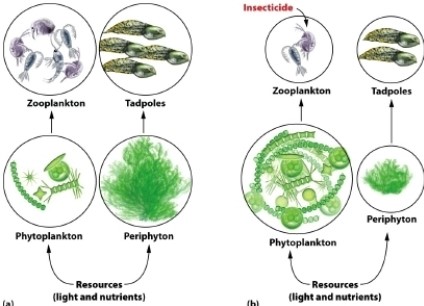 What organisms in the figure appear NOT to be indirectly affected by insecticide?
A) zooplankton
B) tadpoles
C) phytoplankton
D) periphyton
Question
Question
Question
Question
Question
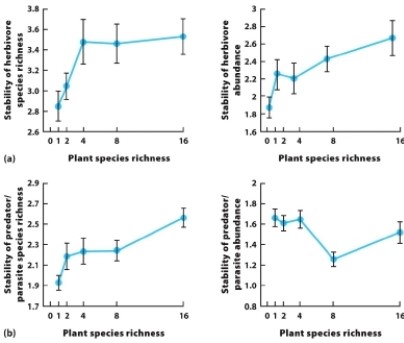 What do the data in the graphs suggest about the resistance of the community to disturbance?
A) Communities with any amount of plants are very resistant to disturbance.
B) Community resistance depends on whether herbivores, predators, and parasites are present.
C) Herbivore species richness and abundance both increase with small changes in plant species richness.
D) The stability of herbivore species richness and abundance responds independently of plant species richness.
Question
Question
Question
Question
Question
Question

Unlock Deck
Sign up to unlock the cards in this deck!
Unlock Deck
Unlock Deck
1/66
Play
Full screen (f)
Deck 18: Community Structure
1
How would sampling the same community in the plot with much less effort affect the shape of the plot?
not answered
2
Which species is restricted to serpentine soils?A) black oak
B) hawkweed
C) ragwort
D) fireweed
D
3
What would be the most likely species richness-productivity relationship for a community in which the species were not resource limited?A) U-shaped
B) negative
C) none
D) positive
E) hump-shaped
B
4
Based on the data that follow, which of the following statements is FALSE?
A) The seagrass habitat has the lowest species richness.
B) The African plains and Australian grasslands have identical species richness.
C) The rank abundance curves for the African plains and Australian grasslands data would have the same shape.
D) The Australian grasslands have lower species evenness than the African plains.
E) The seagrass habitat has the highest species evenness.
Unlock Deck
Unlock for access to all 66 flashcards in this deck.
Unlock Deck
k this deck
5
What, in addition to tolerance to soil characteristics, might account for the distribution of plant species over different soil types?
Unlock Deck
Unlock for access to all 66 flashcards in this deck.
Unlock Deck
k this deck
6
Which species is restricted to nonserpentine soils?A) black oak
B) hawkweed
C) ragwort
D) fireweed
Unlock Deck
Unlock for access to all 66 flashcards in this deck.
Unlock Deck
k this deck
7
Which species is restricted to the ecotone between serpentine and nonserpentine soils?A) black oak
B) hawkweed
C) ragwort
D) fireweed
Unlock Deck
Unlock for access to all 66 flashcards in this deck.
Unlock Deck
k this deck
8
How can predation increase prey species richness and evenness in a community?
Unlock Deck
Unlock for access to all 66 flashcards in this deck.
Unlock Deck
k this deck
9
Communities with _____ species are _____ stable.
A) few; more
B) few; consistently
C) many; more
D) many; consistently
A) few; more
B) few; consistently
C) many; more
D) many; consistently
Unlock Deck
Unlock for access to all 66 flashcards in this deck.
Unlock Deck
k this deck
10
How would adding resources such as fertilizer to an area affect the species in a community?
A) It would reduce richness.
B) It would increase richness.
C) It would increase the abundance of all species.
D) It would reduce the abundance of all species.
A) It would reduce richness.
B) It would increase richness.
C) It would increase the abundance of all species.
D) It would reduce the abundance of all species.
Unlock Deck
Unlock for access to all 66 flashcards in this deck.
Unlock Deck
k this deck
11
Briefly describe an experiment to test whether species are independent or interdependent on each other for existence.
Unlock Deck
Unlock for access to all 66 flashcards in this deck.
Unlock Deck
k this deck
12
Which species would you characterize as seemingly unresponsive to changes in soil conditions across the transect?A) black oak
B) hawkweed
C) ragwort
D) fireweed
Unlock Deck
Unlock for access to all 66 flashcards in this deck.
Unlock Deck
k this deck
13
How does an ecologist determine the presence of an ecotone?
A) Measure the abundance of plant species over space and abrupt changes in species composition.
B) Perform controlled crosses among all plant species within a community to determine the extent to which the species are reproductively isolated.
C) Measure microclimate and soil variables for abrupt changes.
D) Measure elevation, since many environmental and ecological variables change with elevation.
Unlock Deck
Unlock for access to all 66 flashcards in this deck.
Unlock Deck
k this deck
14
What community measure does Shannon's index quantify?
A) the number of species
B) relative abundance of species
C) species richness
D) species diversity
A) the number of species
B) relative abundance of species
C) species richness
D) species diversity
Unlock Deck
Unlock for access to all 66 flashcards in this deck.
Unlock Deck
k this deck
15
What species richness-productivity relationship has the Park Grass Experiment in England demonstrated over the past 150 years?A) U-shaped
B) negative
C) none
D) positive
E) hump-shaped
Unlock Deck
Unlock for access to all 66 flashcards in this deck.
Unlock Deck
k this deck
16
The graph suggests thatA) plant survival rate is not affected by elevation.
B) plant survival rate is not affected by the presence or absence of a neighboring species.
C) plant survival is dependent on the presence of a neighboring species.
D) plant survival is independent of the presence of a neighboring species.
Unlock Deck
Unlock for access to all 66 flashcards in this deck.
Unlock Deck
k this deck
17
According to the experimental results shown in the figure, what factor best explains the reduction in plant species richness with addition of fertilizer?A) inhibition of photosynthesis
B) intolerance to fertilizer
C) competition for light
D) interaction of fertilizer and light
Unlock Deck
Unlock for access to all 66 flashcards in this deck.
Unlock Deck
k this deck
18
What particular type of environmental conditions favor independent or interdependent communities?
Unlock Deck
Unlock for access to all 66 flashcards in this deck.
Unlock Deck
k this deck
19
The plot shows that most species in this community areA) moderately abundant.
B) very rare.
C) very abundant.
D) about evenly distributed.
Unlock Deck
Unlock for access to all 66 flashcards in this deck.
Unlock Deck
k this deck
20
Using the figure that follows, compare species richness and evenness.
Unlock Deck
Unlock for access to all 66 flashcards in this deck.
Unlock Deck
k this deck
21
Which is an example of a trait-mediated indirect effect?
A) A predator causes a consumer to change its foraging pattern, affecting the amount of food consumed.
B) Predators consume most of their main prey, then switch to omnivory.
C) Herbivores migrate in and out of communities depending on perceived predation risk.
D) Herbivores consume vegetation, which reduces hiding places for predators stalking their prey.
Unlock Deck
Unlock for access to all 66 flashcards in this deck.
Unlock Deck
k this deck
22
Explain whether species would be limited more by resources or interspecific interactions in tropical rainforests (low latitude) or taiga (high latitude).
Unlock Deck
Unlock for access to all 66 flashcards in this deck.
Unlock Deck
k this deck
23
What most accurately describes a trophic cascade?
A) bottom-up effects
B) top-down effects
C) found in waterfall habitats
D) is based on two trophic levels
A) bottom-up effects
B) top-down effects
C) found in waterfall habitats
D) is based on two trophic levels
Unlock Deck
Unlock for access to all 66 flashcards in this deck.
Unlock Deck
k this deck
24
What is a reasonable explanation of the results in the figure?A) The plants are light limited.
B) Plants that competed more successfully with additional fertilizer shaded out other plants.
C) Plant growth is best supported by addition of fertilizer and light.
D) Addition of fertilizer reduces plants' ability to use light efficiently for photosynthesis.
Unlock Deck
Unlock for access to all 66 flashcards in this deck.
Unlock Deck
k this deck
25
What is a major distinction between direct and indirect effects in a community?
A) Indirect effects always include a resource such as water or light; direct effects do not.
B) Direct effects result in competitive exclusion; indirect effects do not.
C) Direct effects occur between species in different trophic levels; indirect effects include species from the same trophic level.
D) Indirect effects always include more than two species; direct effects do not.
Unlock Deck
Unlock for access to all 66 flashcards in this deck.
Unlock Deck
k this deck
26
Carbon dioxide with radioactive carbon was bubbled into an illuminated aquarium containing unfiltered pond water. In what order will radioactivity appear in various organisms in the aquarium?
A) herbivores, carnivores, producers
B) producers, herbivores, carnivores
C) producers, carnivores, herbivores
D) herbivores, producers, carnivores
E) All organisms will take up radioactive carbon simultaneously.
A) herbivores, carnivores, producers
B) producers, herbivores, carnivores
C) producers, carnivores, herbivores
D) herbivores, producers, carnivores
E) All organisms will take up radioactive carbon simultaneously.
Unlock Deck
Unlock for access to all 66 flashcards in this deck.
Unlock Deck
k this deck
27
Keystone species
A) have the most biomass in a community.
B) are usually top predators.
C) can affect community structure regardless of population size.
D) are invasive predator species that eat native herbivores.
A) have the most biomass in a community.
B) are usually top predators.
C) can affect community structure regardless of population size.
D) are invasive predator species that eat native herbivores.
Unlock Deck
Unlock for access to all 66 flashcards in this deck.
Unlock Deck
k this deck
28
Keystone species that are predators in a food web can increase species diversity by
A) increasing the biomass of primary producers.
B) removing competitive dominants.
C) creating an intermediate disturbance.
D) increasing production efficiency.
A) increasing the biomass of primary producers.
B) removing competitive dominants.
C) creating an intermediate disturbance.
D) increasing production efficiency.
Unlock Deck
Unlock for access to all 66 flashcards in this deck.
Unlock Deck
k this deck
29
What population trait allows a species to have high resilience to disturbance?
Unlock Deck
Unlock for access to all 66 flashcards in this deck.
Unlock Deck
k this deck
30
A researcher removed predatory starfish from sections of intertidal rock and found that the number of prey species decreased by 50 percent relative to control plots within a short time. This indicates that
A) predators compete with prey for space.
B) predator species are competing for prey.
C) starfish predation increases prey diversity.
D) starfish predation reduces prey diversity.
A) predators compete with prey for space.
B) predator species are competing for prey.
C) starfish predation increases prey diversity.
D) starfish predation reduces prey diversity.
Unlock Deck
Unlock for access to all 66 flashcards in this deck.
Unlock Deck
k this deck
31
The presence of fish has a positive effect on shoreline flowering plants. Which lines in the diagram reflect a negative direct effect?A) fish adult dragonfly
B) fish pollinator
C) fish larval dragonfly
D) adult dragonfly plants
Unlock Deck
Unlock for access to all 66 flashcards in this deck.
Unlock Deck
k this deck
32
Consider invertebrates such as starfish and mussels on a rocky intertidal habitat where tidal cycles cause the animals to move between exposure and submersion. Are these changing conditions considered a disturbance?
Unlock Deck
Unlock for access to all 66 flashcards in this deck.
Unlock Deck
k this deck
33
A trophic cascade is an example of _____ effect.
A) direct
B) indirect
A) direct
B) indirect
Unlock Deck
Unlock for access to all 66 flashcards in this deck.
Unlock Deck
k this deck
34
Explain what the intermediate disturbance hypothesis predicts for the comparison of species richness in forests where fires have been suppressed versus those with unsuppressed natural fire.
Unlock Deck
Unlock for access to all 66 flashcards in this deck.
Unlock Deck
k this deck
35
When Hairston, Smith, and Slobodkin suggested that Earth is green because carnivores depress the populations of herbivores that would otherwise consume most vegetation, they were focusing on _____ control of community structure.
A) top-down
B) bottom-up
A) top-down
B) bottom-up
Unlock Deck
Unlock for access to all 66 flashcards in this deck.
Unlock Deck
k this deck
36
Which is an example of an ecosystem engineer?
A) beavers, which build dams on streams
B) termites, which build very large hives and eat the wood in buildings
C) bees, which pollinate many types of flowers and crops
D) zebra mussels, which clog water intake structures
A) beavers, which build dams on streams
B) termites, which build very large hives and eat the wood in buildings
C) bees, which pollinate many types of flowers and crops
D) zebra mussels, which clog water intake structures
Unlock Deck
Unlock for access to all 66 flashcards in this deck.
Unlock Deck
k this deck
37
What is the relation between habitat diversity and species diversity?
A) decrease with altitude
B) hump shape
C) positive
D) negative if many invasive species are present
A) decrease with altitude
B) hump shape
C) positive
D) negative if many invasive species are present
Unlock Deck
Unlock for access to all 66 flashcards in this deck.
Unlock Deck
k this deck
38
You have been keeping a list of the bird species that frequent your property. At the end of the year you have tallied eight seedeaters, one nectar sipper, three woodpeckers, six insectivores, two frugivores, four predators, and one carrion feeder. You have organized your tally according to
A) habitat.
B) community.
C) population.
D) guild.
A) habitat.
B) community.
C) population.
D) guild.
Unlock Deck
Unlock for access to all 66 flashcards in this deck.
Unlock Deck
k this deck
39
Why are keystone species important in food webs?
Unlock Deck
Unlock for access to all 66 flashcards in this deck.
Unlock Deck
k this deck
40
Which of the following is NOT an example of a trait-mediated indirect effect?
A) The presence of raptors causes squirrels to forage at night instead of during the day.
B) Greater numbers of aspen trees grow in areas where predation risk from wolves prevents elk from browsing.
C) Grasses increase because the presence of spiders has reduced grasshopper foraging.
D) Zooplankton abundance in a pond increases because piscivorous largemouth bass cause small fish (zooplanktivores) to take refuge in pond margins away from zooplankton.
Unlock Deck
Unlock for access to all 66 flashcards in this deck.
Unlock Deck
k this deck
41
The dams that have been built on many rivers stabilize river flow by increasing flows below the dam during droughts and decreasing the amount of flooding during periods of high rainfall. Explain how these stabilized flows can be considered as a disturbance.
Unlock Deck
Unlock for access to all 66 flashcards in this deck.
Unlock Deck
k this deck
42
How can rainfall indirectly result in an alternative stable state in a community dominated by either grassland or forest?
Unlock Deck
Unlock for access to all 66 flashcards in this deck.
Unlock Deck
k this deck
43
Explain the difference between a trophic level and a guild with an example to illustrate the difference.
Unlock Deck
Unlock for access to all 66 flashcards in this deck.
Unlock Deck
k this deck
44
Explain how the second law of thermodynamics limits the number of trophic levels in a food web.
Unlock Deck
Unlock for access to all 66 flashcards in this deck.
Unlock Deck
k this deck
45
In hiking up a mountain you are likely to pass through various community types as you proceed from the low-elevation lands to the summit. This change in community is called
A) succession.
B) zonation.
C) trophic cascade.
D) bottom-up control.
A) succession.
B) zonation.
C) trophic cascade.
D) bottom-up control.
Unlock Deck
Unlock for access to all 66 flashcards in this deck.
Unlock Deck
k this deck
46
What can we learn about the roles of species in a community from food web structure alone?
Unlock Deck
Unlock for access to all 66 flashcards in this deck.
Unlock Deck
k this deck
47
How would a relatively high proportion of omnivore species in a food web affect the connectedness of the food web?
Unlock Deck
Unlock for access to all 66 flashcards in this deck.
Unlock Deck
k this deck
48
Describe the difference between what is referred to as a direct effect and an indirect effect of species in a food web.
Unlock Deck
Unlock for access to all 66 flashcards in this deck.
Unlock Deck
k this deck
49
Which response variable (on the y axis) did NOT increase with plant species richness?A) stability of herbivore species richness
B) stability of herbivore abundance
C) stability of predator and parasite species richness
D) stability of predator and parasite abundance
Unlock Deck
Unlock for access to all 66 flashcards in this deck.
Unlock Deck
k this deck
50
Explain the relationships that appear to reduce tadpole abundance when insecticide is present, even though insecticide does not directly affect tadpoles.
Unlock Deck
Unlock for access to all 66 flashcards in this deck.
Unlock Deck
k this deck
51
Which of the following statements would NOT be true about the species relationship in the figure?A) Zooplankton consume phytoplankton.
B) Zooplankton consume periphyton.
C) Tadpoles consume periphyton.
D) Tadpole abundance is related to the abundance of its food resource.
Unlock Deck
Unlock for access to all 66 flashcards in this deck.
Unlock Deck
k this deck
52
Which statement best reflects the relationship between a disturbance and an alternative stable state?
A) Many communities alternate between stable states on a seasonal basis, which is not a true disturbance.
B) A community may achieve an alternative stable state only after a major disturbance.
C) An alternative stable state will not happen in aquatic communities, where there is no fire and water is not limiting.
D) Communities can alternate among stable states in the absence of disturbance.
Unlock Deck
Unlock for access to all 66 flashcards in this deck.
Unlock Deck
k this deck
53
Hairston, Smith, and Slobodkin suggested that Earth is green because carnivores depress the populations of herbivores that would otherwise consume most vegetation. Is this the only possible explanation for the greenness of Earth?
Unlock Deck
Unlock for access to all 66 flashcards in this deck.
Unlock Deck
k this deck
54
Explain the shape of the intermediate disturbance hypothesis (IDH) graph. Why does it have the appearance that it does?
Unlock Deck
Unlock for access to all 66 flashcards in this deck.
Unlock Deck
k this deck
55
What organisms in the figure appear NOT to be indirectly affected by insecticide?A) zooplankton
B) tadpoles
C) phytoplankton
D) periphyton
Unlock Deck
Unlock for access to all 66 flashcards in this deck.
Unlock Deck
k this deck
56
Which would likely have very high resilience to disturbance?
A) soil microbes
B) redwood forest
C) desert vegetation
D) grassland
A) soil microbes
B) redwood forest
C) desert vegetation
D) grassland
Unlock Deck
Unlock for access to all 66 flashcards in this deck.
Unlock Deck
k this deck
57
What is the difference between a food chain and food web?
Unlock Deck
Unlock for access to all 66 flashcards in this deck.
Unlock Deck
k this deck
58
Which relationships in the figure indicate top-down control? Which relationships indicate bottom-up control?
Unlock Deck
Unlock for access to all 66 flashcards in this deck.
Unlock Deck
k this deck
59
What is the suggested mechanism by which the presence of insecticide influences phytoplankton abundance?
A) Periphyton abundance is reduced by insecticide.
B) Tadpoles consume phytoplankton when periphyton is reduced in abundance.
C) The reduction of zooplankton by insecticide reduces herbivory on phytoplankton, which increases abundance.
D) Inert chemicals in the insecticide include nitrogen, which promotes phytoplankton growth.
Unlock Deck
Unlock for access to all 66 flashcards in this deck.
Unlock Deck
k this deck
60
What do the data in the graphs suggest about the resistance of the community to disturbance?A) Communities with any amount of plants are very resistant to disturbance.
B) Community resistance depends on whether herbivores, predators, and parasites are present.
C) Herbivore species richness and abundance both increase with small changes in plant species richness.
D) The stability of herbivore species richness and abundance responds independently of plant species richness.
Unlock Deck
Unlock for access to all 66 flashcards in this deck.
Unlock Deck
k this deck
61
You are sampling a stream with a net, collecting 100 macroinvertebrates. You have been told the stream has high richness but low evenness. Which of the following collections would best represent the stream if what you were told is true (assume the different macroinvertebrate types noted are all the same species (e.g., 20 mayflies are all of the same species)?
A) 80 caddisflies, 20 mayflies
B) 60 caddisflies, 20 mayflies, 10 stoneflies, 5 damselflies, 4 dobsonflies, 1 cranefly
C) 60 caddisflies, 8 mayflies, 8 stoneflies, 8 damselflies, 8 dobsonflies, 8 cranefly
D) 60 caddisflies, 37 mayflies, 1 damselflies, 1 dobsonflies, 1cranefly
A) 80 caddisflies, 20 mayflies
B) 60 caddisflies, 20 mayflies, 10 stoneflies, 5 damselflies, 4 dobsonflies, 1 cranefly
C) 60 caddisflies, 8 mayflies, 8 stoneflies, 8 damselflies, 8 dobsonflies, 8 cranefly
D) 60 caddisflies, 37 mayflies, 1 damselflies, 1 dobsonflies, 1cranefly
Unlock Deck
Unlock for access to all 66 flashcards in this deck.
Unlock Deck
k this deck
62
In hiking up a mountain you are likely to pass through various community types as you proceed from the low-elevation lands to the summit. As you proceed from one community type to another, a boundary between community types, created by changing environmental conditions, will be observed. This boundary area of overlap/blending is termed the _____ and has _____ level of biodiversity as compared to each of the two communities on either side of the boundary area.
A) ecotone; a lower
B) ecotone; a higher
C) transition zone; the same
D) transition zone; lower
A) ecotone; a lower
B) ecotone; a higher
C) transition zone; the same
D) transition zone; lower
Unlock Deck
Unlock for access to all 66 flashcards in this deck.
Unlock Deck
k this deck
63
You are sampling a stream with a net, collecting 100 macroinvertebrates. Your collection is as follows (assume the different macroinvertebrate types noted are all the same species (e.g., 17 mayflies are all of the same species): 5 caddisflies, 17 mayflies, 48 stoneflies, 6 dragonflies, 10 damselflies, 4 alderflies, 2 dobsonflies, 2 midges, 3 crayfish, 1 aquatic sowbug, 1 water penny, 1 cranefly
If you were to take this data and construct a rank abundance curve, what would it look like?
A) a straight line sloped upward
B) a straight line sloped downward
C) a curve that starts off relatively level on the left side and curving steeply upward on the right
D) a curve initially very steeply downward on the left side and leveling off on the right
Unlock Deck
Unlock for access to all 66 flashcards in this deck.
Unlock Deck
k this deck
64
Shannon's index and Simpson's index are both measurements of a community's level of diversity. What does it mean when, after calculating these two indices for a given community, the results show the Simpson's index = 1, while the Shannon's index = 0?
A) Something is in error with one of the calculations.
B) The community's diversity level is so high that the values are inconsistent.
C) The community has no diversity.
D) The community is in transition from low to high diversity
A) Something is in error with one of the calculations.
B) The community's diversity level is so high that the values are inconsistent.
C) The community has no diversity.
D) The community is in transition from low to high diversity
Unlock Deck
Unlock for access to all 66 flashcards in this deck.
Unlock Deck
k this deck
65
Whitaker's classic study of trees in the Great Smoky Mountains provided evidence of the fact that
A) ecotones are only temporary.
B) in a community, as environmental conditions change, all tree species respond in the same manner relative to abundance.
C) changes in tree species abundance impacts herbivores.
D) when environmental changes occur in a community-specific tree species, abundance values change independently of other trees.
Unlock Deck
Unlock for access to all 66 flashcards in this deck.
Unlock Deck
k this deck
66
The variable (pi) used in the Shannon's Diversity Index (or Shannon-Wiener Index) is
A) the number of trophic levels in the food web under study.
B) the number of connections between species in the food web under study.
C) the relative abundance value for each of the species in the community under study.
D) the relative evenness value for each of the species in the community under study.
Unlock Deck
Unlock for access to all 66 flashcards in this deck.
Unlock Deck
k this deck
Unlock Deck
Unlock for access to all 66 flashcards in this deck.


