Deck 44: Population Ecology
Full screen (f)
Question
Question
Question
Question
Question
Question
Question
Figure 44.5
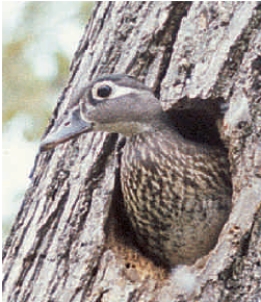
The wood duck shown in the above photograph was adversely affected by ____ and is making a comeback thanks to ____.
A) global cooling; heat producing chemical added to their diet
B) sexually transmitted viruses; a new vaccine
C) limited numbers of natural cavities; artificial nesting boxes
D) high incidence of males being born; transplantation of females from other areas
E) invasive species; removal of introduced predators
Question
Question
Question
Question
Question
Question
Question
Question
Question
Question
Question
Question
Question
Question
Question
Question
Question
Question
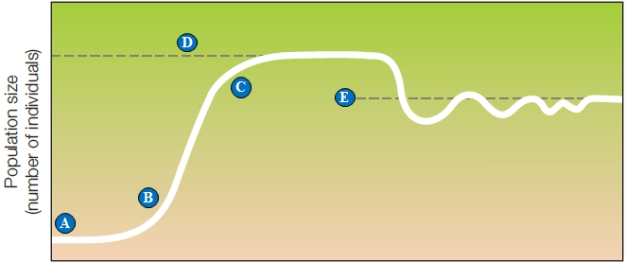 Figure 44.6
The following question refers to the figure above illustrating logistic growth.
The population is entering exponential growth at letter ____.
A) A
B) B
C) C
D) D
E) E
Question
Figure 44.6The following question refers to the figure above illustrating logistic growth.
The initial carrying capacity of an environment is indicated by ____.
A) A
B) B
C) C
D) D
E) E
Question
Question
Question
Question
Question
Question
Question
Figure 44.6The following question refers to the figure above illustrating logistic growth.
The effect of population growth limiting factors begins to become evident at about the letter ____.
A) A
B) B
C) C
D) D
E) E
Question
Question
Question
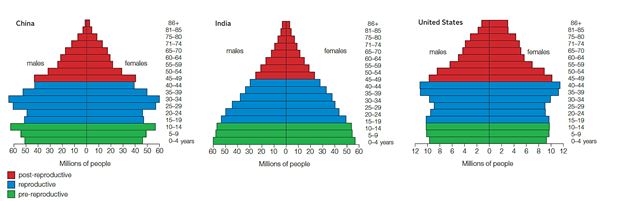 Figure 44.14
The following question refers to the age structure diagrams above.
Which statement reflects the age structure of these three countries?
A) India has the greatest proportion of older adults.
B) The United States has the greatest proportion of young people.
C) India has the greatest proportion of young people.
D) China has the greatest proportion of young people.
E) China has the greatest proportion of older adults.
Question
Question
Question
Question
Question
Question
Question
Question
Question
Question
Question
Question
Question
Question
Question
Question
Question
Question
Question
Question
Question
Question
Question

Unlock Deck
Sign up to unlock the cards in this deck!
Unlock Deck
Unlock Deck
1/59
Play
Full screen (f)
Deck 44: Population Ecology
1
Populations ____.
A) are only limited by one factor at a time
B) increase arithmetically
C) may increase indefinitely
D) are limited by the carrying capacity
E) overcome limiting factors by increasing their biotic potential
A) are only limited by one factor at a time
B) increase arithmetically
C) may increase indefinitely
D) are limited by the carrying capacity
E) overcome limiting factors by increasing their biotic potential
D
2
There will be approximately ____ mice in four months in a population of 1,000 mice where 500 mice are born and 400 mice die monthly.
A) 1,000
B) 1,100
C) 1,200
D) 1,300
E) 1,400
A) 1,000
B) 1,100
C) 1,200
D) 1,300
E) 1,400
E
3
Scientists use ____ sampling to estimate the population size of mobile animals.
A) mark-recapture
B) random
C) plot
D) base
E) homogeneous
A) mark-recapture
B) random
C) plot
D) base
E) homogeneous
A
4
The number of individuals occupying a unit of habitat (volume or area)is the ___________.
A) distribution
B) carrying capacity
C) population density
D) population size
E) birth rate
A) distribution
B) carrying capacity
C) population density
D) population size
E) birth rate
Unlock Deck
Unlock for access to all 59 flashcards in this deck.
Unlock Deck
k this deck
5
The per capita growth rate (r)is ____ per mouse per month in a population of 1,000 mice where 500 mice are born and 400 mice die monthly.
A) 0.1
B) 0.2
C) 0.3
D) 0.4
E) 0.5
A) 0.1
B) 0.2
C) 0.3
D) 0.4
E) 0.5
Unlock Deck
Unlock for access to all 59 flashcards in this deck.
Unlock Deck
k this deck
6
Which of these is NOT a direct factor that controls biotic potential?
A) The age at which reproduction generally begins
B) The resources available for each individual
C) Reproductive rate
D) Predators and pathogens
E) Genetic mutations
A) The age at which reproduction generally begins
B) The resources available for each individual
C) Reproductive rate
D) Predators and pathogens
E) Genetic mutations
Unlock Deck
Unlock for access to all 59 flashcards in this deck.
Unlock Deck
k this deck
7
Figure 44.5
The wood duck shown in the above photograph was adversely affected by ____ and is making a comeback thanks to ____.
A) global cooling; heat producing chemical added to their diet
B) sexually transmitted viruses; a new vaccine
C) limited numbers of natural cavities; artificial nesting boxes
D) high incidence of males being born; transplantation of females from other areas
E) invasive species; removal of introduced predators
Unlock Deck
Unlock for access to all 59 flashcards in this deck.
Unlock Deck
k this deck
8
What distribution pattern is the most common in the natural world?
A) Random
B) Uniform
C) Clumped
D) Stratified or layered
E) Homogeneous
A) Random
B) Uniform
C) Clumped
D) Stratified or layered
E) Homogeneous
Unlock Deck
Unlock for access to all 59 flashcards in this deck.
Unlock Deck
k this deck
9
The clumped distribution of coral colonies is due to ____.
A) asexual reproduction
B) patchy distribution of resources
C) availability of sunlight
D) competition for limited resources
E) uniformly available resources
A) asexual reproduction
B) patchy distribution of resources
C) availability of sunlight
D) competition for limited resources
E) uniformly available resources
Unlock Deck
Unlock for access to all 59 flashcards in this deck.
Unlock Deck
k this deck
10
Which factor is NOT responsible for the increase in the size of human population?
A) Clothing
B) Medicine
C) Sanitation
D) Innovations in agriculture
E) Increased total fertility rate
A) Clothing
B) Medicine
C) Sanitation
D) Innovations in agriculture
E) Increased total fertility rate
Unlock Deck
Unlock for access to all 59 flashcards in this deck.
Unlock Deck
k this deck
11
Which of the following factors can affect carrying capacity?
A) Population size
B) Human activity
C) Growth rate
D) Natural selection
E) Generation time
A) Population size
B) Human activity
C) Growth rate
D) Natural selection
E) Generation time
Unlock Deck
Unlock for access to all 59 flashcards in this deck.
Unlock Deck
k this deck
12
A population of dandelions in a field exemplifies a ____ population distribution.
A) clumped
B) random
C) uniform
D) constant
E) homogeneous
A) clumped
B) random
C) uniform
D) constant
E) homogeneous
Unlock Deck
Unlock for access to all 59 flashcards in this deck.
Unlock Deck
k this deck
13
Density-independent factors that limit population growth include ____.
A) parasites
B) temperature
C) disease
D) competition
E) predation
A) parasites
B) temperature
C) disease
D) competition
E) predation
Unlock Deck
Unlock for access to all 59 flashcards in this deck.
Unlock Deck
k this deck
14
The effect of resource availability on population size ultimately determines ____.
A) the carrying capacity of the environment
B) exponential growth
C) the doubling time of a population
D) the population's biotic potential
E) the loss of species in an ecosystem
A) the carrying capacity of the environment
B) exponential growth
C) the doubling time of a population
D) the population's biotic potential
E) the loss of species in an ecosystem
Unlock Deck
Unlock for access to all 59 flashcards in this deck.
Unlock Deck
k this deck
15
Random distribution of individuals in a population occurs when resource availability is ____ and individuals ____ one another.
A) scarce; attract
B) clumped; neither attract nor avoid
C) random; avoid
D) uniform; neither attract nor avoid
E) scarce; avoid
A) scarce; attract
B) clumped; neither attract nor avoid
C) random; avoid
D) uniform; neither attract nor avoid
E) scarce; avoid
Unlock Deck
Unlock for access to all 59 flashcards in this deck.
Unlock Deck
k this deck
16
Individuals in the population grouped according to levels of maturity define the population's ____.
A) carrying capacity
B) age structure
C) density
D) size
E) birth rate
A) carrying capacity
B) age structure
C) density
D) size
E) birth rate
Unlock Deck
Unlock for access to all 59 flashcards in this deck.
Unlock Deck
k this deck
17
The distribution of animals and plants in competition for scarce resources tends to be ____.
A) clumped
B) random
C) near uniform
D) constant
E) homogeneous
A) clumped
B) random
C) near uniform
D) constant
E) homogeneous
Unlock Deck
Unlock for access to all 59 flashcards in this deck.
Unlock Deck
k this deck
18
Zero population growth is achieved when ____.
A) a population starts to decline
B) emigration and immigration are balanced, and the number of births equals the number of deaths
C) births exceed deaths
D) deaths exceed births
E) emigration and immigration are prevented
A) a population starts to decline
B) emigration and immigration are balanced, and the number of births equals the number of deaths
C) births exceed deaths
D) deaths exceed births
E) emigration and immigration are prevented
Unlock Deck
Unlock for access to all 59 flashcards in this deck.
Unlock Deck
k this deck
19
The carrying capacity for a plant species can decrease when ______.
A) natural selection occurs
B) germination starts too early
C) plants evolve a quick-growing trait
D) the population of pollinators increase
E) soil nutrients are become depleted
A) natural selection occurs
B) germination starts too early
C) plants evolve a quick-growing trait
D) the population of pollinators increase
E) soil nutrients are become depleted
Unlock Deck
Unlock for access to all 59 flashcards in this deck.
Unlock Deck
k this deck
20
The distribution of hippopotamuses in muddy shallows is an example of ____ distribution.
A) clumped
B) random
C) uniform
D) constant
E) homogeneous
A) clumped
B) random
C) uniform
D) constant
E) homogeneous
Unlock Deck
Unlock for access to all 59 flashcards in this deck.
Unlock Deck
k this deck
21
The replacement fertility rate is ____.
A) the average number of children a man must sire to replace himself with a son who reaches reproductive age
B) the average number of children woman must bear to replace herself with one daughter who reaches reproductive age
C) the average number of children born per year in a population
D) the birth rate minus the death rate of a population
E) the number of boy-girl pairs born each year in a population
Unlock Deck
Unlock for access to all 59 flashcards in this deck.
Unlock Deck
k this deck
22
Which of the following refers to the area of Earth's surface that is required to sustainably support a particular level of development and consumption?
A) Demographic transition model
B) Carrying capacity
C) Ecological footprint
D) Biosphere
E) Ecological cohort
A) Demographic transition model
B) Carrying capacity
C) Ecological footprint
D) Biosphere
E) Ecological cohort
Unlock Deck
Unlock for access to all 59 flashcards in this deck.
Unlock Deck
k this deck
23
The average person in the United States has an ecological footprint nearly _____ times that of an average world citizen.
A) two
B) three
C) four
D) five
E) six
A) two
B) three
C) four
D) five
E) six
Unlock Deck
Unlock for access to all 59 flashcards in this deck.
Unlock Deck
k this deck
24
Choose the most appropriate response for each.
a.Growth pattern which appears as a J-shaped curve when population increases are plotted against time
b.For some interval, the added number of individuals divided by the initial population size
c.Population with greater proportion of young people; indicates greater expected population growth
d.For example, the amount of glucose in a culture flask containing bacteria
Exponential growth
Unlock Deck
Unlock for access to all 59 flashcards in this deck.
Unlock Deck
k this deck
25
Figure 44.6The following question refers to the figure above illustrating logistic growth.
The population is entering exponential growth at letter ____.
A) A
B) B
C) C
D) D
E) E
Unlock Deck
Unlock for access to all 59 flashcards in this deck.
Unlock Deck
k this deck
26
Figure 44.6The following question refers to the figure above illustrating logistic growth.
The initial carrying capacity of an environment is indicated by ____.
A) A
B) B
C) C
D) D
E) E
Unlock Deck
Unlock for access to all 59 flashcards in this deck.
Unlock Deck
k this deck
27
A cohort is ____.
A) a group of individuals of the same species born during the same time interval
B) any member of the same species
C) a group of individuals with the same parents
D) a group of individuals of the same sex
E) any group of closely related individuals
A) a group of individuals of the same species born during the same time interval
B) any member of the same species
C) a group of individuals with the same parents
D) a group of individuals of the same sex
E) any group of closely related individuals
Unlock Deck
Unlock for access to all 59 flashcards in this deck.
Unlock Deck
k this deck
28
Reznick and Endler's research with guppies suggested four of the following.Which one is the exception?
A) Life history traits can be inherited.
B) Life history traits evolve.
C) Life history traits can be altered over a short period of time.
D) Life history traits are not influenced by predation patterns.
E) Life history traits are coded for in DNA.
A) Life history traits can be inherited.
B) Life history traits evolve.
C) Life history traits can be altered over a short period of time.
D) Life history traits are not influenced by predation patterns.
E) Life history traits are coded for in DNA.
Unlock Deck
Unlock for access to all 59 flashcards in this deck.
Unlock Deck
k this deck
29
The Reznick and Endler guppy study showed that life history traits in guppies ____.
A) evolve primarily due to migration patterns
B) are unpredictable and random from a human standpoint
C) change very slowly, and only in response to individual guppy needs
D) are unchanged in response to the preferences of predators
E) can evolve rapidly in response to the preferences of predators
A) evolve primarily due to migration patterns
B) are unpredictable and random from a human standpoint
C) change very slowly, and only in response to individual guppy needs
D) are unchanged in response to the preferences of predators
E) can evolve rapidly in response to the preferences of predators
Unlock Deck
Unlock for access to all 59 flashcards in this deck.
Unlock Deck
k this deck
30
Type II survivorship curves ____.
A) are characteristic of humans and elephants
B) indicate a fairly constant rate of death at all ages
C) indicate a high mortality rate in the very young
D) are characteristic of species in which most individuals live a relatively long life and die of old age
E) are typical of species with high biotic potentials
Unlock Deck
Unlock for access to all 59 flashcards in this deck.
Unlock Deck
k this deck
31
Which of the following is correct regarding r-selection?
A) It favors quickly producing as many offspring as possible at low population density.
B) At a higher population density, r-selection favors fewer, high-quality offspring.
C) R-selection is exhibited by most equilibrial species.
D) Species not described by K-selection are entirely explained by r-selection alone.
E) None of these are correct.
Unlock Deck
Unlock for access to all 59 flashcards in this deck.
Unlock Deck
k this deck
32
Which factor is ultimately responsible for the rapid population explosion of humans?
A) More prevalence of microorganisms to fight diseases naturally
B) Increasing availability of natural resources
C) Decreasing migration of human and animal populations
D) Decline in death rates without an equivalent decline in birth rates
E) Advances in reproductive technology
A) More prevalence of microorganisms to fight diseases naturally
B) Increasing availability of natural resources
C) Decreasing migration of human and animal populations
D) Decline in death rates without an equivalent decline in birth rates
E) Advances in reproductive technology
Unlock Deck
Unlock for access to all 59 flashcards in this deck.
Unlock Deck
k this deck
33
Figure 44.6The following question refers to the figure above illustrating logistic growth.
The effect of population growth limiting factors begins to become evident at about the letter ____.
A) A
B) B
C) C
D) D
E) E
Unlock Deck
Unlock for access to all 59 flashcards in this deck.
Unlock Deck
k this deck
34
Equilibrial species are shaped by ____,and tend to have a ____.
A) K-selection; small body and short generation time
B) r-selection; large body and long generation time
C) K-selection; large body and long generation time
D) r-selection; small body and long generation time
E) r-selection; large body and short generation time
A) K-selection; small body and short generation time
B) r-selection; large body and long generation time
C) K-selection; large body and long generation time
D) r-selection; small body and long generation time
E) r-selection; large body and short generation time
Unlock Deck
Unlock for access to all 59 flashcards in this deck.
Unlock Deck
k this deck
35
Choose the most appropriate response for each.
a.Growth pattern which appears as a J-shaped curve when population increases are plotted against time
b.For some interval, the added number of individuals divided by the initial population size
c.Population with greater proportion of young people; indicates greater expected population growth
d.For example, the amount of glucose in a culture flask containing bacteria
Broad-based age structure
Unlock Deck
Unlock for access to all 59 flashcards in this deck.
Unlock Deck
k this deck
36
Figure 44.14The following question refers to the age structure diagrams above.
Which statement reflects the age structure of these three countries?
A) India has the greatest proportion of older adults.
B) The United States has the greatest proportion of young people.
C) India has the greatest proportion of young people.
D) China has the greatest proportion of young people.
E) China has the greatest proportion of older adults.
Unlock Deck
Unlock for access to all 59 flashcards in this deck.
Unlock Deck
k this deck
37
The ____ of a human population is the average number of children born to a woman during her reproductive years.
A) global reproductive rate
B) mean reproductive rate
C) average fertility rate
D) total fertility rate
E) replacement fertility rate
A) global reproductive rate
B) mean reproductive rate
C) average fertility rate
D) total fertility rate
E) replacement fertility rate
Unlock Deck
Unlock for access to all 59 flashcards in this deck.
Unlock Deck
k this deck
38
Which of the following changes in life history of the North Atlantic cod could have alerted scientists to the impending population crash?
A) A type I growth curve
B) A shift to K-selection characterized by larger fish
C) A shift to r-selection characterized by smaller fish
D) Type I growth curve the first year and type II in years two and three
E) Type I the first year, type II the second year, and type III the third year
A) A type I growth curve
B) A shift to K-selection characterized by larger fish
C) A shift to r-selection characterized by smaller fish
D) Type I growth curve the first year and type II in years two and three
E) Type I the first year, type II the second year, and type III the third year
Unlock Deck
Unlock for access to all 59 flashcards in this deck.
Unlock Deck
k this deck
39
A developing country's replacement fertility rate is most directly affected by which factor?
A) Poverty
B) Endemic diseases
C) Death of children before the age of reproduction
D) Environmental factors that disrupt fetal development
E) Government-directed population control
A) Poverty
B) Endemic diseases
C) Death of children before the age of reproduction
D) Environmental factors that disrupt fetal development
E) Government-directed population control
Unlock Deck
Unlock for access to all 59 flashcards in this deck.
Unlock Deck
k this deck
40
Choose the most appropriate response for each.
a.Growth pattern which appears as a J-shaped curve when population increases are plotted against time
b.For some interval, the added number of individuals divided by the initial population size
c.Population with greater proportion of young people; indicates greater expected population growth
d.For example, the amount of glucose in a culture flask containing bacteria
Per capita growth rate
Unlock Deck
Unlock for access to all 59 flashcards in this deck.
Unlock Deck
k this deck
41
A Type I survivorship curve is ___________
A) convex, such as that of humans
B) diagonal, such as that of lizards, small mammals, and large birds
C) concave, such as marine animals that release eggs
D) S-shaped, such as that of small birds
E) logarithmic, such as that of weeds
A) convex, such as that of humans
B) diagonal, such as that of lizards, small mammals, and large birds
C) concave, such as marine animals that release eggs
D) S-shaped, such as that of small birds
E) logarithmic, such as that of weeds
Unlock Deck
Unlock for access to all 59 flashcards in this deck.
Unlock Deck
k this deck
42
Classification. Respond to the following statements used by ecologists with reference to the five terms listed below:
a.Carrying capacity
b.Emigration
c.Immigration
d.Density-dependent limiting factor
e.Density-independent limiting factor
Movement of individuals out of a population
a.Carrying capacity
b.Emigration
c.Immigration
d.Density-dependent limiting factor
e.Density-independent limiting factor
Movement of individuals out of a population
Unlock Deck
Unlock for access to all 59 flashcards in this deck.
Unlock Deck
k this deck
43
With __________ growth,a small population starts growing slowly,then grows rapidly,and then levels off once __________ is reached.
Unlock Deck
Unlock for access to all 59 flashcards in this deck.
Unlock Deck
k this deck
44
Classification. Respond to the following statements used by ecologists with reference to the five terms listed below:
a.Carrying capacity
b.Emigration
c.Immigration
d.Density-dependent limiting factor
e.Density-independent limiting factor
This limits population growth to the same degree regardless of population density.
a.Carrying capacity
b.Emigration
c.Immigration
d.Density-dependent limiting factor
e.Density-independent limiting factor
This limits population growth to the same degree regardless of population density.
Unlock Deck
Unlock for access to all 59 flashcards in this deck.
Unlock Deck
k this deck
45
The size of a population depends on its rates of births,deaths,__________,and __________.
Unlock Deck
Unlock for access to all 59 flashcards in this deck.
Unlock Deck
k this deck
46
At low population density,__________ is favored,quickly producing as many offspring as possible.
Unlock Deck
Unlock for access to all 59 flashcards in this deck.
Unlock Deck
k this deck
47
The maximum possible rate of increase is a species' __________ potential.
Unlock Deck
Unlock for access to all 59 flashcards in this deck.
Unlock Deck
k this deck
48
Predation can change the life history of a prey species when predators choose prey based on their _________.
A) speed of movement
B) body size
C) coloration
D) population size
E) habitat
A) speed of movement
B) body size
C) coloration
D) population size
E) habitat
Unlock Deck
Unlock for access to all 59 flashcards in this deck.
Unlock Deck
k this deck
49
At high population density,__________ is favored,with organisms investing more time and energy in fewer,higher quality offspring.
Unlock Deck
Unlock for access to all 59 flashcards in this deck.
Unlock Deck
k this deck
50
Classification. Respond to the following statements used by ecologists with reference to the five terms listed below:
a.Carrying capacity
b.Emigration
c.Immigration
d.Density-dependent limiting factor
e.Density-independent limiting factor
The maximum number of individuals that a given habitat can support
a.Carrying capacity
b.Emigration
c.Immigration
d.Density-dependent limiting factor
e.Density-independent limiting factor
The maximum number of individuals that a given habitat can support
Unlock Deck
Unlock for access to all 59 flashcards in this deck.
Unlock Deck
k this deck
51
Choose the most appropriate response for each.
a.Growth pattern which appears as a J-shaped curve when population increases are plotted against time
b.For some interval, the added number of individuals divided by the initial population size
c.Population with greater proportion of young people; indicates greater expected population growth
d.For example, the amount of glucose in a culture flask containing bacteria
Density-dependent limiting factor
Unlock Deck
Unlock for access to all 59 flashcards in this deck.
Unlock Deck
k this deck
52
A(n)__________ is a group of individuals born during the same time interval.
Unlock Deck
Unlock for access to all 59 flashcards in this deck.
Unlock Deck
k this deck
53
Classification. Respond to the following statements used by ecologists with reference to the five terms listed below:
a.Carrying capacity
b.Emigration
c.Immigration
d.Density-dependent limiting factor
e.Density-independent limiting factor
This is a factor that causes a logistic growth pattern
a.Carrying capacity
b.Emigration
c.Immigration
d.Density-dependent limiting factor
e.Density-independent limiting factor
This is a factor that causes a logistic growth pattern
Unlock Deck
Unlock for access to all 59 flashcards in this deck.
Unlock Deck
k this deck
54
Based on the demographic transition model,which of the following countries is in the industrialization stage,marked by birth rate declines and less rapid population growth compared to the previous period?
A) Germany
B) Canada
C) Japan
D) Mexico
E) India
A) Germany
B) Canada
C) Japan
D) Mexico
E) India
Unlock Deck
Unlock for access to all 59 flashcards in this deck.
Unlock Deck
k this deck
55
Which of the following is an example of r-selected organism?
A) Coconut palm
B) Flies
C) Elephants
D) Humans
E) Horses
A) Coconut palm
B) Flies
C) Elephants
D) Humans
E) Horses
Unlock Deck
Unlock for access to all 59 flashcards in this deck.
Unlock Deck
k this deck
56
Classification. Respond to the following statements used by ecologists with reference to the five terms listed below:
a.Carrying capacity
b.Emigration
c.Immigration
d.Density-dependent limiting factor
e.Density-independent limiting factor
Movement of individuals into a population
a.Carrying capacity
b.Emigration
c.Immigration
d.Density-dependent limiting factor
e.Density-independent limiting factor
Movement of individuals into a population
Unlock Deck
Unlock for access to all 59 flashcards in this deck.
Unlock Deck
k this deck
57
In cases of __________ growth,a population's growth rate remains constant and greater than zero.
Unlock Deck
Unlock for access to all 59 flashcards in this deck.
Unlock Deck
k this deck
58
Competition among members of the same species is known as ___________.
Unlock Deck
Unlock for access to all 59 flashcards in this deck.
Unlock Deck
k this deck
59
__________ sampling can be used to estimate the population of an area based on direct counts in a small part of the area.
Unlock Deck
Unlock for access to all 59 flashcards in this deck.
Unlock Deck
k this deck
Unlock Deck
Unlock for access to all 59 flashcards in this deck.


