Deck 14: Farm Policy
Full screen (f)
Question
Question
Reference: Use the graph below to answer questions 16-21. 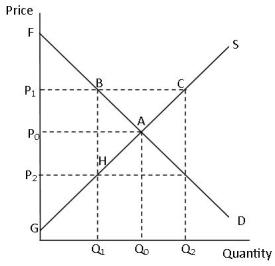
Refer to the graph of an agricultural product.With the price support in place the producer surplus is represented by the area of
A)P0FA
B)P1FB
C)GP0A
D)P1BHG
Refer to the graph of an agricultural product.With the price support in place the producer surplus is represented by the area of
A)P0FA
B)P1FB
C)GP0A
D)P1BHG
Question
Reference: Use the graph below to answer questions 16-21.
Refer to the graph of an agricultural product.With the price support enacted the consumer surplus is represented by the area of
A)P0FA
B)P1FB
C)GP0A
D)P1BHG
Refer to the graph of an agricultural product.With the price support enacted the consumer surplus is represented by the area of
A)P0FA
B)P1FB
C)GP0A
D)P1BHG
Question
Question
Question
Reference: Use the graph below to answer questions 16-21.
Refer to the graph of an agricultural product.Without the price support producer surplus is represented by the area of
A)P0FA
B)P1FB
C)GP0A
D)P1BHG
Refer to the graph of an agricultural product.Without the price support producer surplus is represented by the area of
A)P0FA
B)P1FB
C)GP0A
D)P1BHG
Question
Question
Question
Question
Question
Question
Question
Question
Reference: Use the graph below to answer questions 16-21.
Refer to the graph of an agricultural product.A possible price support would be represented by
A)Price P0
B)Price P1
C)Price P2
D)Either Price P1 or Price P0
Refer to the graph of an agricultural product.A possible price support would be represented by
A)Price P0
B)Price P1
C)Price P2
D)Either Price P1 or Price P0
Question
Reference: Use the graph below to answer questions 16-21.
Refer to the graph of an agricultural product.Without the price support consumer surplus is represented by the area of
A)P0FA
B)P1FB
C)GP0A
D)P1BHG
Refer to the graph of an agricultural product.Without the price support consumer surplus is represented by the area of
A)P0FA
B)P1FB
C)GP0A
D)P1BHG
Question
Question
Question
Question
Question
Question
Question
Question
Question
The type of agricultural policy represented by the above graph is best defined as a 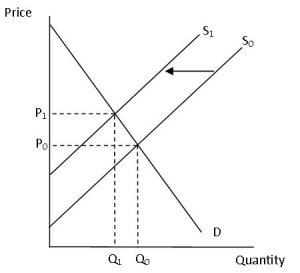
A)price support.
B)supply restriction.
C)demand enhancement.
D)income support.
A)price support.
B)supply restriction.
C)demand enhancement.
D)income support.
Question
Question
Question
Question
Question
Question
Question
Reference: Use the graph below to answer questions 16-21.
Refer to the graph of an agricultural product.Identify the deadweight loss to society created by the implementation of a price support.
A)Area ABC
B)Area HBA
C)P0FA
D)P1FB
Refer to the graph of an agricultural product.Identify the deadweight loss to society created by the implementation of a price support.
A)Area ABC
B)Area HBA
C)P0FA
D)P1FB
Question
Question
Question
Question
Question

Unlock Deck
Sign up to unlock the cards in this deck!
Unlock Deck
Unlock Deck
1/36
Play
Full screen (f)
Deck 14: Farm Policy
1
Primary drivers behind the level of agricultural output in the U.S.are all of the following except
A)labor-saving processes.
B)technological innovations.
C)improved crop and livestock techniques.
D)subsidies from the U.S.government.
A)labor-saving processes.
B)technological innovations.
C)improved crop and livestock techniques.
D)subsidies from the U.S.government.
D
2
Reference: Use the graph below to answer questions 16-21.
Refer to the graph of an agricultural product.With the price support in place the producer surplus is represented by the area of
A)P0FA
B)P1FB
C)GP0A
D)P1BHG
Refer to the graph of an agricultural product.With the price support in place the producer surplus is represented by the area of
A)P0FA
B)P1FB
C)GP0A
D)P1BHG
D
3
Reference: Use the graph below to answer questions 16-21.
Refer to the graph of an agricultural product.With the price support enacted the consumer surplus is represented by the area of
A)P0FA
B)P1FB
C)GP0A
D)P1BHG
Refer to the graph of an agricultural product.With the price support enacted the consumer surplus is represented by the area of
A)P0FA
B)P1FB
C)GP0A
D)P1BHG
B
4
Demand factors of the agricultural markets include
A)population size and incomes of consumers.
B)population size and age of consumers.
C)incomes of consumers and consumer preferences.
D)incomes of consumers and prices of related goods.
A)population size and incomes of consumers.
B)population size and age of consumers.
C)incomes of consumers and consumer preferences.
D)incomes of consumers and prices of related goods.
Unlock Deck
Unlock for access to all 36 flashcards in this deck.
Unlock Deck
k this deck
5
A contributing factor for the change in the number of farms has been
A)increased specialization in agricultural production.
B)improved technology.
C)greater advances in farming techniques.
D)the advancement of pivot irrigation.
A)increased specialization in agricultural production.
B)improved technology.
C)greater advances in farming techniques.
D)the advancement of pivot irrigation.
Unlock Deck
Unlock for access to all 36 flashcards in this deck.
Unlock Deck
k this deck
6
Reference: Use the graph below to answer questions 16-21.
Refer to the graph of an agricultural product.Without the price support producer surplus is represented by the area of
A)P0FA
B)P1FB
C)GP0A
D)P1BHG
Refer to the graph of an agricultural product.Without the price support producer surplus is represented by the area of
A)P0FA
B)P1FB
C)GP0A
D)P1BHG
Unlock Deck
Unlock for access to all 36 flashcards in this deck.
Unlock Deck
k this deck
7
Which of the following statements is correct?
A)Government agricultural policies are often designed to increase demand and decrease supply of agricultural products.
B)Government agricultural policies are often designed to decrease demand and increase supply of agricultural products.
C)Government agricultural policies are often designed to increase demand and increase supply of agricultural products.
D)Government agricultural policies are often designed to decrease demand and decrease supply of agricultural products.
Unlock Deck
Unlock for access to all 36 flashcards in this deck.
Unlock Deck
k this deck
8
Historically, the number of farms have
A)decreased but the number of workers have increased.
B)decreased and the number of workers have decreased.
C)increased but the number of workers have decreased.
D)increased and the number of workers have increased.
A)decreased but the number of workers have increased.
B)decreased and the number of workers have decreased.
C)increased but the number of workers have decreased.
D)increased and the number of workers have increased.
Unlock Deck
Unlock for access to all 36 flashcards in this deck.
Unlock Deck
k this deck
9
Paid to producers, this typically is designed to provides assistance and supplement income.
A)Farm tax
B)Subsidy
C)Price ceiling
D)Price support
A)Farm tax
B)Subsidy
C)Price ceiling
D)Price support
Unlock Deck
Unlock for access to all 36 flashcards in this deck.
Unlock Deck
k this deck
10
Components of agricultural policies include all of the following except
A)Price supports
B)Supply restrictions
C)Supply enhancements
D)Income supports
A)Price supports
B)Supply restrictions
C)Supply enhancements
D)Income supports
Unlock Deck
Unlock for access to all 36 flashcards in this deck.
Unlock Deck
k this deck
11
Characteristics that have contributed to existing farm policy include the
A)elasticity of the demand for agricultural products.
B)inelasticity of the demand for agricultural products.
C)elasticity of the supply of agricultural products.
D)inelasticity of the supply for agricultural products.
A)elasticity of the demand for agricultural products.
B)inelasticity of the demand for agricultural products.
C)elasticity of the supply of agricultural products.
D)inelasticity of the supply for agricultural products.
Unlock Deck
Unlock for access to all 36 flashcards in this deck.
Unlock Deck
k this deck
12
A bumper crop of a specific agricultural product will result in
A)lower prices and decreases in total revenue.
B)higher prices and increases in total revenue.
C)lower prices and increases in total revenue.
D)higher prices and decreases in total revenue.
A)lower prices and decreases in total revenue.
B)higher prices and increases in total revenue.
C)lower prices and increases in total revenue.
D)higher prices and decreases in total revenue.
Unlock Deck
Unlock for access to all 36 flashcards in this deck.
Unlock Deck
k this deck
13
As a result of a price support on an agricultural product
A)Consumers will pay a higher price
B)Consumers will pay a lower price
C)Consumers will increase their quantity demanded
D)Consumers will increase their demand
A)Consumers will pay a higher price
B)Consumers will pay a lower price
C)Consumers will increase their quantity demanded
D)Consumers will increase their demand
Unlock Deck
Unlock for access to all 36 flashcards in this deck.
Unlock Deck
k this deck
14
Reference: Use the graph below to answer questions 16-21.
Refer to the graph of an agricultural product.A possible price support would be represented by
A)Price P0
B)Price P1
C)Price P2
D)Either Price P1 or Price P0
Refer to the graph of an agricultural product.A possible price support would be represented by
A)Price P0
B)Price P1
C)Price P2
D)Either Price P1 or Price P0
Unlock Deck
Unlock for access to all 36 flashcards in this deck.
Unlock Deck
k this deck
15
Reference: Use the graph below to answer questions 16-21.
Refer to the graph of an agricultural product.Without the price support consumer surplus is represented by the area of
A)P0FA
B)P1FB
C)GP0A
D)P1BHG
Refer to the graph of an agricultural product.Without the price support consumer surplus is represented by the area of
A)P0FA
B)P1FB
C)GP0A
D)P1BHG
Unlock Deck
Unlock for access to all 36 flashcards in this deck.
Unlock Deck
k this deck
16
Historically, a significant number of current U.S.government involvement in the agricultural industry originated
A)with our founding fathers in the 1800s.
B)in the Great Depression era of the 1930s.
C)due to the stagflation of the 80s.
D)in the economic boom of the 1990s.
A)with our founding fathers in the 1800s.
B)in the Great Depression era of the 1930s.
C)due to the stagflation of the 80s.
D)in the economic boom of the 1990s.
Unlock Deck
Unlock for access to all 36 flashcards in this deck.
Unlock Deck
k this deck
17
Which of the following statements is correct?
A)Price supports results in a shortage of the good
B)A subsidy results in an over allocation of resources to farm products
C)Price supports results in an over allocation of resources to farm products
D)Income supports has a direct impact on agricultural production
A)Price supports results in a shortage of the good
B)A subsidy results in an over allocation of resources to farm products
C)Price supports results in an over allocation of resources to farm products
D)Income supports has a direct impact on agricultural production
Unlock Deck
Unlock for access to all 36 flashcards in this deck.
Unlock Deck
k this deck
18
Supply-side explanations for the level of agricultural output in the U.S.today includes
A)technological changes and innovations.
B)increased productivity.
C)increases in the labor force.
D)technological changes and innovations and increased productivity.
A)technological changes and innovations.
B)increased productivity.
C)increases in the labor force.
D)technological changes and innovations and increased productivity.
Unlock Deck
Unlock for access to all 36 flashcards in this deck.
Unlock Deck
k this deck
19
Demand for agricultural products tend to be
A)relatively price elastic.
B)relatively price inelastic.
C)relatively unitary elastic.
D)perfectly inelastic.
A)relatively price elastic.
B)relatively price inelastic.
C)relatively unitary elastic.
D)perfectly inelastic.
Unlock Deck
Unlock for access to all 36 flashcards in this deck.
Unlock Deck
k this deck
20
Economist estimate that between 1950 and 2000 the average amount of output per hour worked by a farmer was
A)6 times higher in 2000 than in 1950.
B)12 times higher in 2000 than in 1950.
C)18 times higher in 2000 than in 1950.
D)22 times higher in 2000 than in 1950.
A)6 times higher in 2000 than in 1950.
B)12 times higher in 2000 than in 1950.
C)18 times higher in 2000 than in 1950.
D)22 times higher in 2000 than in 1950.
Unlock Deck
Unlock for access to all 36 flashcards in this deck.
Unlock Deck
k this deck
21
Advocates of farm programs argue the policies are necessary to
A)Preserve the incomes of traditional family farms and rural communities
B)Stabilize demand
C)Increase supply which allows for higher prices
D)Decrease supply which allows for higher prices
A)Preserve the incomes of traditional family farms and rural communities
B)Stabilize demand
C)Increase supply which allows for higher prices
D)Decrease supply which allows for higher prices
Unlock Deck
Unlock for access to all 36 flashcards in this deck.
Unlock Deck
k this deck
22
Economists estimate that current commodity programs reduce U.S.net income by about $5 billion annually because of
A)Misallocated resources
B)Stagnate farmland prices
C)Higher taxes
D)Increased competitiveness
A)Misallocated resources
B)Stagnate farmland prices
C)Higher taxes
D)Increased competitiveness
Unlock Deck
Unlock for access to all 36 flashcards in this deck.
Unlock Deck
k this deck
23
Critics of farm programs cite that they
A)Support large farmers more than smaller farmers
B)Subsidize the producers at the expense of the consumers
C)Restrict competitiveness of U.S.producers
D)All of the above are criticisms of farm programs
A)Support large farmers more than smaller farmers
B)Subsidize the producers at the expense of the consumers
C)Restrict competitiveness of U.S.producers
D)All of the above are criticisms of farm programs
Unlock Deck
Unlock for access to all 36 flashcards in this deck.
Unlock Deck
k this deck
24
The type of agricultural policy represented by the above graph is best defined as a
A)price support.
B)supply restriction.
C)demand enhancement.
D)income support.
A)price support.
B)supply restriction.
C)demand enhancement.
D)income support.
Unlock Deck
Unlock for access to all 36 flashcards in this deck.
Unlock Deck
k this deck
25
Explain how the supply-side and the demand-side factors work together to generate equilibrium prices and quantity.
Unlock Deck
Unlock for access to all 36 flashcards in this deck.
Unlock Deck
k this deck
26
Acreage controls and soil conservation are programs enacted to
A)Increase elasticity of agricultural products
B)Decrease elasticity of agricultural products
C)Increase supply of agricultural products
D)Decrease supply of agricultural products
A)Increase elasticity of agricultural products
B)Decrease elasticity of agricultural products
C)Increase supply of agricultural products
D)Decrease supply of agricultural products
Unlock Deck
Unlock for access to all 36 flashcards in this deck.
Unlock Deck
k this deck
27
Explain the effects and impact of a supply restriction on prices and quantity from a government enacted supply restriction.Provide a graph to illustrate your answer.
Unlock Deck
Unlock for access to all 36 flashcards in this deck.
Unlock Deck
k this deck
28
In addition to assisting agricultural producers, this agricultural program is targeted toward low-income groups and foreign countries.
A)Price support
B)Supply restriction
C)Demand enhancement
D)Income support
A)Price support
B)Supply restriction
C)Demand enhancement
D)Income support
Unlock Deck
Unlock for access to all 36 flashcards in this deck.
Unlock Deck
k this deck
29
Who are the winners and losers from a price support?
Unlock Deck
Unlock for access to all 36 flashcards in this deck.
Unlock Deck
k this deck
30
The Conservation Reserve Program CRP) is an example of an)
A)price support.
B)supply restriction.
C)demand enhancement.
D)income support.
A)price support.
B)supply restriction.
C)demand enhancement.
D)income support.
Unlock Deck
Unlock for access to all 36 flashcards in this deck.
Unlock Deck
k this deck
31
Reference: Use the graph below to answer questions 16-21.
Refer to the graph of an agricultural product.Identify the deadweight loss to society created by the implementation of a price support.
A)Area ABC
B)Area HBA
C)P0FA
D)P1FB
Refer to the graph of an agricultural product.Identify the deadweight loss to society created by the implementation of a price support.
A)Area ABC
B)Area HBA
C)P0FA
D)P1FB
Unlock Deck
Unlock for access to all 36 flashcards in this deck.
Unlock Deck
k this deck
32
In recent years, farm household income has __________________ the income of the average U.S.household
A)Fallen behind
B)Equaled
C)Exceeded
D)Replicated
A)Fallen behind
B)Equaled
C)Exceeded
D)Replicated
Unlock Deck
Unlock for access to all 36 flashcards in this deck.
Unlock Deck
k this deck
33
As a result of a price support
A)Consumers lose
B)Consumers gain
C)Consumers are not affected by a price support
D)Society gains
A)Consumers lose
B)Consumers gain
C)Consumers are not affected by a price support
D)Society gains
Unlock Deck
Unlock for access to all 36 flashcards in this deck.
Unlock Deck
k this deck
34
Farm programs such as those found in the United States
A)Restrict output
B)Cause an inefficient use of resources by over allocating resources to the agricultural industry
C)Increases productivity
D)Cause the relative price of agricultural land to stagnate
A)Restrict output
B)Cause an inefficient use of resources by over allocating resources to the agricultural industry
C)Increases productivity
D)Cause the relative price of agricultural land to stagnate
Unlock Deck
Unlock for access to all 36 flashcards in this deck.
Unlock Deck
k this deck
35
The Food for Peace program
A)Is a demand enhancement policy designed to assist in the distribution of surplus U.S.agricultural output
B)Is a supply restriction policy designed to assist in the distribution of surplus U.S.agricultural output
C)Is an income support policy designed to assist in the distribution of surplus U.S.agricultural output
D)Is a supply support policy designed to assist in the distribution of surplus U.S.agricultural output
Unlock Deck
Unlock for access to all 36 flashcards in this deck.
Unlock Deck
k this deck
36
Which of the following statements is true?
A)Agricultural programs are largely designed to decrease subsidies to the industry.
B)Approximately half of the agriculture industry in the United States received support from governmental farm programs.
C)The full costs and benefits of agricultural policies and program are easily known and calculated.
D)Agricultural policies and programs primarily generate benefits.
Unlock Deck
Unlock for access to all 36 flashcards in this deck.
Unlock Deck
k this deck
Unlock Deck
Unlock for access to all 36 flashcards in this deck.


