Deck 7: Testing One Sample Mean
Full screen (f)
Question
Question
I draw a random sample from the population and calculate the mean of this sample  . If I were to do this an infinite number of times, I could create ______.
A) the sampling distribution of the mean
B) the null hypothesis
C) the standard normal distribution (normal curve)
D) the standard deviation
. If I were to do this an infinite number of times, I could create ______.A) the sampling distribution of the mean
B) the null hypothesis
C) the standard normal distribution (normal curve)
D) the standard deviation
Question
Question
Question
Although their formulas are similar, one primary difference between a z-score (z) and a t-statistic (t) is that the ______ of the formula for the t-statistic involves ______.
A) denominator; the variability of individual scores (Xs), not the variability of sample means
B) numerator; difference between a score (X) and a population mean (μ)
C) denominator; the variability of sample means , not the variability of individual scores (Xs)
D) numerator; the difference between a score (X) and a sample mean
A) denominator; the variability of individual scores (Xs), not the variability of sample means
B) numerator; difference between a score (X) and a population mean (μ)
C) denominator; the variability of sample means
, not the variability of individual scores (Xs)D) numerator; the difference between a score (X) and a sample mean
Question
Question
The ______ of the sampling distribution of the mean may be represented by ______.
A) symmetry; 0
B) variability; 1
C) modality; s
D) variability;
A) symmetry; 0
B) variability; 1
C) modality; s
D) variability;
Question
Question
Question
The sampling distribution of the mean helps ______.
A) determine the probability of obtaining a particular value of the population mean (µ)
B) describe the modality of a set of data
C) determine whether a set of data is skewed (asymmetric)
D) determine the probability of obtaining a particular value of a sample mean
A) determine the probability of obtaining a particular value of the population mean (µ)
B) describe the modality of a set of data
C) determine whether a set of data is skewed (asymmetric)
D) determine the probability of obtaining a particular value of a sample mean
Question
The variability of the sampling distribution of the mean may be represented by ______.
A) 0
B)
C) σ
D) s
A) 0
B)
C) σ
D) s
Question
The ______ of the sampling distribution of the mean may be represented by ______.
A) mean; 0
B) variability;
C) mean;
D) variability; 0
A) mean; 0
B) variability;
C) mean;
D) variability; 0
Question
Question
The sampling distribution of the mean helps us ______.
A) calculate descriptive statistics
B) set alpha (α)
C) determine the probability of a sample mean
D) determine whether our variables are normally distributed
A) calculate descriptive statistics
B) set alpha (α)
C) determine the probability of a sample mean
D) determine whether our variables are normally distributed
Question
The sampling distribution of the mean ______.
A) is used to set alpha (α)
B) helps researchers evaluate sample means
C) is based on an infinite number of z-scores
D) is also known as the 'normal curve'
A) is used to set alpha (α)
B) helps researchers evaluate sample means
C) is based on an infinite number of z-scores
D) is also known as the 'normal curve'
Question
Although their formulas are similar, one primary difference between a z-score (z) and a t-statistic (t) is that the ______ of the formula for the t-statistic contains or involves ______.
A) denominator; a sample mean rather than the population mean (μ)
B) numerator; a sample mean rather than an individual score (X)
C) numerator; the variability of individual scores (Xs) rather than sample means
D) denominator; the population mean (μ) rather than a sample mean
A) denominator; a sample mean
rather than the population mean (μ)B) numerator; a sample mean
rather than an individual score (X)C) numerator; the variability of individual scores (Xs) rather than sample means
D) denominator; the population mean (μ) rather than a sample mean
Question
Question
Question
The mean of the sampling distribution of the mean is equal to ______.
A)
B) 1
C) 0
D) µ
A)
B) 1
C) 0
D) µ
Question
Question
Question
Question
Question
Question
Question
Question
Question
Question
Question
Question
Question
This distribution provides an illustration of a ______. 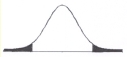
A) one-tailed null hypothesis
B) directional null hypothesis
C) directional alternative hypothesis
D) two-tailed alternative hypothesis
A) one-tailed null hypothesis
B) directional null hypothesis
C) directional alternative hypothesis
D) two-tailed alternative hypothesis
Question
Which of the following is a correctly stated alternative hypothesis?
A) H1: µ ≠ 3
B) H1: µ = 3
C) H1: = 3
= 3
D) H1: > 3
> 3
A) H1: µ ≠ 3
B) H1: µ = 3
C) H1:
= 3D) H1:
> 3 Question
Question
Question
Question
Question
Which of the following is a correctly stated alternative hypothesis?
A) H1: ≠ 3
≠ 3
B) H1: µ = 3
C) H1: α = .05 (two-tailed)
D) H1: µ ≠ 3
A) H1:
≠ 3B) H1: µ = 3
C) H1: α = .05 (two-tailed)
D) H1: µ ≠ 3
Question
Which of the following is a correctly stated null hypothesis?
A) H0: µ ≠ 3
B) H0: = 3
= 3
C) H0: µ = 3
D) H0: = 3
= 3
A) H0: µ ≠ 3
B) H0:
= 3C) H0: µ = 3
D) H0:
= 3 Question
Question
Imagine that for a population of 200, the mean is 20.23 with a standard deviation of 5.12. What is the population standard error of the mean  ?
?
A) .003
B) .03
C) .36
D) .50
?A) .003
B) .03
C) .36
D) .50
Question
This distribution illustrates a ______. 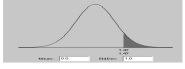
A) non-directional null hypothesis
B) directional null hypothesis
C) non-directional alternative hypothesis
D) directional alternative hypothesis
A) non-directional null hypothesis
B) directional null hypothesis
C) non-directional alternative hypothesis
D) directional alternative hypothesis
Question
Imagine that for a population of 40, the mean is 10.25 with a standard deviation of 2.10. What is the population standard error of the mean  ?
?
A) .03
B) .33
C) .34
D) .36
?A) .03
B) .33
C) .34
D) .36
Question
Question
Using the following information, calculate the z-statistic for the z-test for one mean.  = 27 μ = 15
  = 1.50
A) -8.00
B) 8.00
C) 4.00
D) -.10
= 27 μ = 15 = 1.50A) -8.00
B) 8.00
C) 4.00
D) -.10
Question
Question
Using the following information, calculate the z-statistic for the z-test for one mean.  = 31.75 μ = 25.67
  = 2.45
A) 2.48
B) -2.48
C) .10
D) -.10
= 31.75 μ = 25.67 = 2.45A) 2.48
B) -2.48
C) .10
D) -.10
Question
Using the following information, calculate the z-statistic for the z-test for one mean.  = 15 μ = 22
  = 3.50
A) 2.00
B) -2.00
C) 1.23
D) -3.13
= 15 μ = 22 = 3.50A) 2.00
B) -2.00
C) 1.23
D) -3.13
Question
Question
A population has a mean of 15.21 and a standard deviation of 1.56. For a sample of N = 20, what is the population standard error of the mean  ?
?
A) .35
B) .36
C) 1.56
D) 4.47
?A) .35
B) .36
C) 1.56
D) 4.47
Question
A population has a mean of 55.25 and a standard deviation of 14.23. For a sample of N = 100, what is the population standard error of the mean  ?
?
A) 7.03
B) 3.77
C) 1.43
D) 1.42
?A) 7.03
B) 3.77
C) 1.43
D) 1.42
Question
Using the following information, calculate the z-statistic for the z-test for one mean.  = 154 μ = 145
  = 15.25
A) 9.00
B) -9.00
C) .59
D) -.59
= 154 μ = 145 = 15.25A) 9.00
B) -9.00
C) .59
D) -.59
Question
A population has a mean of 606 and a standard deviation of 23. For a sample of N = 500, what is the population standard error of the mean  ?
?
A) .10
B) 1.02
C) 1.03
D) 1.1
?A) .10
B) 1.02
C) 1.03
D) 1.1
Question
Question
Using the following information, calculate the z-statistic for the z-test for one mean.  = 101 μ = 109
  = 3.44
A) -2.32
B) 2.32
C) -2.33
D) 2.33
= 101 μ = 109 = 3.44A) -2.32
B) 2.32
C) -2.33
D) 2.33
Question
Question
Question
Question
Question
Question
If I wanted to measure the variability of ______ , I would calculate ______.
A) individual scores (Xs); the standard error of the mean
B) sample means ; the standard error of the mean

C) sample means ; the standard deviation (s)
D) individual scores (Xs); the sample mean
A) individual scores (Xs); the standard error of the mean
B) sample means
; the standard error of the meanC) sample means
; the standard deviation (s)D) individual scores (Xs); the sample mean
Question
Question
In testing the mean of a sample, calculating a negative value of the t-statistic (t) indicates ______.
A) the sample mean is less than the hypothesized population mean
B) the score is less than the mean
C) is greater than
D) you have made an error in your calculations
A) the sample mean is less than the hypothesized population mean
B) the score is less than the mean
C)
is greater thanD) you have made an error in your calculations
Question
In testing the mean of a sample, the sample mean  is transformed into a t-statistic in order to ______.
A) determine the critical values
B) prove our research hypotheses
C) determine whether the alternative hypothesis (H1) should be one-tailed or two-tailed
D) determine the probability of obtaining the value of the sample mean
is transformed into a t-statistic in order to ______.A) determine the critical values
B) prove our research hypotheses
C) determine whether the alternative hypothesis (H1) should be one-tailed or two-tailed
D) determine the probability of obtaining the value of the sample mean
Question
Holding all else constant, as sample size increases, the value of the standard error of the mean  ______.
A) increases
B) decreases
C) stays the same
D) explodes
______.A) increases
B) decreases
C) stays the same
D) explodes
Question
You collect data from a sample of 150 people, and calculate a mean of 6.87 and a standard deviation of 3.69. What is the value for the standard error of the mean  ?
?
A) .30
B) 1.86
C) 6.87
D) 21.83
?A) .30
B) 1.86
C) 6.87
D) 21.83
Question
Which of the following can be a negative number in testing the mean of a sample?
A) the degrees of freedom
B) the critical values
C) alpha
D) the standard error of the mean
A) the degrees of freedom
B) the critical values
C) alpha
D) the standard error of the mean
Question
Question
Which of the following can be a negative number in testing the mean of a sample?
A) t
B) df
C)
D) α
A) t
B) df
C)
D) α
Question
Question
Question
Question
Looking at the degrees of freedom for a statistic like a t-statistic provides information regarding ______.
A) the size of the sample
B) the sample mean
C) whether alpha is one-tailed or two-tailed
D) the population mean (μ)
A) the size of the sample
B) the sample mean
C) whether alpha is one-tailed or two-tailed
D) the population mean (μ)
Question
You collect data from a sample of 150 people and calculate a mean of 6.87 and a standard deviation of 3.69. What is the value for the standard error of the mean  ?
?
A) .16
B) .30
C) 3.69
D) 12.24
?A) .16
B) .30
C) 3.69
D) 12.24
Question
In testing the mean of a sample, the sample mean  is transformed into a ______ statistic in order to ______.
A) z; decide whether to set alpha at .05 or .01
B) t; determine the probability of a sample mean
C) z; determine the critical values
D) t; determine whether the distribution of sample means is normal
is transformed into a ______ statistic in order to ______.A) z; decide whether to set alpha at .05 or .01
B) t; determine the probability of a sample mean
C) z; determine the critical values
D) t; determine whether the distribution of sample means is normal
Question
A ______ can represent the variability of ______.
A) standard deviation; sample means
B) standard deviation; differences between two sample means
C) standard error; individual scores (X)
D) standard error; sample means
A) standard deviation; sample means
B) standard deviation; differences between two sample means
C) standard error; individual scores (X)
D) standard error; sample means
Question
Question
From data collected from a sample of 100 people, you obtain a mean of 16.27 and a standard deviation of 4.56. What is the value for the standard error of the mean  ?
?
A) .46
B) .05
C) .16
D) 4.56
?A) .46
B) .05
C) .16
D) 4.56
Question
If I wanted to estimate the variability of sample means  , I would calculate ______.
A) the standard error of the mean
B) the standard deviation (s)
C) z-scores
D) the population mean (μ)
, I would calculate ______.A) the standard error of the mean
B) the standard deviation (s)
C) z-scores
D) the population mean (μ)
Question
If I wanted to measure the variability in a set of scores (Xs), I would calculate ______.
A) the standard error of the mean
B) the standard deviation (s)
C) z-scores
D) the t-statistic
A) the standard error of the mean
B) the standard deviation (s)
C) z-scores
D) the t-statistic

Unlock Deck
Sign up to unlock the cards in this deck!
Unlock Deck
Unlock Deck
1/134
Play
Full screen (f)
Deck 7: Testing One Sample Mean
1
Although their formulas are similar, one difference between a z-score (z) and a t-statistic (t) is that a z-score evaluates ______ but a t-statistic evaluates ______.
A) sample means; individual scores for a variable
B) individual scores for a variable; sample means
C) scores; probabilities
D) normal distributions; skewed distributions
A) sample means; individual scores for a variable
B) individual scores for a variable; sample means
C) scores; probabilities
D) normal distributions; skewed distributions
individual scores for a variable; sample means
2
I draw a random sample from the population and calculate the mean of this sample . If I were to do this an infinite number of times, I could create ______.
A) the sampling distribution of the mean
B) the null hypothesis
C) the standard normal distribution (normal curve)
D) the standard deviation
. If I were to do this an infinite number of times, I could create ______.A) the sampling distribution of the mean
B) the null hypothesis
C) the standard normal distribution (normal curve)
D) the standard deviation
the sampling distribution of the mean
3
The ______ is the distribution of values of the sample mean for an infinite number of samples of size N that are randomly selected from the population.
A) sampling distribution
B) standard error of the mean
C) sampling distribution of the mean
D) population standard error of the mean
A) sampling distribution
B) standard error of the mean
C) sampling distribution of the mean
D) population standard error of the mean
sampling distribution of the mean
4
Although their formulas are similar, one difference between the z-score (z) and the t-statistic (t) is that ______.
A) only the denominator of the z-score formula (not the t-statistic) is a measure of variability
B) z-scores evaluate sample means whereas t-statistics evaluate individual scores
C) only the numerator of the z-score formula (not the t-statistic) is the difference between means
D) the z-score evaluates individual scores whereas the t-statistic evaluates sample means
Unlock Deck
Unlock for access to all 134 flashcards in this deck.
Unlock Deck
k this deck
5
Although their formulas are similar, one primary difference between a z-score (z) and a t-statistic (t) is that the ______ of the formula for the t-statistic involves ______.
A) denominator; the variability of individual scores (Xs), not the variability of sample means
B) numerator; difference between a score (X) and a population mean (μ)
C) denominator; the variability of sample means , not the variability of individual scores (Xs)
D) numerator; the difference between a score (X) and a sample mean
A) denominator; the variability of individual scores (Xs), not the variability of sample means
B) numerator; difference between a score (X) and a population mean (μ)
C) denominator; the variability of sample means
, not the variability of individual scores (Xs)D) numerator; the difference between a score (X) and a sample mean
Unlock Deck
Unlock for access to all 134 flashcards in this deck.
Unlock Deck
k this deck
6
A researcher draws a random sample of 25 people from a population and calculates the mean of their IQs. If she were to repeat this process of drawing samples and calculating means an infinite number of times, the sample means could be used to create ______.
A) the sampling distribution of the mean
B) critical values
C) z-scores
D) research hypotheses
A) the sampling distribution of the mean
B) critical values
C) z-scores
D) research hypotheses
Unlock Deck
Unlock for access to all 134 flashcards in this deck.
Unlock Deck
k this deck
7
The ______ of the sampling distribution of the mean may be represented by ______.
A) symmetry; 0
B) variability; 1
C) modality; s
D) variability;
A) symmetry; 0
B) variability; 1
C) modality; s
D) variability;
Unlock Deck
Unlock for access to all 134 flashcards in this deck.
Unlock Deck
k this deck
8
Although their formulas are similar, one difference between the z-score (z) and the t-statistic (t) is that ______.
A) only z-scores (not t-statistics) are part of a theoretical distribution
B) z-scores evaluate sample means whereas t-statistics evaluate individual scores
C) the numerator of the t-statistic formula (not the z-score) is the difference between a score and a mean
D) the denominator of the t-statistic formula estimates the variability of sample means rather than individual scores
Unlock Deck
Unlock for access to all 134 flashcards in this deck.
Unlock Deck
k this deck
9
The ______ of the sampling distribution of the mean is represented by ______.
A) mean; µ
B) variability; s
C) mean; 1
D) variability;
A) mean; µ
B) variability; s
C) mean; 1
D) variability;
Unlock Deck
Unlock for access to all 134 flashcards in this deck.
Unlock Deck
k this deck
10
The sampling distribution of the mean helps ______.
A) determine the probability of obtaining a particular value of the population mean (µ)
B) describe the modality of a set of data
C) determine whether a set of data is skewed (asymmetric)
D) determine the probability of obtaining a particular value of a sample mean
A) determine the probability of obtaining a particular value of the population mean (µ)
B) describe the modality of a set of data
C) determine whether a set of data is skewed (asymmetric)
D) determine the probability of obtaining a particular value of a sample mean
Unlock Deck
Unlock for access to all 134 flashcards in this deck.
Unlock Deck
k this deck
11
The variability of the sampling distribution of the mean may be represented by ______.
A) 0
B)
C) σ
D) s
A) 0
B)
C) σ
D) s
Unlock Deck
Unlock for access to all 134 flashcards in this deck.
Unlock Deck
k this deck
12
The ______ of the sampling distribution of the mean may be represented by ______.
A) mean; 0
B) variability;
C) mean;
D) variability; 0
A) mean; 0
B) variability;
C) mean;
D) variability; 0
Unlock Deck
Unlock for access to all 134 flashcards in this deck.
Unlock Deck
k this deck
13
Which of the following is a similarity of the t-distribution and the standard normal distribution?
A) There is only one distribution for each.
B) Both distributions are symmetrical.
C) Both distributions are asymmetrical.
D) Both distributions are a function of the sample size.
A) There is only one distribution for each.
B) Both distributions are symmetrical.
C) Both distributions are asymmetrical.
D) Both distributions are a function of the sample size.
Unlock Deck
Unlock for access to all 134 flashcards in this deck.
Unlock Deck
k this deck
14
The sampling distribution of the mean helps us ______.
A) calculate descriptive statistics
B) set alpha (α)
C) determine the probability of a sample mean
D) determine whether our variables are normally distributed
A) calculate descriptive statistics
B) set alpha (α)
C) determine the probability of a sample mean
D) determine whether our variables are normally distributed
Unlock Deck
Unlock for access to all 134 flashcards in this deck.
Unlock Deck
k this deck
15
The sampling distribution of the mean ______.
A) is used to set alpha (α)
B) helps researchers evaluate sample means
C) is based on an infinite number of z-scores
D) is also known as the 'normal curve'
A) is used to set alpha (α)
B) helps researchers evaluate sample means
C) is based on an infinite number of z-scores
D) is also known as the 'normal curve'
Unlock Deck
Unlock for access to all 134 flashcards in this deck.
Unlock Deck
k this deck
16
Although their formulas are similar, one primary difference between a z-score (z) and a t-statistic (t) is that the ______ of the formula for the t-statistic contains or involves ______.
A) denominator; a sample mean rather than the population mean (μ)
B) numerator; a sample mean rather than an individual score (X)
C) numerator; the variability of individual scores (Xs) rather than sample means
D) denominator; the population mean (μ) rather than a sample mean
A) denominator; a sample mean
rather than the population mean (μ)B) numerator; a sample mean
rather than an individual score (X)C) numerator; the variability of individual scores (Xs) rather than sample means
D) denominator; the population mean (μ) rather than a sample mean
Unlock Deck
Unlock for access to all 134 flashcards in this deck.
Unlock Deck
k this deck
17
Holding all else constant, as sample size increases, the sampling distribution of the mean ______.
A) becomes flatter
B) has greater variability
C) becomes skewed
D) becomes more peaked
A) becomes flatter
B) has greater variability
C) becomes skewed
D) becomes more peaked
Unlock Deck
Unlock for access to all 134 flashcards in this deck.
Unlock Deck
k this deck
18
A ______ is used to evaluate ______.
A) z-score; the mean of a sample
B) t-test; the difference between two means
C) z-score; the difference between a sample mean and a population mean
D) t-test; a score on a variable
A) z-score; the mean of a sample
B) t-test; the difference between two means
C) z-score; the difference between a sample mean and a population mean
D) t-test; a score on a variable
Unlock Deck
Unlock for access to all 134 flashcards in this deck.
Unlock Deck
k this deck
19
The mean of the sampling distribution of the mean is equal to ______.
A)
B) 1
C) 0
D) µ
A)
B) 1
C) 0
D) µ
Unlock Deck
Unlock for access to all 134 flashcards in this deck.
Unlock Deck
k this deck
20
The ______ of the sampling distribution of the mean is equal to ______.
A) mean; 0
B) variability; 0
C) variability; 1
D) mean; µ
A) mean; 0
B) variability; 0
C) variability; 1
D) mean; µ
Unlock Deck
Unlock for access to all 134 flashcards in this deck.
Unlock Deck
k this deck
21
The central limit theorem states that when an infinite number of random samples are drawn from a population, the sample means are approximately normally distributed with a mean equal to the ______ and a standard deviation equal to the ______ of the mean.
A) population mean; standard error
B) population mean; standard deviation
C) sample mean; standard error
D) sample mean standard deviation
A) population mean; standard error
B) population mean; standard deviation
C) sample mean; standard error
D) sample mean standard deviation
Unlock Deck
Unlock for access to all 134 flashcards in this deck.
Unlock Deck
k this deck
22
The statement "µ ≠ 3" would be part of a ______.
A) non-directional alternative hypothesis
B) directional alternative hypothesis
C) non-directional null hypothesis
D) directional null hypothesis
A) non-directional alternative hypothesis
B) directional alternative hypothesis
C) non-directional null hypothesis
D) directional null hypothesis
Unlock Deck
Unlock for access to all 134 flashcards in this deck.
Unlock Deck
k this deck
23
A ______ symbol in the ______ hypothesis implies this hypothesis is ______.
A) >; null; one-tailed
B) ≠; null; directional
C) ≠; alternative; non-directional
D) =; alternative; one-tailed
A) >; null; one-tailed
B) ≠; null; directional
C) ≠; alternative; non-directional
D) =; alternative; one-tailed
Unlock Deck
Unlock for access to all 134 flashcards in this deck.
Unlock Deck
k this deck
24
A '≠' symbol in the ______ hypothesis implies this hypothesis is ______.
A) null; directional
B) null; two-tailed
C) alternative; one-tailed
D) alternative; non-directional
A) null; directional
B) null; two-tailed
C) alternative; one-tailed
D) alternative; non-directional
Unlock Deck
Unlock for access to all 134 flashcards in this deck.
Unlock Deck
k this deck
25
The statement µ > 3 is an example of a ______.
A) directional (one-tailed) null hypothesis
B) directional (one-tailed) alternative hypothesis
C) non-directional (two-tailed) null hypothesis
D) non-directional (two-tailed) alternative hypothesis
A) directional (one-tailed) null hypothesis
B) directional (one-tailed) alternative hypothesis
C) non-directional (two-tailed) null hypothesis
D) non-directional (two-tailed) alternative hypothesis
Unlock Deck
Unlock for access to all 134 flashcards in this deck.
Unlock Deck
k this deck
26
The statement µ < 10 is an example of a ______.
A) directional (one-tailed) alternative hypothesis
B) directional (one-tailed) null hypothesis
C) non-directional (two-tailed) alternative hypothesis
D) non-directional (two-tailed) null hypothesis
A) directional (one-tailed) alternative hypothesis
B) directional (one-tailed) null hypothesis
C) non-directional (two-tailed) alternative hypothesis
D) non-directional (two-tailed) null hypothesis
Unlock Deck
Unlock for access to all 134 flashcards in this deck.
Unlock Deck
k this deck
27
The statement µ > 3 is an example of a ______.
A) directional null hypothesis
B) directional alternative hypothesis
C) non-directional null hypothesis
D) non-directional alternative hypothesis
A) directional null hypothesis
B) directional alternative hypothesis
C) non-directional null hypothesis
D) non-directional alternative hypothesis
Unlock Deck
Unlock for access to all 134 flashcards in this deck.
Unlock Deck
k this deck
28
What is the sufficient sample size to use for the central limit theorem?
A) at least 25
B) at least 26
C) at least 30
D) at least 31
A) at least 25
B) at least 26
C) at least 30
D) at least 31
Unlock Deck
Unlock for access to all 134 flashcards in this deck.
Unlock Deck
k this deck
29
The modality, symmetry, and variability of the sampling distribution of the mean are defined by a statistical principle known as ______.
A) random sampling
B) ratio scale of measurement
C) standard error of the mean
D) central limit theorem
A) random sampling
B) ratio scale of measurement
C) standard error of the mean
D) central limit theorem
Unlock Deck
Unlock for access to all 134 flashcards in this deck.
Unlock Deck
k this deck
30
The statement "µ ≠ 3" would be part of a ______.
A) two-tailed, directional hypothesis
B) two-tailed, non-directional hypothesis
C) one-tailed, directional hypothesis
D) one-tailed, non-directional hypothesis
A) two-tailed, directional hypothesis
B) two-tailed, non-directional hypothesis
C) one-tailed, directional hypothesis
D) one-tailed, non-directional hypothesis
Unlock Deck
Unlock for access to all 134 flashcards in this deck.
Unlock Deck
k this deck
31
Standard deviation measures the ______ for a variable, standard error represents the ______ calculated from samples.
A) variability of statistics; variability of scores
B) variability of scores; variability of statistics
C) variability of scores; error of scores
D) variability of statistics; error of scores
A) variability of statistics; variability of scores
B) variability of scores; variability of statistics
C) variability of scores; error of scores
D) variability of statistics; error of scores
Unlock Deck
Unlock for access to all 134 flashcards in this deck.
Unlock Deck
k this deck
32
This distribution provides an illustration of a ______.
A) one-tailed null hypothesis
B) directional null hypothesis
C) directional alternative hypothesis
D) two-tailed alternative hypothesis
A) one-tailed null hypothesis
B) directional null hypothesis
C) directional alternative hypothesis
D) two-tailed alternative hypothesis
Unlock Deck
Unlock for access to all 134 flashcards in this deck.
Unlock Deck
k this deck
33
Which of the following is a correctly stated alternative hypothesis?
A) H1: µ ≠ 3
B) H1: µ = 3
C) H1: = 3
D) H1: > 3
A) H1: µ ≠ 3
B) H1: µ = 3
C) H1:
= 3D) H1:
> 3 Unlock Deck
Unlock for access to all 134 flashcards in this deck.
Unlock Deck
k this deck
34
A ______ alternative hypothesis (one that may have an ______ symbol) is also referred to as ______.
A) directional; ≠ ; one-tailed
B) non-directional; <; two-tailed
C) non-directional; >; asymmetrical
D) non-directional; ≠; two-tailed
A) directional; ≠ ; one-tailed
B) non-directional; <; two-tailed
C) non-directional; >; asymmetrical
D) non-directional; ≠; two-tailed
Unlock Deck
Unlock for access to all 134 flashcards in this deck.
Unlock Deck
k this deck
35
A ______ symbol in the ______ hypothesis implies this hypothesis is ______.
A) <; alternative; one-tailed
B) ≠; null; two-tailed
C) >; null; non-directional
D) ≠; alternative; directional
A) <; alternative; one-tailed
B) ≠; null; two-tailed
C) >; null; non-directional
D) ≠; alternative; directional
Unlock Deck
Unlock for access to all 134 flashcards in this deck.
Unlock Deck
k this deck
36
A ______ alternative hypothesis such as ______ is also referred to as ______.
A) directional; µ ≠ 164; two-tailed
B) non-directional; µ > 164; two-tailed
C) directional; µ > 164; one-tailed
D) non-directional; µ ≠ 164; one-tailed
A) directional; µ ≠ 164; two-tailed
B) non-directional; µ > 164; two-tailed
C) directional; µ > 164; one-tailed
D) non-directional; µ ≠ 164; one-tailed
Unlock Deck
Unlock for access to all 134 flashcards in this deck.
Unlock Deck
k this deck
37
A ______ alternative hypothesis (one that may have a ______ symbol) is also referred to as ______.
A) directional; ≠ ; two-tailed
B) non-directional; =; two-tailed
C) directional; >; one-tailed
D) non-directional; ≠; one-tailed
A) directional; ≠ ; two-tailed
B) non-directional; =; two-tailed
C) directional; >; one-tailed
D) non-directional; ≠; one-tailed
Unlock Deck
Unlock for access to all 134 flashcards in this deck.
Unlock Deck
k this deck
38
Which of the following is a correctly stated alternative hypothesis?
A) H1: ≠ 3
B) H1: µ = 3
C) H1: α = .05 (two-tailed)
D) H1: µ ≠ 3
A) H1:
≠ 3B) H1: µ = 3
C) H1: α = .05 (two-tailed)
D) H1: µ ≠ 3
Unlock Deck
Unlock for access to all 134 flashcards in this deck.
Unlock Deck
k this deck
39
Which of the following is a correctly stated null hypothesis?
A) H0: µ ≠ 3
B) H0: = 3
C) H0: µ = 3
D) H0: = 3
A) H0: µ ≠ 3
B) H0:
= 3C) H0: µ = 3
D) H0:
= 3 Unlock Deck
Unlock for access to all 134 flashcards in this deck.
Unlock Deck
k this deck
40
The '>' symbol would appear in the ______ hypothesis and would imply that this hypothesis is ______.
A) null; non-directional
B) null; two-tailed
C) alternative; one-tailed
D) alternative; non-directional
A) null; non-directional
B) null; two-tailed
C) alternative; one-tailed
D) alternative; non-directional
Unlock Deck
Unlock for access to all 134 flashcards in this deck.
Unlock Deck
k this deck
41
Imagine that for a population of 200, the mean is 20.23 with a standard deviation of 5.12. What is the population standard error of the mean ?
A) .003
B) .03
C) .36
D) .50
?A) .003
B) .03
C) .36
D) .50
Unlock Deck
Unlock for access to all 134 flashcards in this deck.
Unlock Deck
k this deck
42
This distribution illustrates a ______.
A) non-directional null hypothesis
B) directional null hypothesis
C) non-directional alternative hypothesis
D) directional alternative hypothesis
A) non-directional null hypothesis
B) directional null hypothesis
C) non-directional alternative hypothesis
D) directional alternative hypothesis
Unlock Deck
Unlock for access to all 134 flashcards in this deck.
Unlock Deck
k this deck
43
Imagine that for a population of 40, the mean is 10.25 with a standard deviation of 2.10. What is the population standard error of the mean ?
A) .03
B) .33
C) .34
D) .36
?A) .03
B) .33
C) .34
D) .36
Unlock Deck
Unlock for access to all 134 flashcards in this deck.
Unlock Deck
k this deck
44
For a z-statistic of -1.34, one would conclude (for a two-tailed test) the score is ______.
A) significant at the .05 level but not the .01 level
B) significant at both the .05 level and the .01 level
C) not significant
D) not significant at the .05 level but is significant at the .01 level
A) significant at the .05 level but not the .01 level
B) significant at both the .05 level and the .01 level
C) not significant
D) not significant at the .05 level but is significant at the .01 level
Unlock Deck
Unlock for access to all 134 flashcards in this deck.
Unlock Deck
k this deck
45
Using the following information, calculate the z-statistic for the z-test for one mean. = 27 μ = 15 = 1.50
A) -8.00
B) 8.00
C) 4.00
D) -.10
= 27 μ = 15 = 1.50A) -8.00
B) 8.00
C) 4.00
D) -.10
Unlock Deck
Unlock for access to all 134 flashcards in this deck.
Unlock Deck
k this deck
46
For a z-statistic of 2.79, one would conclude (for a two-tailed test) the score is ______.
A) significant at the .05 level but not the .01 level
B) significant at both the .05 level and the .01 level
C) not significant
D) not significant at the .05 level but is significant at the .01 level
A) significant at the .05 level but not the .01 level
B) significant at both the .05 level and the .01 level
C) not significant
D) not significant at the .05 level but is significant at the .01 level
Unlock Deck
Unlock for access to all 134 flashcards in this deck.
Unlock Deck
k this deck
47
Using the following information, calculate the z-statistic for the z-test for one mean. = 31.75 μ = 25.67 = 2.45
A) 2.48
B) -2.48
C) .10
D) -.10
= 31.75 μ = 25.67 = 2.45A) 2.48
B) -2.48
C) .10
D) -.10
Unlock Deck
Unlock for access to all 134 flashcards in this deck.
Unlock Deck
k this deck
48
Using the following information, calculate the z-statistic for the z-test for one mean. = 15 μ = 22 = 3.50
A) 2.00
B) -2.00
C) 1.23
D) -3.13
= 15 μ = 22 = 3.50A) 2.00
B) -2.00
C) 1.23
D) -3.13
Unlock Deck
Unlock for access to all 134 flashcards in this deck.
Unlock Deck
k this deck
49
For a z-statistic of -1.34, the decision about the null hypothesis is ______.
A) do not reject the null hypothesis (p > .05)
B) do not reject the null hypothesis (p < .01)
C) reject the null hypothesis (p > .05)
D) reject the null hypothesis (p < .05)
A) do not reject the null hypothesis (p > .05)
B) do not reject the null hypothesis (p < .01)
C) reject the null hypothesis (p > .05)
D) reject the null hypothesis (p < .05)
Unlock Deck
Unlock for access to all 134 flashcards in this deck.
Unlock Deck
k this deck
50
A population has a mean of 15.21 and a standard deviation of 1.56. For a sample of N = 20, what is the population standard error of the mean ?
A) .35
B) .36
C) 1.56
D) 4.47
?A) .35
B) .36
C) 1.56
D) 4.47
Unlock Deck
Unlock for access to all 134 flashcards in this deck.
Unlock Deck
k this deck
51
A population has a mean of 55.25 and a standard deviation of 14.23. For a sample of N = 100, what is the population standard error of the mean ?
A) 7.03
B) 3.77
C) 1.43
D) 1.42
?A) 7.03
B) 3.77
C) 1.43
D) 1.42
Unlock Deck
Unlock for access to all 134 flashcards in this deck.
Unlock Deck
k this deck
52
Using the following information, calculate the z-statistic for the z-test for one mean. = 154 μ = 145 = 15.25
A) 9.00
B) -9.00
C) .59
D) -.59
= 154 μ = 145 = 15.25A) 9.00
B) -9.00
C) .59
D) -.59
Unlock Deck
Unlock for access to all 134 flashcards in this deck.
Unlock Deck
k this deck
53
A population has a mean of 606 and a standard deviation of 23. For a sample of N = 500, what is the population standard error of the mean ?
A) .10
B) 1.02
C) 1.03
D) 1.1
?A) .10
B) 1.02
C) 1.03
D) 1.1
Unlock Deck
Unlock for access to all 134 flashcards in this deck.
Unlock Deck
k this deck
54
For a z-statistic of 1.89, one would conclude (for a two-tailed test) the score is ______.
A) significant only at the .05 level
B) significant at both the .05 level and the .01 level
C) not significant
D) not significant at the .05 level but is significant at the .01 level
A) significant only at the .05 level
B) significant at both the .05 level and the .01 level
C) not significant
D) not significant at the .05 level but is significant at the .01 level
Unlock Deck
Unlock for access to all 134 flashcards in this deck.
Unlock Deck
k this deck
55
Using the following information, calculate the z-statistic for the z-test for one mean. = 101 μ = 109 = 3.44
A) -2.32
B) 2.32
C) -2.33
D) 2.33
= 101 μ = 109 = 3.44A) -2.32
B) 2.32
C) -2.33
D) 2.33
Unlock Deck
Unlock for access to all 134 flashcards in this deck.
Unlock Deck
k this deck
56
If the calculated value of a z-statistic ______ the critical value, you would say ______.
A) does not exceed; p < .01
B) does not exceed; p < .05
C) does not exceed; p > .05
D) exceeds; p > .05
A) does not exceed; p < .01
B) does not exceed; p < .05
C) does not exceed; p > .05
D) exceeds; p > .05
Unlock Deck
Unlock for access to all 134 flashcards in this deck.
Unlock Deck
k this deck
57
The decision to use a directional versus non-directional alternative hypothesis most directly affects ______.
A) the critical value(s)
B) alpha ()
C) the sample size
D) the degrees of freedom
A) the critical value(s)
B) alpha ()
C) the sample size
D) the degrees of freedom
Unlock Deck
Unlock for access to all 134 flashcards in this deck.
Unlock Deck
k this deck
58
A researcher has calculated a z-statistic of 1.92. For a two-tailed test with alpha () = .05, which of the following is the most appropriate?
A) do not reject the null (p < .05)
B) do not reject the null (p > .05)
C) reject the null (p < .05)
D) reject the null (p > .05)
A) do not reject the null (p < .05)
B) do not reject the null (p > .05)
C) reject the null (p < .05)
D) reject the null (p > .05)
Unlock Deck
Unlock for access to all 134 flashcards in this deck.
Unlock Deck
k this deck
59
For a z-statistic of 2.22, one would conclude (for a two-tailed test) the score is ______.
A) significant at the .05 level but not the .01 level
B) significant at both the .05 level and the .01 level
C) not significant
D) not significant at the .05 level but is significant at the .01 level
A) significant at the .05 level but not the .01 level
B) significant at both the .05 level and the .01 level
C) not significant
D) not significant at the .05 level but is significant at the .01 level
Unlock Deck
Unlock for access to all 134 flashcards in this deck.
Unlock Deck
k this deck
60
If the value of a calculated z-statistic ______ the critical value, you would say ______.
A) exceeds; p > .05
B) exceeds; p < .05
C) does not exceed; p < .05
D) does not exceed; p < .01
A) exceeds; p > .05
B) exceeds; p < .05
C) does not exceed; p < .05
D) does not exceed; p < .01
Unlock Deck
Unlock for access to all 134 flashcards in this deck.
Unlock Deck
k this deck
61
If I wanted to measure the variability of ______ , I would calculate ______.
A) individual scores (Xs); the standard error of the mean
B) sample means ; the standard error of the mean
C) sample means ; the standard deviation (s)
D) individual scores (Xs); the sample mean
A) individual scores (Xs); the standard error of the mean
B) sample means
; the standard error of the meanC) sample means
; the standard deviation (s)D) individual scores (Xs); the sample mean
Unlock Deck
Unlock for access to all 134 flashcards in this deck.
Unlock Deck
k this deck
62
In testing the mean of a sample, calculating a positive value of the t-statistic (t) necessarily implies ______.
A) the research hypothesis has been supported
B) you have done your calculations correctly (without making a mistake)
C) the value of the t-statistic falls in the region of rejection
D) the sample mean is greater than the hypothesized population mean
A) the research hypothesis has been supported
B) you have done your calculations correctly (without making a mistake)
C) the value of the t-statistic falls in the region of rejection
D) the sample mean is greater than the hypothesized population mean
Unlock Deck
Unlock for access to all 134 flashcards in this deck.
Unlock Deck
k this deck
63
In testing the mean of a sample, calculating a negative value of the t-statistic (t) indicates ______.
A) the sample mean is less than the hypothesized population mean
B) the score is less than the mean
C) is greater than
D) you have made an error in your calculations
A) the sample mean is less than the hypothesized population mean
B) the score is less than the mean
C)
is greater thanD) you have made an error in your calculations
Unlock Deck
Unlock for access to all 134 flashcards in this deck.
Unlock Deck
k this deck
64
In testing the mean of a sample, the sample mean is transformed into a t-statistic in order to ______.
A) determine the critical values
B) prove our research hypotheses
C) determine whether the alternative hypothesis (H1) should be one-tailed or two-tailed
D) determine the probability of obtaining the value of the sample mean
is transformed into a t-statistic in order to ______.A) determine the critical values
B) prove our research hypotheses
C) determine whether the alternative hypothesis (H1) should be one-tailed or two-tailed
D) determine the probability of obtaining the value of the sample mean
Unlock Deck
Unlock for access to all 134 flashcards in this deck.
Unlock Deck
k this deck
65
Holding all else constant, as sample size increases, the value of the standard error of the mean ______.
A) increases
B) decreases
C) stays the same
D) explodes
______.A) increases
B) decreases
C) stays the same
D) explodes
Unlock Deck
Unlock for access to all 134 flashcards in this deck.
Unlock Deck
k this deck
66
You collect data from a sample of 150 people, and calculate a mean of 6.87 and a standard deviation of 3.69. What is the value for the standard error of the mean ?
A) .30
B) 1.86
C) 6.87
D) 21.83
?A) .30
B) 1.86
C) 6.87
D) 21.83
Unlock Deck
Unlock for access to all 134 flashcards in this deck.
Unlock Deck
k this deck
67
Which of the following can be a negative number in testing the mean of a sample?
A) the degrees of freedom
B) the critical values
C) alpha
D) the standard error of the mean
A) the degrees of freedom
B) the critical values
C) alpha
D) the standard error of the mean
Unlock Deck
Unlock for access to all 134 flashcards in this deck.
Unlock Deck
k this deck
68
Looking at the degrees of freedom tells you something about ______.
A) the size of the sample
B) the directionality of the alternative hypothesis
C) the level of significance of a statistic
D) the research hypothesis
A) the size of the sample
B) the directionality of the alternative hypothesis
C) the level of significance of a statistic
D) the research hypothesis
Unlock Deck
Unlock for access to all 134 flashcards in this deck.
Unlock Deck
k this deck
69
Which of the following can be a negative number in testing the mean of a sample?
A) t
B) df
C)
D) α
A) t
B) df
C)
D) α
Unlock Deck
Unlock for access to all 134 flashcards in this deck.
Unlock Deck
k this deck
70
Looking at ______ for a statistic like a t-statistic provides an indication of the directionality of the alternative hypothesis.
A) the null hypothesis
B) alpha
C) the critical values
D) the sample size
A) the null hypothesis
B) alpha
C) the critical values
D) the sample size
Unlock Deck
Unlock for access to all 134 flashcards in this deck.
Unlock Deck
k this deck
71
Which of the following would be the most accurate way to report the following z-test?
A) z = 2.55 < 2.58 ; p < .01
B) z = 2.55 < 2.58 ; p > .05
C) z = 2.55 < 2.58 ; p < .05
D) z = 2.55 < 2.58 ; p > .01
A) z = 2.55 < 2.58 ; p < .01
B) z = 2.55 < 2.58 ; p > .05
C) z = 2.55 < 2.58 ; p < .05
D) z = 2.55 < 2.58 ; p > .01
Unlock Deck
Unlock for access to all 134 flashcards in this deck.
Unlock Deck
k this deck
72
Looking at the ______ for a statistic like a t-statistic provides an indication of the sample size in a study.
A) research hypothesis
B) null hypothesis
C) degrees of freedom
D) alternative hypothesis
A) research hypothesis
B) null hypothesis
C) degrees of freedom
D) alternative hypothesis
Unlock Deck
Unlock for access to all 134 flashcards in this deck.
Unlock Deck
k this deck
73
Looking at the degrees of freedom for a statistic like a t-statistic provides information regarding ______.
A) the size of the sample
B) the sample mean
C) whether alpha is one-tailed or two-tailed
D) the population mean (μ)
A) the size of the sample
B) the sample mean
C) whether alpha is one-tailed or two-tailed
D) the population mean (μ)
Unlock Deck
Unlock for access to all 134 flashcards in this deck.
Unlock Deck
k this deck
74
You collect data from a sample of 150 people and calculate a mean of 6.87 and a standard deviation of 3.69. What is the value for the standard error of the mean ?
A) .16
B) .30
C) 3.69
D) 12.24
?A) .16
B) .30
C) 3.69
D) 12.24
Unlock Deck
Unlock for access to all 134 flashcards in this deck.
Unlock Deck
k this deck
75
In testing the mean of a sample, the sample mean is transformed into a ______ statistic in order to ______.
A) z; decide whether to set alpha at .05 or .01
B) t; determine the probability of a sample mean
C) z; determine the critical values
D) t; determine whether the distribution of sample means is normal
is transformed into a ______ statistic in order to ______.A) z; decide whether to set alpha at .05 or .01
B) t; determine the probability of a sample mean
C) z; determine the critical values
D) t; determine whether the distribution of sample means is normal
Unlock Deck
Unlock for access to all 134 flashcards in this deck.
Unlock Deck
k this deck
76
A ______ can represent the variability of ______.
A) standard deviation; sample means
B) standard deviation; differences between two sample means
C) standard error; individual scores (X)
D) standard error; sample means
A) standard deviation; sample means
B) standard deviation; differences between two sample means
C) standard error; individual scores (X)
D) standard error; sample means
Unlock Deck
Unlock for access to all 134 flashcards in this deck.
Unlock Deck
k this deck
77
Reporting the results of a z-test results typically includes all of the following EXCEPT ______.
A) the variable analyzed
B) the standard error of the sample mean
C) the sample and population means
D) the level of significance
A) the variable analyzed
B) the standard error of the sample mean
C) the sample and population means
D) the level of significance
Unlock Deck
Unlock for access to all 134 flashcards in this deck.
Unlock Deck
k this deck
78
From data collected from a sample of 100 people, you obtain a mean of 16.27 and a standard deviation of 4.56. What is the value for the standard error of the mean ?
A) .46
B) .05
C) .16
D) 4.56
?A) .46
B) .05
C) .16
D) 4.56
Unlock Deck
Unlock for access to all 134 flashcards in this deck.
Unlock Deck
k this deck
79
If I wanted to estimate the variability of sample means , I would calculate ______.
A) the standard error of the mean
B) the standard deviation (s)
C) z-scores
D) the population mean (μ)
, I would calculate ______.A) the standard error of the mean
B) the standard deviation (s)
C) z-scores
D) the population mean (μ)
Unlock Deck
Unlock for access to all 134 flashcards in this deck.
Unlock Deck
k this deck
80
If I wanted to measure the variability in a set of scores (Xs), I would calculate ______.
A) the standard error of the mean
B) the standard deviation (s)
C) z-scores
D) the t-statistic
A) the standard error of the mean
B) the standard deviation (s)
C) z-scores
D) the t-statistic
Unlock Deck
Unlock for access to all 134 flashcards in this deck.
Unlock Deck
k this deck
Unlock Deck
Unlock for access to all 134 flashcards in this deck.


