Deck 15: The Nature of Graphs and Functions
Full screen (f)
Question
Is the set a function?
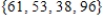
Answer yes or no.
Answer yes or no.
Question
Find the difference quotient, 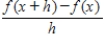 for the function given below.

for the function given below.
Question
Question
Find the difference quotient,  for the given function.
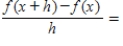 __________
for the given function. __________ Question
If  , find h(3.8).
A)
B) 
C) 
D) 
E) 
, find h(3.8). A)
B)
C)
D)
E)
Question
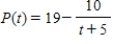
It is estimated that t years from now, the population of a certain suburban community will be 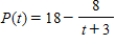
Thousand people. What will the population of the community be 7 years from now?
A)
B) 
C) 
D) 
E) 
Thousand people. What will the population of the community be 7 years from now?
A)
B)
C)
D)
E)
Question
If  , find h(3.5). Round to two decimal places.
 __________
, find h(3.5). Round to two decimal places.
__________ Question
Is the set a function? 
A) function
B) not a function
A) function
B) not a function
Question
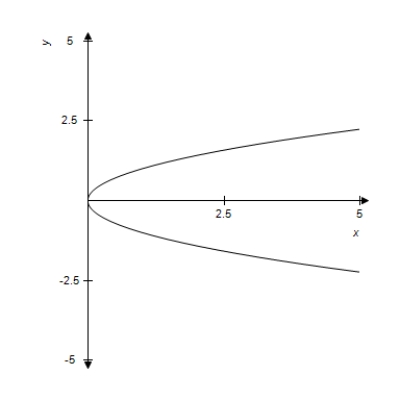
Use the vertical line test to determine whether the curve is a function.
A) not a function
B) function
A) not a function
B) function
Question
For the given verbal description, write a rule in the form of an equation.
For each number x in the domain, the corresponding range value y is found by multiplying by 2 and then subtracting 7.
A)
B) 
C) 
D) 
E) 
For each number x in the domain, the corresponding range value y is found by multiplying by 2 and then subtracting 7.
A)
B)
C)
D)
E)
Question
Find the difference quotient,  for the given function.
A)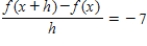
B) 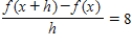
C) 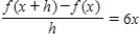
D) 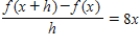
E) 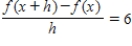
for the given function. A)
B)
C)
D)
E)
Question
It is estimated that t years from now, the population of a certain suburban community will be
thousand people. What will the population of the community be 5 years from now?
 __________ people
thousand people. What will the population of the community be 5 years from now?
__________ people Question
Question
Sketch the parabola that has a distance between the directrix and its focus to be 4 units.
A) 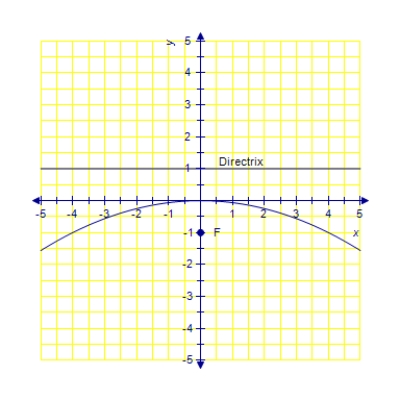
B)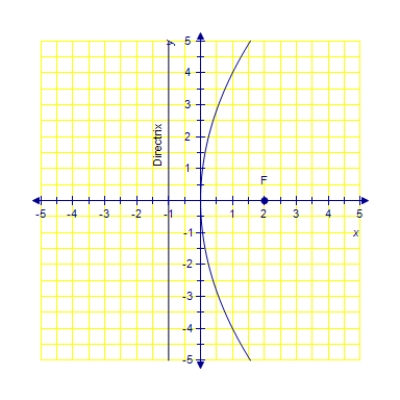
C)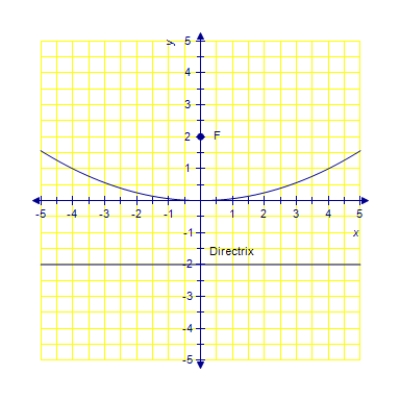
D) 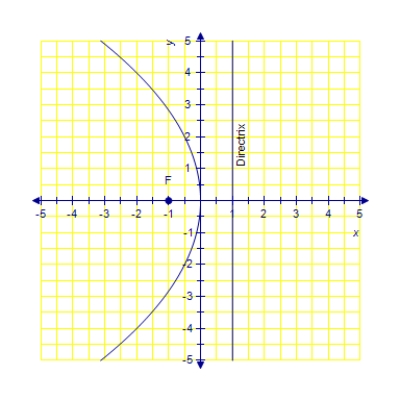
A)
B)
C)
D)
Question
Let P(x) be the number of prime numbers less than x. Find P(18).
A)
B) 
C) 
D) 
E) 
A)
B)
C)
D)
E)
Question
Find the difference quotient,  for the function given below.
A)
B) 
C) 
D) 
E) 
for the function given below. A)
B)
C)
D)
E)
Question
Use the vertical line test to determine whether the curve is a function.
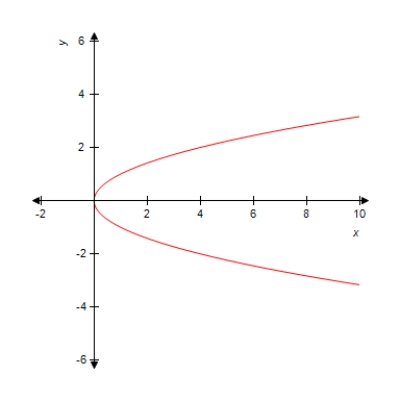
The curve is __________ (a function, not a function).
The curve is __________ (a function, not a function).
Question
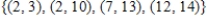
Is the set of ordered pairs a function? 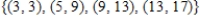
A) function
B) not a function
A) function
B) not a function
Question
If  , list conditions on the constants to assure that the graph of a line results.
A) A and C have same signs
B) A = 0 and C = 0
C) A > C
D) A and C have opposite signs
E) A = C
, list conditions on the constants to assure that the graph of a line results. A) A and C have same signs
B) A = 0 and C = 0
C) A > C
D) A and C have opposite signs
E) A = C
Question
Is the set of ordered pairs a function?
Answer yes or no.
Answer yes or no.
Question
If  , match each condition on the constants to the appropriate graph of the curve.
a. b.
b.  and
and  c.
c.  and
and  have opposite signs
d. and
and  have same signs
an ellipse
, match each condition on the constants to the appropriate graph of the curve.
a.
b. and c. and have opposite signsd.
and have same signsan ellipse
Question
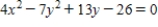
Identify the curve.
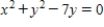
This curve is __________ (parabola, line, circle, hyperbola).
This curve is __________ (parabola, line, circle, hyperbola).
Question
Sketch the graph of the equation. 
A)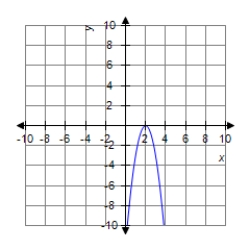
B) 
C) 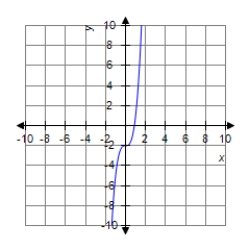
D) 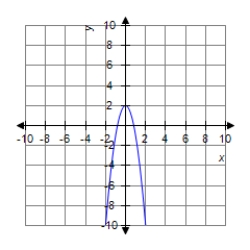
A)
B)
C)
D)
Question
Sketch the curve. 
A)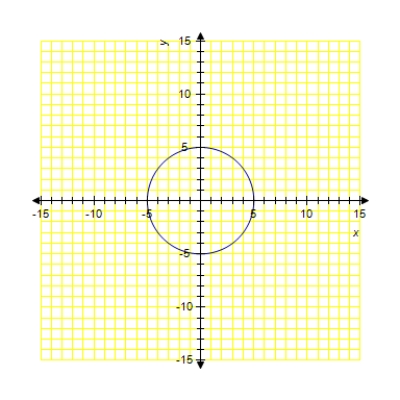
B)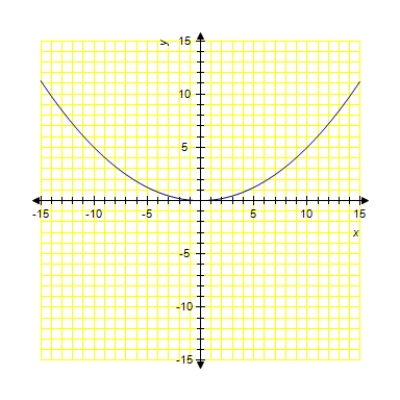
C)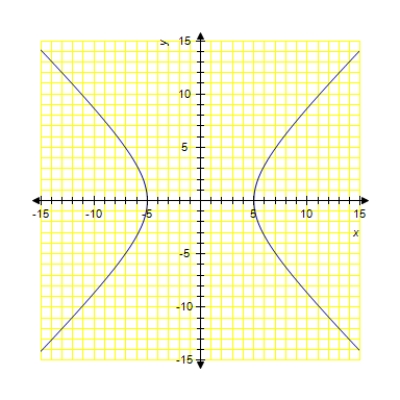
D)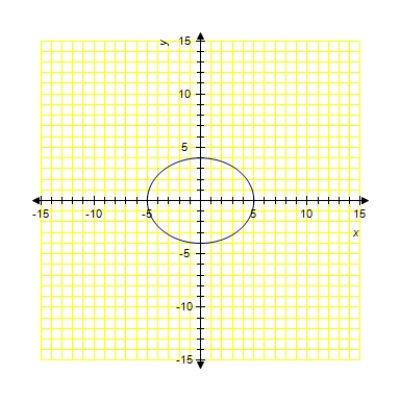
A)
B)
C)
D)
Question
If , match each condition on the constants to the appropriate graph of the curve.
a. b. and c. and have opposite signs
d. and have same signs
a line
, match each condition on the constants to the appropriate graph of the curve.
a.
b. and c. and have opposite signsd.
and have same signsa line
Question
A parabolic archway has the dimensions shown in the figure. Find the equation of the parabolic portion.
 ft,
ft,  ft,
ft,  ft,
ft,  ft
ft
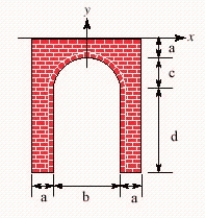
ft, ft, ft, ft
Question
Sketch the graph of the equation. 
A) 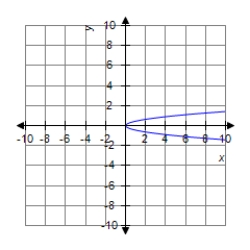
B)
C)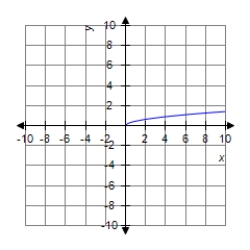
D)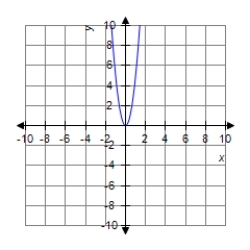
A)
B)
C)
D)
Question
Identify the curve.
This curve is __________ (line, circle, parabola, hyperbola).
This curve is __________ (line, circle, parabola, hyperbola).
Question
Sketch the curve.

A)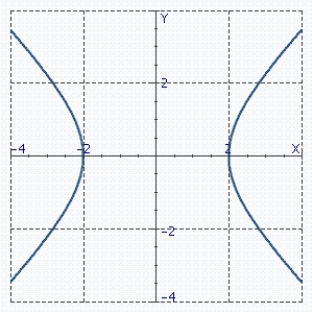
B)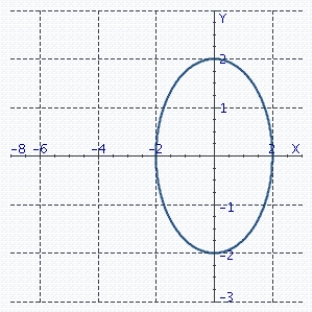
C)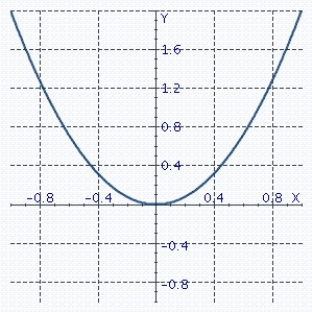
D)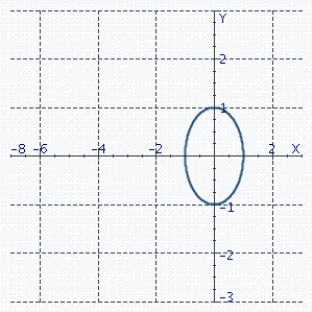
A)
B)
C)
D)
Question
Sketch the curve.

A)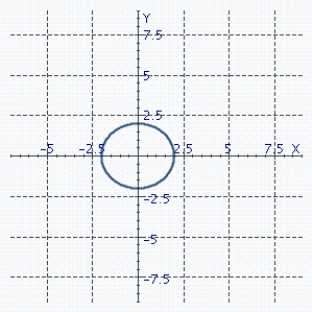
B)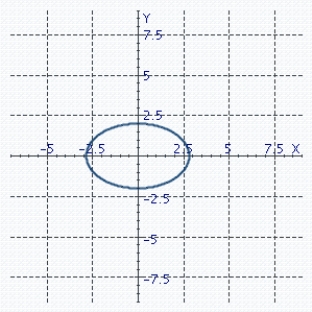
C)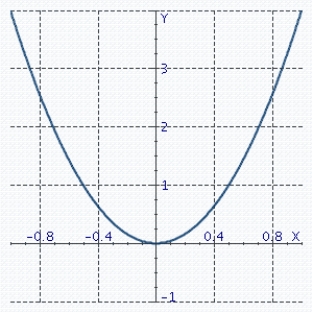
D)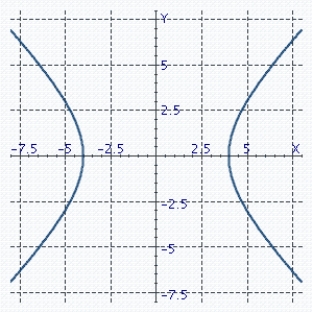
A)
B)
C)
D)
Question
If , match each condition on the constants to the appropriate graph of the curve.
a. b. and c. and have opposite signs
d. and have same signs
a circle
, match each condition on the constants to the appropriate graph of the curve.
a.
b. and c. and have opposite signsd.
and have same signsa circle
Question
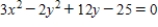
Identify the curve.
A) line
B) hyperbola
C) circle
D) no graph
E) parabola
A) line
B) hyperbola
C) circle
D) no graph
E) parabola
Question
If , match each condition on the constants to the appropriate graph of the curve.
a. b. and c. and have opposite signs
d. and have same signs
a hyperbola
, match each condition on the constants to the appropriate graph of the curve.
a.
b. and c. and have opposite signsd.
and have same signsa hyperbola
Question
Identify the curve. 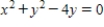
A) point
B) hyperbola
C) parabola
D) circle
E) line
A) point
B) hyperbola
C) parabola
D) circle
E) line
Question
Beams of light parallel to the axis of the parabolic mirror shown in the figure strike the mirror and are reflected. Find the distance from the vertex to the point where the beams concentrate.
A = 12 ft, b = 8 ft
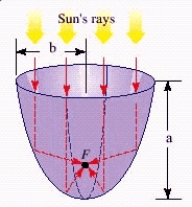
A) The focus is 32 in. from the vertex on the axis of the parabola.
B) The focus is 16 in. from the vertex on the axis of the parabola.
C) The focus is 12 in. from the vertex on the axis of the parabola.
D) The focus is 8 in. from the vertex on the axis of the parabola.
A = 12 ft, b = 8 ft
A) The focus is 32 in. from the vertex on the axis of the parabola.
B) The focus is 16 in. from the vertex on the axis of the parabola.
C) The focus is 12 in. from the vertex on the axis of the parabola.
D) The focus is 8 in. from the vertex on the axis of the parabola.
Question
Sketch the hyperbola with distance between the foci 10 units and the difference of the distances 6 units.
A)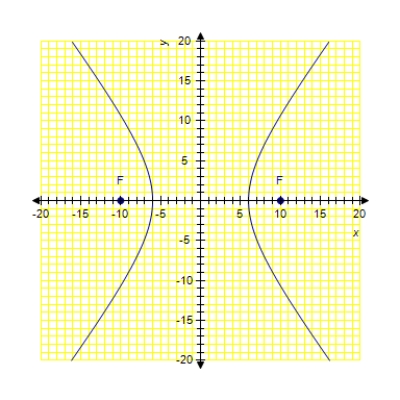
B)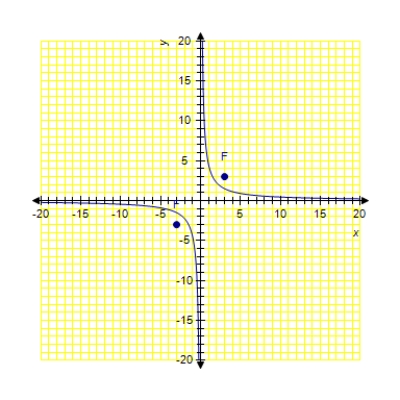
C)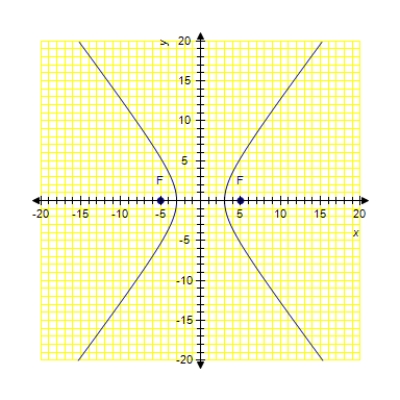
D)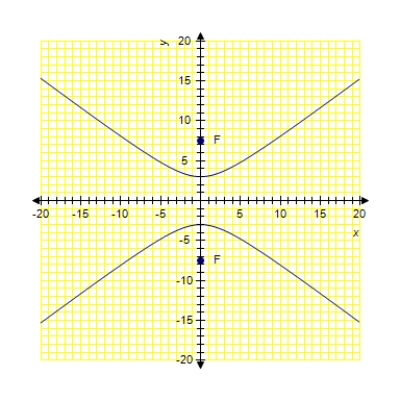
A)
B)
C)
D)
Question
Sketch the graph of the equation. 
A)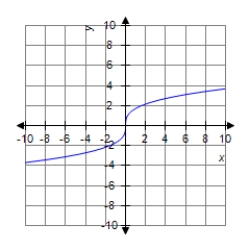
B)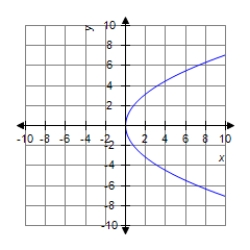
C)
D)
A)
B)
C)
D)
Question
Beams of light parallel to the axis of the parabolic mirror shown in the figure strike the mirror and are reflected. Find the distance from the vertex to the point where the beams concentrate.
 ft,
ft,  ft
ft

The focus is __________ in. from the vertex on the axis of the parabola.
ft, ft
The focus is __________ in. from the vertex on the axis of the parabola.
Question
A parabolic archway has the dimensions shown in the figure. Find the equation of the parabolic portion.  ft,
ft,  ft,
ft,  ft,
ft,  ft
ft

A)
B)
C)
D)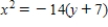
ft, ft, ft, ft
A)
B)
C)
D)
Question
Sketch the graph of the equation. 
A)
B)
C)
D)
A)
B)
C)
D)
Question
State whether the statement is true or false.
The test point satisfies the inequality
  .
.
The test point
satisfies the inequality . Question
State whether the statement is true or false.
The test point satisfies the inequality
  .
.
The test point
satisfies the inequality . Question
State whether the statement is true or false.
The test point satisfies the inequality
  .
.
The test point
satisfies the inequality . Question
Find three ordered pairs that satisfy the equation. 
A) (0 , 8), (1, 12), (2, 13)
B) (0 ,8) , (1, 9), (2, 10)
C) (0, 8), (1, 9), (2, 13)
D) (0, 8), (1, 12), (2, 10)
E) (1, 8), (2, 9), (3, 10)
A) (0 , 8), (1, 12), (2, 13)
B) (0 ,8) , (1, 9), (2, 10)
C) (0, 8), (1, 9), (2, 13)
D) (0, 8), (1, 12), (2, 10)
E) (1, 8), (2, 9), (3, 10)
Question
Sketch the graph of the equation. 
A) 
B) 
C) 
D) 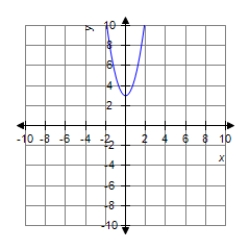
A)
B)
C)
D)
Question
Graph the first-degree inequality in two unknowns. 
A)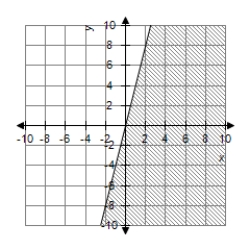
B)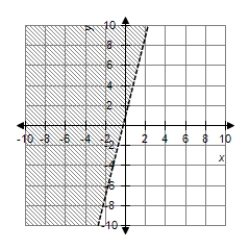
C)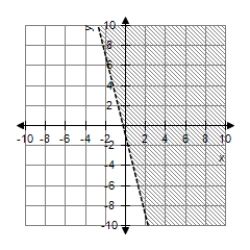
D)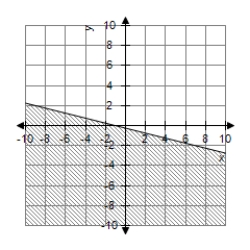
A)
B)
C)
D)
Question
Graph the first-degree inequality in two unknowns. 
A)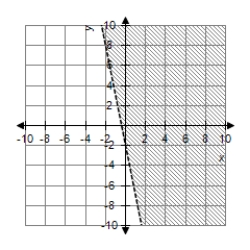
B)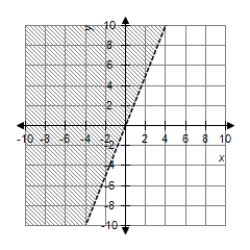
C)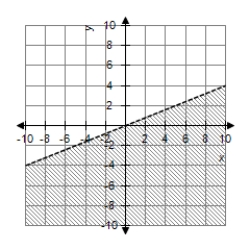
D)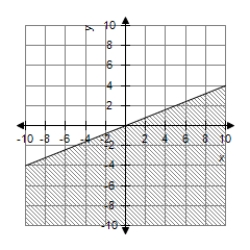
A)
B)
C)
D)
Question
Graph the first-degree inequality in two unknowns. 
A)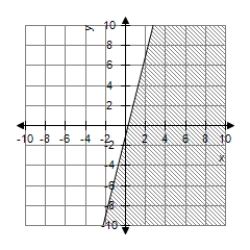
B)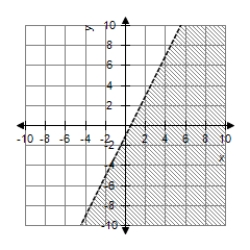
C)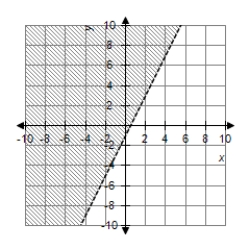
D)
A)
B)
C)
D)
Question
Graph the first-degree inequality in two unknowns. 
A)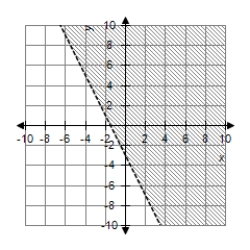
B)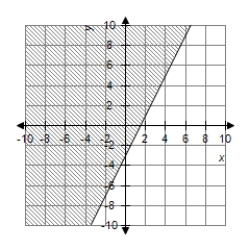
C)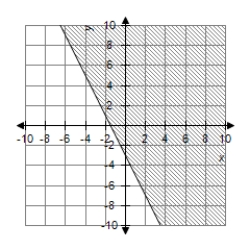
D) 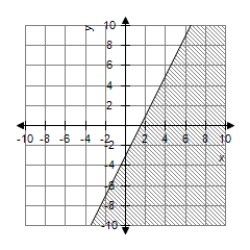
A)
B)
C)
D)
Question
Sketch the graph of the equation. 
A) 
B) 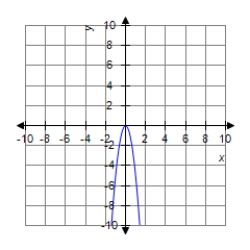
C) 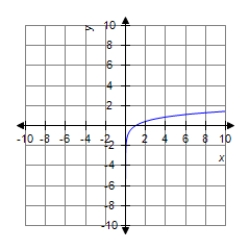
D)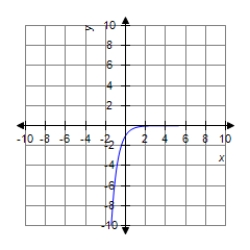
A)
B)
C)
D)
Question
State whether the statement is true or false.
The test point satisfies the inequality
  .
.
The test point
satisfies the inequality . Question
A learning curve describes the rate at which a person learns certain specific tasks. If N is the number of words per minute typed by a student. So for an average student 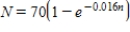
Where n is the number of days of instruction. What does the graph of this formula look like?
A)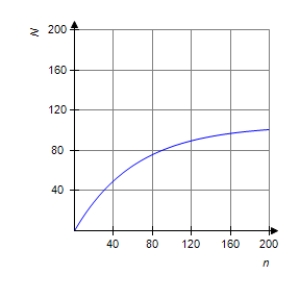
B)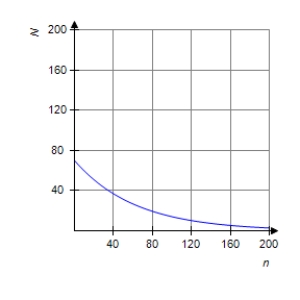
C)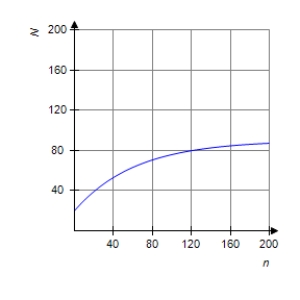
D)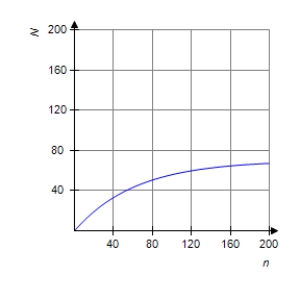
Where n is the number of days of instruction. What does the graph of this formula look like?
A)
B)
C)
D)
Question
Sketch the graph of the equation. 
A) 
B) 
C)
D) 
A)
B)
C)
D)
Question
State whether the statement is true or false.
The test point (02, 3) satisfies the inequality .
.
The test point (02, 3) satisfies the inequality
.
Question
Graph the first-degree inequality in two unknowns. 
A)
B)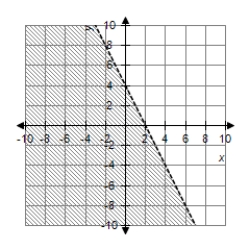
C)
D)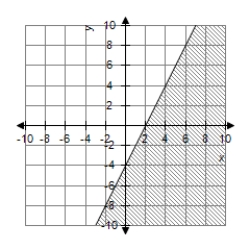
A)
B)
C)
D)
Question
State whether the statement is true or false.
The test point (0, 0) satisfies the inequality
 .
.
The test point (0, 0) satisfies the inequality
.
Question
State whether the statement is true or false.
The test point (0, 0) satisfies the inequality
 .
.
The test point (0, 0) satisfies the inequality
.
Question
State whether the statement is true or false.
The test point (-8, 9) satisfies the inequality .
.
The test point (-8, 9) satisfies the inequality
.
Question
The healing law for skin wounds states that 
Where A is the number of square centimeters of unhealed skin after t days when the original area of the wound was A 0 . Graph the healing curve for a wound of 50 cm 2 .
A)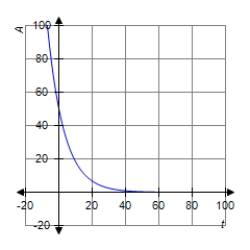
B) 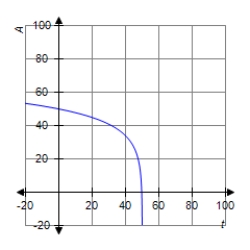
C) 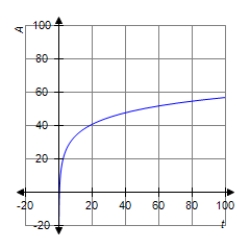
D) 
Where A is the number of square centimeters of unhealed skin after t days when the original area of the wound was A 0 . Graph the healing curve for a wound of 50 cm 2 .
A)
B)
C)
D)
Question
Graph the first-degree inequality in two unknowns. 
A)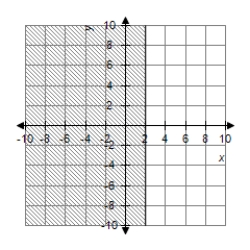
B)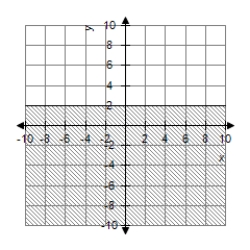
C)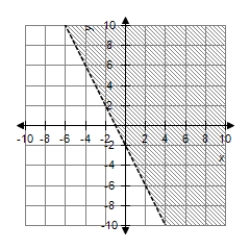
D)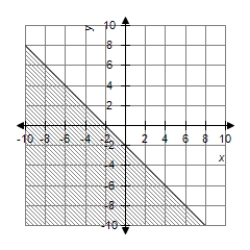
A)
B)
C)
D)
Question
Find three ordered pairs that satisfy the equation.

Question
Graph the line. 
A)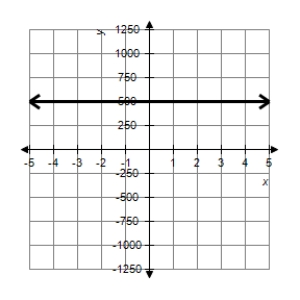
B)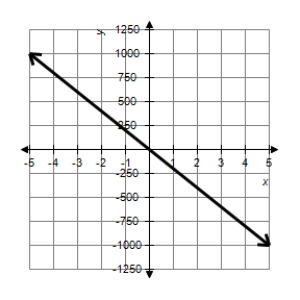
C)
D)
E)
A)
B)
C)
D)
E)
Question
Graph the line. 
A)
B)
C)
D)
E)
A)
B)
C)
D)
E)
Question
Graph the line passing through (1, 3) with slope m = 1.5.
A)
B)
C)
D)
A)
B)
C)
D)
Question
If a present value P is invested at the simple interest rate r for t years, then the future value after t years is given by the formula  . Suppose you invest $15,000 at 8% simple interest per year. Graph the amount you will have in t years. What is the slope of the graph?
A) m = 1,200
B) m = 108
C) m = 1,340
D) m = 1,070
E) m = 1,270
. Suppose you invest $15,000 at 8% simple interest per year. Graph the amount you will have in t years. What is the slope of the graph? A) m = 1,200
B) m = 108
C) m = 1,340
D) m = 1,070
E) m = 1,270
Question
Graph the line passing through (-2, 2) with slope m = 1.
A)
B)
C)
D)
A)
B)
C)
D)
Question
Find three ordered pairs that satisfy the equation. 
A) (0, 4), (1, 8), (2, 8)
B) (0, 4), (1, 8), (2, 6)
C) (0, 4), (1, 6), (2, 8)
D) (0, 4), (1, 6), (2, 6)
E) (0, 4), (1, 6), (2, 16)
A) (0, 4), (1, 8), (2, 8)
B) (0, 4), (1, 8), (2, 6)
C) (0, 4), (1, 6), (2, 8)
D) (0, 4), (1, 6), (2, 6)
E) (0, 4), (1, 6), (2, 16)
Question
A business purchasing an item for business purposes may use straight-line depreciation to obtain a tax deduction. The formula for the present value, P, after t years is given below, where C is the cost and s is the scrap value after L years. The number L is called the useful life of the item. 
If a certain piece of equipment costs $4,100 and has a scrap value of $1,700 after 5 years, write an equation to represent the present value after t years.
A)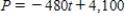
B)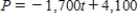
C)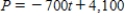
D)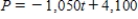
E)
If a certain piece of equipment costs $4,100 and has a scrap value of $1,700 after 5 years, write an equation to represent the present value after t years.
A)
B)
C)
D)
E)
Question
A business purchasing an item for business purposes may use straight-line depreciation to obtain a tax deduction. The formula for the present value, P, after t years is given below, where C is the cost and s is the scrap value after L years. The number L is called the useful life of the item.
If a certain piece of equipment costs $10,100 and has a scrap value of $1,700 after 8 years, graph the amount you will have in t years. What is the slope of the graph?
 __________
If a certain piece of equipment costs $10,100 and has a scrap value of $1,700 after 8 years, graph the amount you will have in t years. What is the slope of the graph?
__________ Question
A business purchasing an item for business purposes may use straight-line depreciation to obtain a tax deduction. The formula for the present value, P, after t years is given below, where C is the cost and s is the scrap value after L years. The number L is called the useful life of the item.

If a certain piece of equipment costs $8,100 and has a scrap value of $2,100 after 10 years, write an equation to represent the present value after t years.
If a certain piece of equipment costs $8,100 and has a scrap value of $2,100 after 10 years, write an equation to represent the present value after t years.
Question
Graph the line. 
A)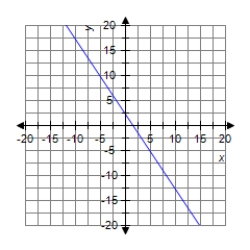
B)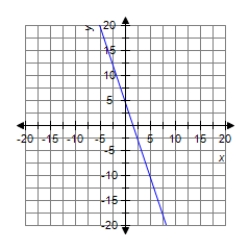
C)
D) 
A)
B)
C)
D)
Question
Find three ordered pairs that satisfy the equation.

Question
Graph the line. 
A)
B)
C)
D)
A)
B)
C)
D)
Question
A business purchasing an item for business purposes may use straight-line depreciation to obtain a tax deduction. The formula for the present value, P, after t years is given below, where C is the cost and s is the scrap value after L years. The number L is called the useful life of the item. 
If a certain piece of equipment costs $6,100 and has a scrap value of $2,300 after 5 years, graph the amount you will have in t years. What is the slope of the graph?
A)
B)
C)
D)
E)
If a certain piece of equipment costs $6,100 and has a scrap value of $2,300 after 5 years, graph the amount you will have in t years. What is the slope of the graph?
A)
B)
C)
D)
E)

Unlock Deck
Sign up to unlock the cards in this deck!
Unlock Deck
Unlock Deck
1/74
Play
Full screen (f)
Deck 15: The Nature of Graphs and Functions
1
Is the set a function?
Answer yes or no.
Answer yes or no.
no
2
Find the difference quotient, for the function given below.
for the function given below.

3
Let P(x) be the number of prime numbers less than x. Find P(14).
P(14) = __________
P(14) = __________
6
4
Find the difference quotient, for the given function. __________
for the given function. __________ Unlock Deck
Unlock for access to all 74 flashcards in this deck.
Unlock Deck
k this deck
5
If , find h(3.8).
A)
B)
C)
D)
E)
, find h(3.8). A)
B)
C)
D)
E)
Unlock Deck
Unlock for access to all 74 flashcards in this deck.
Unlock Deck
k this deck
6
It is estimated that t years from now, the population of a certain suburban community will be
Thousand people. What will the population of the community be 7 years from now?
A)
B)
C)
D)
E)
Thousand people. What will the population of the community be 7 years from now?
A)
B)
C)
D)
E)
Unlock Deck
Unlock for access to all 74 flashcards in this deck.
Unlock Deck
k this deck
7
If , find h(3.5). Round to two decimal places.
__________
, find h(3.5). Round to two decimal places.
__________ Unlock Deck
Unlock for access to all 74 flashcards in this deck.
Unlock Deck
k this deck
8
Is the set a function?
A) function
B) not a function
A) function
B) not a function
Unlock Deck
Unlock for access to all 74 flashcards in this deck.
Unlock Deck
k this deck
9
Use the vertical line test to determine whether the curve is a function.
A) not a function
B) function
A) not a function
B) function
Unlock Deck
Unlock for access to all 74 flashcards in this deck.
Unlock Deck
k this deck
10
For the given verbal description, write a rule in the form of an equation.
For each number x in the domain, the corresponding range value y is found by multiplying by 2 and then subtracting 7.
A)
B)
C)
D)
E)
For each number x in the domain, the corresponding range value y is found by multiplying by 2 and then subtracting 7.
A)
B)
C)
D)
E)
Unlock Deck
Unlock for access to all 74 flashcards in this deck.
Unlock Deck
k this deck
11
Find the difference quotient, for the given function.
A)
B)
C)
D)
E)
for the given function. A)
B)
C)
D)
E)
Unlock Deck
Unlock for access to all 74 flashcards in this deck.
Unlock Deck
k this deck
12
It is estimated that t years from now, the population of a certain suburban community will be
thousand people. What will the population of the community be 5 years from now?
__________ people
thousand people. What will the population of the community be 5 years from now?
__________ people Unlock Deck
Unlock for access to all 74 flashcards in this deck.
Unlock Deck
k this deck
13
For the given verbal description, write a rule in the form of an equation.
For each number x in the domain, the corresponding range value y is found by multiplying by 5 and then subtracting 4.
For each number x in the domain, the corresponding range value y is found by multiplying by 5 and then subtracting 4.
Unlock Deck
Unlock for access to all 74 flashcards in this deck.
Unlock Deck
k this deck
14
Sketch the parabola that has a distance between the directrix and its focus to be 4 units.
A)
B)
C)
D)
A)
B)
C)
D)
Unlock Deck
Unlock for access to all 74 flashcards in this deck.
Unlock Deck
k this deck
15
Let P(x) be the number of prime numbers less than x. Find P(18).
A)
B)
C)
D)
E)
A)
B)
C)
D)
E)
Unlock Deck
Unlock for access to all 74 flashcards in this deck.
Unlock Deck
k this deck
16
Find the difference quotient, for the function given below.
A)
B)
C)
D)
E)
for the function given below. A)
B)
C)
D)
E)
Unlock Deck
Unlock for access to all 74 flashcards in this deck.
Unlock Deck
k this deck
17
Use the vertical line test to determine whether the curve is a function.
The curve is __________ (a function, not a function).
The curve is __________ (a function, not a function).
Unlock Deck
Unlock for access to all 74 flashcards in this deck.
Unlock Deck
k this deck
18
Is the set of ordered pairs a function?
A) function
B) not a function
A) function
B) not a function
Unlock Deck
Unlock for access to all 74 flashcards in this deck.
Unlock Deck
k this deck
19
If , list conditions on the constants to assure that the graph of a line results.
A) A and C have same signs
B) A = 0 and C = 0
C) A > C
D) A and C have opposite signs
E) A = C
, list conditions on the constants to assure that the graph of a line results. A) A and C have same signs
B) A = 0 and C = 0
C) A > C
D) A and C have opposite signs
E) A = C
Unlock Deck
Unlock for access to all 74 flashcards in this deck.
Unlock Deck
k this deck
20
Is the set of ordered pairs a function?
Answer yes or no.
Answer yes or no.
Unlock Deck
Unlock for access to all 74 flashcards in this deck.
Unlock Deck
k this deck
21
If , match each condition on the constants to the appropriate graph of the curve.
a. b. and c. and have opposite signs
d. and have same signs
an ellipse
, match each condition on the constants to the appropriate graph of the curve.
a.
b. and c. and have opposite signsd.
and have same signsan ellipse
Unlock Deck
Unlock for access to all 74 flashcards in this deck.
Unlock Deck
k this deck
22
Identify the curve.
This curve is __________ (parabola, line, circle, hyperbola).
This curve is __________ (parabola, line, circle, hyperbola).
Unlock Deck
Unlock for access to all 74 flashcards in this deck.
Unlock Deck
k this deck
23
Sketch the graph of the equation.
A)
B)
C)
D)
A)
B)
C)
D)
Unlock Deck
Unlock for access to all 74 flashcards in this deck.
Unlock Deck
k this deck
24
Sketch the curve.
A)
B)
C)
D)
A)
B)
C)
D)
Unlock Deck
Unlock for access to all 74 flashcards in this deck.
Unlock Deck
k this deck
25
If , match each condition on the constants to the appropriate graph of the curve.
a. b. and c. and have opposite signs
d. and have same signs
a line
, match each condition on the constants to the appropriate graph of the curve.
a.
b. and c. and have opposite signsd.
and have same signsa line
Unlock Deck
Unlock for access to all 74 flashcards in this deck.
Unlock Deck
k this deck
26
A parabolic archway has the dimensions shown in the figure. Find the equation of the parabolic portion.
ft, ft, ft, ft
ft, ft, ft, ft
Unlock Deck
Unlock for access to all 74 flashcards in this deck.
Unlock Deck
k this deck
27
Sketch the graph of the equation.
A)
B)
C)
D)
A)
B)
C)
D)
Unlock Deck
Unlock for access to all 74 flashcards in this deck.
Unlock Deck
k this deck
28
Identify the curve.
This curve is __________ (line, circle, parabola, hyperbola).
This curve is __________ (line, circle, parabola, hyperbola).
Unlock Deck
Unlock for access to all 74 flashcards in this deck.
Unlock Deck
k this deck
29
Sketch the curve.
A)
B)
C)
D)
A)
B)
C)
D)
Unlock Deck
Unlock for access to all 74 flashcards in this deck.
Unlock Deck
k this deck
30
Sketch the curve.
A)
B)
C)
D)
A)
B)
C)
D)
Unlock Deck
Unlock for access to all 74 flashcards in this deck.
Unlock Deck
k this deck
31
If , match each condition on the constants to the appropriate graph of the curve.
a. b. and c. and have opposite signs
d. and have same signs
a circle
, match each condition on the constants to the appropriate graph of the curve.
a.
b. and c. and have opposite signsd.
and have same signsa circle
Unlock Deck
Unlock for access to all 74 flashcards in this deck.
Unlock Deck
k this deck
32
Identify the curve.
A) line
B) hyperbola
C) circle
D) no graph
E) parabola
A) line
B) hyperbola
C) circle
D) no graph
E) parabola
Unlock Deck
Unlock for access to all 74 flashcards in this deck.
Unlock Deck
k this deck
33
If , match each condition on the constants to the appropriate graph of the curve.
a. b. and c. and have opposite signs
d. and have same signs
a hyperbola
, match each condition on the constants to the appropriate graph of the curve.
a.
b. and c. and have opposite signsd.
and have same signsa hyperbola
Unlock Deck
Unlock for access to all 74 flashcards in this deck.
Unlock Deck
k this deck
34
Identify the curve.
A) point
B) hyperbola
C) parabola
D) circle
E) line
A) point
B) hyperbola
C) parabola
D) circle
E) line
Unlock Deck
Unlock for access to all 74 flashcards in this deck.
Unlock Deck
k this deck
35
Beams of light parallel to the axis of the parabolic mirror shown in the figure strike the mirror and are reflected. Find the distance from the vertex to the point where the beams concentrate.
A = 12 ft, b = 8 ft
A) The focus is 32 in. from the vertex on the axis of the parabola.
B) The focus is 16 in. from the vertex on the axis of the parabola.
C) The focus is 12 in. from the vertex on the axis of the parabola.
D) The focus is 8 in. from the vertex on the axis of the parabola.
A = 12 ft, b = 8 ft
A) The focus is 32 in. from the vertex on the axis of the parabola.
B) The focus is 16 in. from the vertex on the axis of the parabola.
C) The focus is 12 in. from the vertex on the axis of the parabola.
D) The focus is 8 in. from the vertex on the axis of the parabola.
Unlock Deck
Unlock for access to all 74 flashcards in this deck.
Unlock Deck
k this deck
36
Sketch the hyperbola with distance between the foci 10 units and the difference of the distances 6 units.
A)
B)
C)
D)
A)
B)
C)
D)
Unlock Deck
Unlock for access to all 74 flashcards in this deck.
Unlock Deck
k this deck
37
Sketch the graph of the equation.
A)
B)
C)
D)
A)
B)
C)
D)
Unlock Deck
Unlock for access to all 74 flashcards in this deck.
Unlock Deck
k this deck
38
Beams of light parallel to the axis of the parabolic mirror shown in the figure strike the mirror and are reflected. Find the distance from the vertex to the point where the beams concentrate.
ft, ft
The focus is __________ in. from the vertex on the axis of the parabola.
ft, ft
The focus is __________ in. from the vertex on the axis of the parabola.
Unlock Deck
Unlock for access to all 74 flashcards in this deck.
Unlock Deck
k this deck
39
A parabolic archway has the dimensions shown in the figure. Find the equation of the parabolic portion. ft, ft, ft, ft
A)
B)
C)
D)
ft, ft, ft, ft
A)
B)
C)
D)
Unlock Deck
Unlock for access to all 74 flashcards in this deck.
Unlock Deck
k this deck
40
Sketch the graph of the equation.
A)
B)
C)
D)
A)
B)
C)
D)
Unlock Deck
Unlock for access to all 74 flashcards in this deck.
Unlock Deck
k this deck
41
State whether the statement is true or false.
The test point satisfies the inequality .
The test point
satisfies the inequality . Unlock Deck
Unlock for access to all 74 flashcards in this deck.
Unlock Deck
k this deck
42
State whether the statement is true or false.
The test point satisfies the inequality .
The test point
satisfies the inequality . Unlock Deck
Unlock for access to all 74 flashcards in this deck.
Unlock Deck
k this deck
43
State whether the statement is true or false.
The test point satisfies the inequality .
The test point
satisfies the inequality . Unlock Deck
Unlock for access to all 74 flashcards in this deck.
Unlock Deck
k this deck
44
Find three ordered pairs that satisfy the equation.
A) (0 , 8), (1, 12), (2, 13)
B) (0 ,8) , (1, 9), (2, 10)
C) (0, 8), (1, 9), (2, 13)
D) (0, 8), (1, 12), (2, 10)
E) (1, 8), (2, 9), (3, 10)
A) (0 , 8), (1, 12), (2, 13)
B) (0 ,8) , (1, 9), (2, 10)
C) (0, 8), (1, 9), (2, 13)
D) (0, 8), (1, 12), (2, 10)
E) (1, 8), (2, 9), (3, 10)
Unlock Deck
Unlock for access to all 74 flashcards in this deck.
Unlock Deck
k this deck
45
Sketch the graph of the equation.
A)
B)
C)
D)
A)
B)
C)
D)
Unlock Deck
Unlock for access to all 74 flashcards in this deck.
Unlock Deck
k this deck
46
Graph the first-degree inequality in two unknowns.
A)
B)
C)
D)
A)
B)
C)
D)
Unlock Deck
Unlock for access to all 74 flashcards in this deck.
Unlock Deck
k this deck
47
Graph the first-degree inequality in two unknowns.
A)
B)
C)
D)
A)
B)
C)
D)
Unlock Deck
Unlock for access to all 74 flashcards in this deck.
Unlock Deck
k this deck
48
Graph the first-degree inequality in two unknowns.
A)
B)
C)
D)
A)
B)
C)
D)
Unlock Deck
Unlock for access to all 74 flashcards in this deck.
Unlock Deck
k this deck
49
Graph the first-degree inequality in two unknowns.
A)
B)
C)
D)
A)
B)
C)
D)
Unlock Deck
Unlock for access to all 74 flashcards in this deck.
Unlock Deck
k this deck
50
Sketch the graph of the equation.
A)
B)
C)
D)
A)
B)
C)
D)
Unlock Deck
Unlock for access to all 74 flashcards in this deck.
Unlock Deck
k this deck
51
State whether the statement is true or false.
The test point satisfies the inequality .
The test point
satisfies the inequality . Unlock Deck
Unlock for access to all 74 flashcards in this deck.
Unlock Deck
k this deck
52
A learning curve describes the rate at which a person learns certain specific tasks. If N is the number of words per minute typed by a student. So for an average student
Where n is the number of days of instruction. What does the graph of this formula look like?
A)
B)
C)
D)
Where n is the number of days of instruction. What does the graph of this formula look like?
A)
B)
C)
D)
Unlock Deck
Unlock for access to all 74 flashcards in this deck.
Unlock Deck
k this deck
53
Sketch the graph of the equation.
A)
B)
C)
D)
A)
B)
C)
D)
Unlock Deck
Unlock for access to all 74 flashcards in this deck.
Unlock Deck
k this deck
54
State whether the statement is true or false.
The test point (02, 3) satisfies the inequality .
The test point (02, 3) satisfies the inequality
.
Unlock Deck
Unlock for access to all 74 flashcards in this deck.
Unlock Deck
k this deck
55
Graph the first-degree inequality in two unknowns.
A)
B)
C)
D)
A)
B)
C)
D)
Unlock Deck
Unlock for access to all 74 flashcards in this deck.
Unlock Deck
k this deck
56
State whether the statement is true or false.
The test point (0, 0) satisfies the inequality .
The test point (0, 0) satisfies the inequality
.
Unlock Deck
Unlock for access to all 74 flashcards in this deck.
Unlock Deck
k this deck
57
State whether the statement is true or false.
The test point (0, 0) satisfies the inequality .
The test point (0, 0) satisfies the inequality
.
Unlock Deck
Unlock for access to all 74 flashcards in this deck.
Unlock Deck
k this deck
58
State whether the statement is true or false.
The test point (-8, 9) satisfies the inequality .
The test point (-8, 9) satisfies the inequality
.
Unlock Deck
Unlock for access to all 74 flashcards in this deck.
Unlock Deck
k this deck
59
The healing law for skin wounds states that
Where A is the number of square centimeters of unhealed skin after t days when the original area of the wound was A 0 . Graph the healing curve for a wound of 50 cm 2 .
A)
B)
C)
D)
Where A is the number of square centimeters of unhealed skin after t days when the original area of the wound was A 0 . Graph the healing curve for a wound of 50 cm 2 .
A)
B)
C)
D)
Unlock Deck
Unlock for access to all 74 flashcards in this deck.
Unlock Deck
k this deck
60
Graph the first-degree inequality in two unknowns.
A)
B)
C)
D)
A)
B)
C)
D)
Unlock Deck
Unlock for access to all 74 flashcards in this deck.
Unlock Deck
k this deck
61
Find three ordered pairs that satisfy the equation.
Unlock Deck
Unlock for access to all 74 flashcards in this deck.
Unlock Deck
k this deck
62
Graph the line.
A)
B)
C)
D)
E)
A)
B)
C)
D)
E)
Unlock Deck
Unlock for access to all 74 flashcards in this deck.
Unlock Deck
k this deck
63
Graph the line.
A)
B)
C)
D)
E)
A)
B)
C)
D)
E)
Unlock Deck
Unlock for access to all 74 flashcards in this deck.
Unlock Deck
k this deck
64
Graph the line passing through (1, 3) with slope m = 1.5.
A)
B)
C)
D)
A)
B)
C)
D)
Unlock Deck
Unlock for access to all 74 flashcards in this deck.
Unlock Deck
k this deck
65
If a present value P is invested at the simple interest rate r for t years, then the future value after t years is given by the formula . Suppose you invest $15,000 at 8% simple interest per year. Graph the amount you will have in t years. What is the slope of the graph?
A) m = 1,200
B) m = 108
C) m = 1,340
D) m = 1,070
E) m = 1,270
. Suppose you invest $15,000 at 8% simple interest per year. Graph the amount you will have in t years. What is the slope of the graph? A) m = 1,200
B) m = 108
C) m = 1,340
D) m = 1,070
E) m = 1,270
Unlock Deck
Unlock for access to all 74 flashcards in this deck.
Unlock Deck
k this deck
66
Graph the line passing through (-2, 2) with slope m = 1.
A)
B)
C)
D)
A)
B)
C)
D)
Unlock Deck
Unlock for access to all 74 flashcards in this deck.
Unlock Deck
k this deck
67
Find three ordered pairs that satisfy the equation.
A) (0, 4), (1, 8), (2, 8)
B) (0, 4), (1, 8), (2, 6)
C) (0, 4), (1, 6), (2, 8)
D) (0, 4), (1, 6), (2, 6)
E) (0, 4), (1, 6), (2, 16)
A) (0, 4), (1, 8), (2, 8)
B) (0, 4), (1, 8), (2, 6)
C) (0, 4), (1, 6), (2, 8)
D) (0, 4), (1, 6), (2, 6)
E) (0, 4), (1, 6), (2, 16)
Unlock Deck
Unlock for access to all 74 flashcards in this deck.
Unlock Deck
k this deck
68
A business purchasing an item for business purposes may use straight-line depreciation to obtain a tax deduction. The formula for the present value, P, after t years is given below, where C is the cost and s is the scrap value after L years. The number L is called the useful life of the item.
If a certain piece of equipment costs $4,100 and has a scrap value of $1,700 after 5 years, write an equation to represent the present value after t years.
A)
B)
C)
D)
E)
If a certain piece of equipment costs $4,100 and has a scrap value of $1,700 after 5 years, write an equation to represent the present value after t years.
A)
B)
C)
D)
E)
Unlock Deck
Unlock for access to all 74 flashcards in this deck.
Unlock Deck
k this deck
69
A business purchasing an item for business purposes may use straight-line depreciation to obtain a tax deduction. The formula for the present value, P, after t years is given below, where C is the cost and s is the scrap value after L years. The number L is called the useful life of the item.
If a certain piece of equipment costs $10,100 and has a scrap value of $1,700 after 8 years, graph the amount you will have in t years. What is the slope of the graph?
__________
If a certain piece of equipment costs $10,100 and has a scrap value of $1,700 after 8 years, graph the amount you will have in t years. What is the slope of the graph?
__________ Unlock Deck
Unlock for access to all 74 flashcards in this deck.
Unlock Deck
k this deck
70
A business purchasing an item for business purposes may use straight-line depreciation to obtain a tax deduction. The formula for the present value, P, after t years is given below, where C is the cost and s is the scrap value after L years. The number L is called the useful life of the item.
If a certain piece of equipment costs $8,100 and has a scrap value of $2,100 after 10 years, write an equation to represent the present value after t years.
If a certain piece of equipment costs $8,100 and has a scrap value of $2,100 after 10 years, write an equation to represent the present value after t years.
Unlock Deck
Unlock for access to all 74 flashcards in this deck.
Unlock Deck
k this deck
71
Graph the line.
A)
B)
C)
D)
A)
B)
C)
D)
Unlock Deck
Unlock for access to all 74 flashcards in this deck.
Unlock Deck
k this deck
72
Find three ordered pairs that satisfy the equation.
Unlock Deck
Unlock for access to all 74 flashcards in this deck.
Unlock Deck
k this deck
73
Graph the line.
A)
B)
C)
D)
A)
B)
C)
D)
Unlock Deck
Unlock for access to all 74 flashcards in this deck.
Unlock Deck
k this deck
74
A business purchasing an item for business purposes may use straight-line depreciation to obtain a tax deduction. The formula for the present value, P, after t years is given below, where C is the cost and s is the scrap value after L years. The number L is called the useful life of the item.
If a certain piece of equipment costs $6,100 and has a scrap value of $2,300 after 5 years, graph the amount you will have in t years. What is the slope of the graph?
A)
B)
C)
D)
E)
If a certain piece of equipment costs $6,100 and has a scrap value of $2,300 after 5 years, graph the amount you will have in t years. What is the slope of the graph?
A)
B)
C)
D)
E)
Unlock Deck
Unlock for access to all 74 flashcards in this deck.
Unlock Deck
k this deck
Unlock Deck
Unlock for access to all 74 flashcards in this deck.


