Deck 14: The Nature of Statistics
Full screen (f)
Question
Question
Question
Question
Question
Question
Question
Question
Question
Question
Question
Question
Question
Question
Question
Question
Question
Question
Question
Question
Question
A new computer circuit was tested and the times (in nanoseconds) required to carry out different subroutines were recorded. Find r. Round your answer to four decimal places. 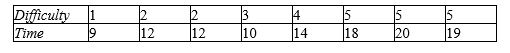
A) 0.3051
B) 0.2777
C) 0.9131
D) 0.9601
E) 0.7479
A) 0.3051
B) 0.2777
C) 0.9131
D) 0.9601
E) 0.7479
Question
Find the cumulative distribution for the table. The number of bedrooms of homes in a certain community is shown on the table below. 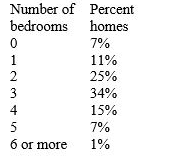
A)
B)
C)
D)
E)
A)
B)
C)
D)
E)
Question
Find r for the data shown in table. Round your answer to the nearest thousandth. 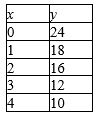
A) -0.981
B) -0.952
C) -0.932
D) -0.883
E) -0.843
A) -0.981
B) -0.952
C) -0.932
D) -0.883
E) -0.843
Question
Find the mean, median, and mode for the table. The table shows the distribution of households, according to the number of motor vehicles per household. 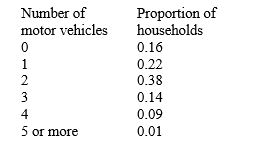
A) mean is 1.84; median is 2; mode is 2
B) mean is 1.79; median is 0; mode is 4
C) mean is 1.80; median is 1; mode is 1
D) mean is 1.81; median is 2; mode is 2
E) mean is 1.81; median is 3; mode is 2
A) mean is 1.84; median is 2; mode is 2
B) mean is 1.79; median is 0; mode is 4
C) mean is 1.80; median is 1; mode is 1
D) mean is 1.81; median is 2; mode is 2
E) mean is 1.81; median is 3; mode is 2
Question
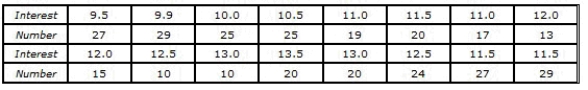
A bank records the number of mortgage applications and its own prevailing interest rate (at the first of the month) for each of 16 consecutive months. Find the best-fitting line for the interest rate (x) and the number of applications (y). 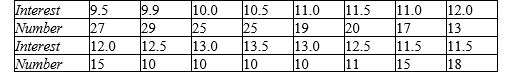
A)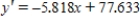
B) 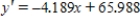
C) 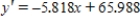
D) 
E) 
A)
B)
C)
D)
E)
Question
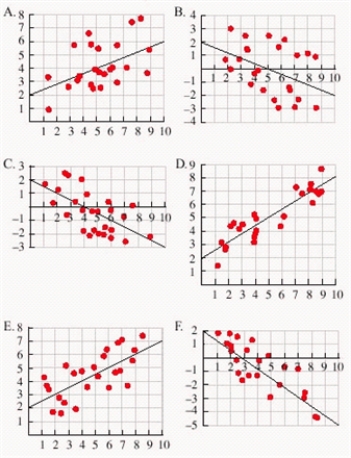
Match the equation and correlation with a graph.
Question
Find the regression line for the data points. Round your answer to the nearest hundredth. 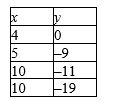
A)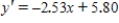
B) 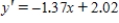
C) 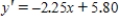
D) 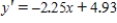
E) 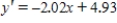
A)
B)
C)
D)
E)
Question
The ages of the runners in a race and their finishing positions are given in the following table. Assuming x is the finish position and y is the person's age, is there a significant correlation between age and finishing position? 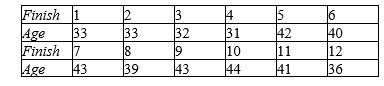

A) significant at 5%, but not at 1%
B) significant at both 5% and 1%
C) significant at 1%
D) not significant
E) none of these choices
A) significant at 5%, but not at 1%
B) significant at both 5% and 1%
C) significant at 1%
D) not significant
E) none of these choices
Question
Suppose that people's heights (in centimeters) are normally distributed, with a mean of 170 and a standard deviation of 5. We find the heights of 55 people. How many would you expect to be between 170 and 175 cm? 
A) 34
B) 19
C) 17
D) 25
E) 23
A) 34
B) 19
C) 17
D) 25
E) 23
Question
Draw a scatter diagram and find r for the data shown in the table. 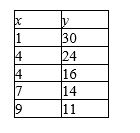
A)

B) 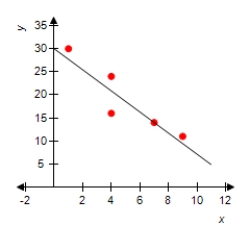

C)

D)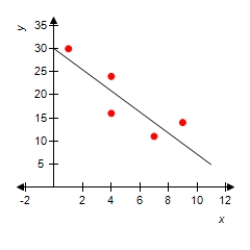

E)

A)
B)
C)
D)
E)
Question
A bank records the number of mortgage applications and its own prevailing interest rate (at the first of the month) for each of 16 consecutive months. Find the best-fitting line for the interest rate (x) and the number of applications (y). Round the coefficients in equation to three decimal places. 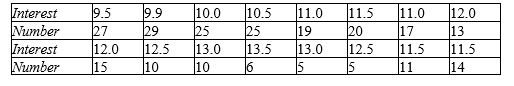
y' = __________
y' = __________
Question
Find the regression line for the data points. Round the coefficients in the equation to the nearest hundredth. 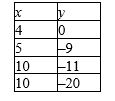
 __________
__________ Question
The ages of the runners in a race and their finishing positions are given in the following table. Assuming x is the finish position and y is the person's age, is there a significant correlation between age and finishing position? 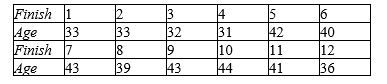
 Answer significant at 5%, but not at 1%; not significant; or significant at 1%.
Answer significant at 5%, but not at 1%; not significant; or significant at 1%. Question
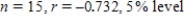
Find r for the data shown in table. Round your answer to the nearest thousandth. 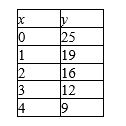
r = __________
r = __________
Question
A bank records the number of mortgage applications and its own prevailing interest rate (at the first of the month) for each of 16 consecutive months. Is there a correlation between the interest rate (x) and the number of applicants (y), and if so, is it significant at the 5% or the 1% significance level? 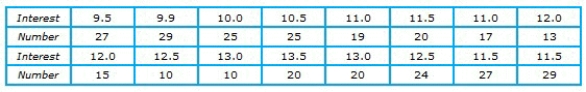
A) -0.652, significant at 5%
B) -0.652, no significant correlation
C) -0.733, significant at 1%
D) -0.587, significant at 5%
E) -0.587, significant at 1%
A) -0.652, significant at 5%
B) -0.652, no significant correlation
C) -0.733, significant at 1%
D) -0.587, significant at 5%
E) -0.587, significant at 1%
Question
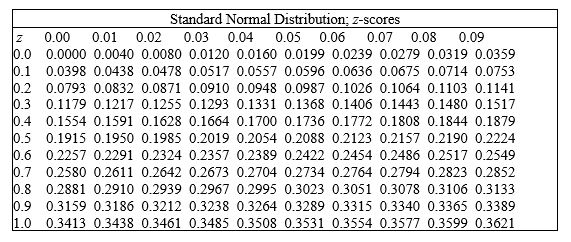
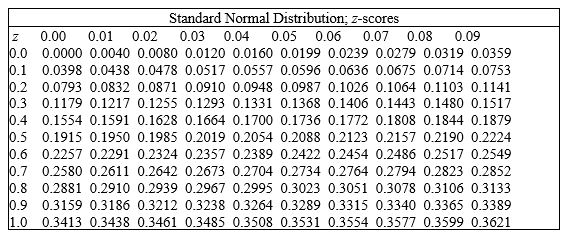
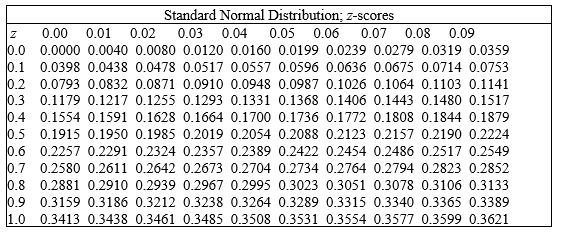
What percent of the total population is found between the mean and the z-score? 
A) 17.17%
B) 22.17%
C) 12.17%
D) 11.79%
E) 27.17%
A) 17.17%
B) 22.17%
C) 12.17%
D) 11.79%
E) 27.17%
Question
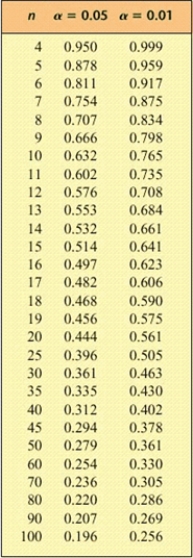
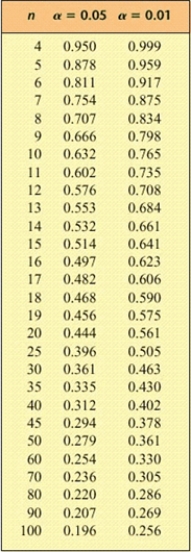
Consider a sample of paired data which gives a linear correlation coefficient r. Use the table to determine whether there is a significant linear correlation.
The linear correlation is __________ (significant, not significant).
The linear correlation is __________ (significant, not significant).
Question
Consider a sample of paired data which gives a linear correlation coefficient r. Use the table to determine whether there is a significant linear correlation. 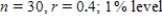
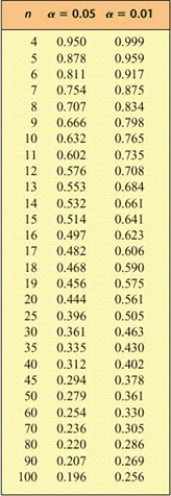
A) yes
B) no
A) yes
B) no
Question
A bank records the number of mortgage applications and its own prevailing interest rate (at the first of the month) for each of 16 consecutive months. Is there a correlation between the interest rate (x) and the number of applicants (y), and if so, is it significant at the 5% or the 1% significance level? Round your answer to three decimal places.

__________, significant at __________%.
__________, significant at __________%.
Question
What percent of the total population is found between the mean and the z-score? 
A) 34.38%
B) 34.13%
C) 44.13%
D) 39.13%
E) 19.13%
A) 34.38%
B) 34.13%
C) 44.13%
D) 39.13%
E) 19.13%
Question
The graph shows the distribution of scores on a 10-point quiz. Which of the following statements is true about the distribution? 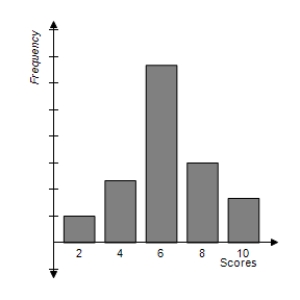
A) The mean is the same as the mode.
B) The mean is greater than the mode.
C) The mean is less than the mode.
A) The mean is the same as the mode.
B) The mean is greater than the mode.
C) The mean is less than the mode.
Question
Find the range and the standard deviation.
Where necessary, the choices are rounded to the nearest hundredth.
0, 2, 2, 6, 7, 10, 12, 19
A)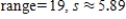
B)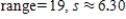
C) 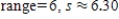
D) 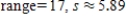
E) 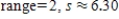
Where necessary, the choices are rounded to the nearest hundredth.
0, 2, 2, 6, 7, 10, 12, 19
A)
B)
C)
D)
E)
Question
Question
Suppose that people's heights (in centimeters) are normally distributed, with a mean of 170 and a standard deviation of 5. We find the heights of 50 people. How many would you expect to be between 160 and 170 cm? Round your answer to the nearest number. 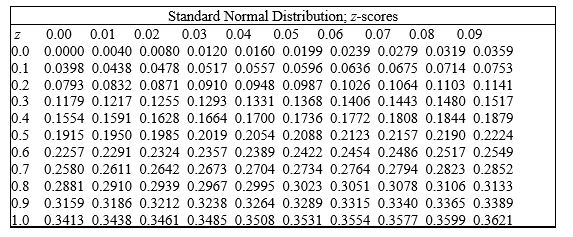
__________ people
__________ people
Question
The table shows the distribution of households, according to the number of motor vehicles per household. 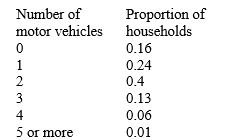 Find the cumulative distribution.
Find the mean, median, and mode. Round your answers to two decimal places, if required.
the mean is
__________
the median is
__________
the mode is
__________
Find the cumulative distribution.Find the mean, median, and mode. Round your answers to two decimal places, if required.
the mean is
__________
the median is
__________
the mode is
__________
Question
Suppose that, for a certain exam, a teacher grades on a curve. It is known that the mean is 70 and the standard deviation is 8. There are 50 students in the class. What score would be necessary to obtain an A at least?

__________ or above
__________ or above
Question
Suppose that, for a certain exam, a teacher grades on a curve. It is known that the mean is 50 and the standard deviation is 6. There are 60 students in the class. How many students should receive a C? 
A) 43
B) 35
C) 37
D) 21
E) 41
A) 43
B) 35
C) 37
D) 21
E) 41
Question
Suppose the neck size of men is normally distributed, with a mean of 15.5 inches and a standard deviation of 0.5 inch. A shirt manufacturer is going to introduce a new line of shirts. Assume that if your neck size falls between two shirt sizes, you purchase the next larger shirt size. How many shirts of the 17 size should be included in a batch of 1,000 shirts? Round your answer to the nearest number.
Standard Normal Distribution; z-scores __________ shirt(s)
Standard Normal Distribution; z-scores
__________ shirt(s) Question
Suppose the neck size of men is normally distributed, with a mean of 15.5 inches and a standard deviation of 0.5 inch. A shirt manufacturer is going to introduce a new line of shirts. Assume that if your neck size falls between two shirt sizes, you purchase the next larger shirt size. How many shirts of the 15 size should be included in a batch of 1,000 shirts? 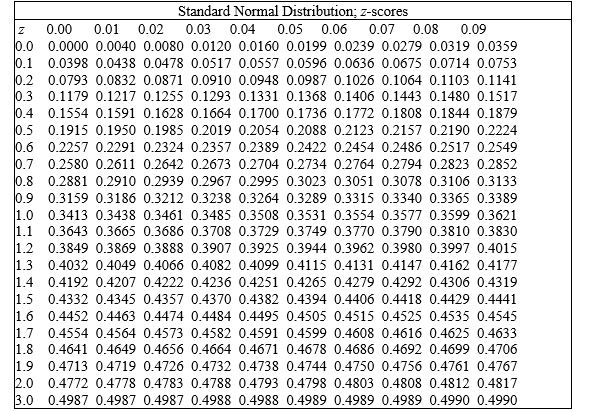
A) 341
B) 131
C) 136
D) 139
E) 146
A) 341
B) 131
C) 136
D) 139
E) 146
Question
What percent of the total population is found between the mean and the z-score? Round your answer to two decimal places. 
__________%
__________%
Question
Suppose that people's heights (in centimeters) are normally distributed, with a mean of 170 and a standard deviation of 5. We find the heights of 60 people. How many would you expect to be taller than 175 cm? 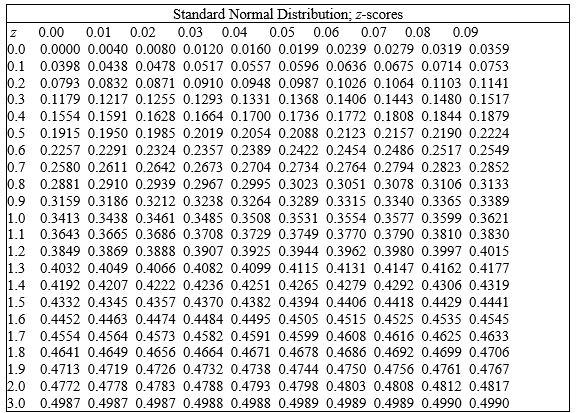
A) 8
B) 6
C) 4
D) 10
E) 20
A) 8
B) 6
C) 4
D) 10
E) 20
Question
Question
Suppose that, for a certain exam, a teacher grades on a curve. It is known that the mean is 55 and the standard deviation is 7. There are 50 students in the class. What score would be necessary to obtain a C? 
A) 48 or above
B) 62 or above
C) 50 or above
D) 44 or above
E) 42 or above
A) 48 or above
B) 62 or above
C) 50 or above
D) 44 or above
E) 42 or above
Question
Find the range and the standard deviation. Round your answer to the nearest hundredth.
1, 8, 12, 16, 20
A)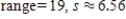
B)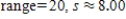
C) 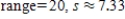
D) 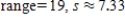
E) 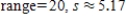
1, 8, 12, 16, 20
A)
B)
C)
D)
E)
Question
Suppose that, for a certain exam, a teacher grades on a curve. It is known that the mean is 65 and the standard deviation is 6. There are 40 students in the class. How many students should receive a C?

__________ students
__________ students
Question
The diameter of an electric cable is normally distributed, with a mean of 0.8 inch and a standard deviation of 0.01 inch. What is the probability that the diameter will exceed 0.82 inch? Round your answer to four decimal places.
Standard Normal Distribution; z-scores
Standard Normal Distribution; z-scores
Question
The mean is sometimes called the arithmetic mean to distinguish it from other possible means. For example, a different mean, called the harmonic mean (H.M.), is used to average speeds. This mean is defined to be the sum of the reciprocals of all scores divided into the number of scores. For example, the harmonic mean of the numbers 4, 5, 6, 6, 7, 8 is 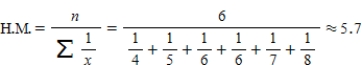
Find the arithmetic mean and the harmonic mean of the numbers 2, 2, 4, 4, 7, 8, 8, 9, 9, and 10.
Round your answers to the nearest hundredth.
A)
B)
C) 
D) 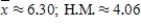
E) 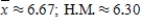
Find the arithmetic mean and the harmonic mean of the numbers 2, 2, 4, 4, 7, 8, 8, 9, 9, and 10.
Round your answers to the nearest hundredth.
A)
B)
C)
D)
E)
Question
Suppose that people's heights (in centimeters) are normally distributed, with a mean of 170 and a standard deviation of 5. We find the heights of 47 people. How many would you expect to be taller than 174 cm? Round your answer to the nearest number. 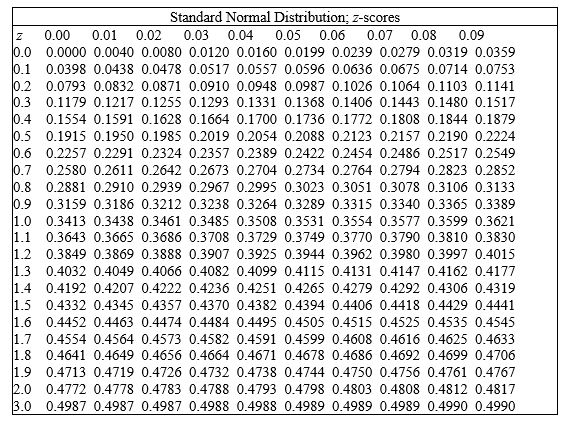 __________ people
__________ people Question
The number of bedrooms of homes in a certain community is shown on the table. 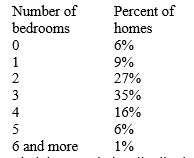 Find the cumulative distribution.
Find the mean, median, and mode. Round your answers to two decimal places, if required.
the mean is
__________
the median is
__________
the mode is
__________
Find the cumulative distribution.Find the mean, median, and mode. Round your answers to two decimal places, if required.
the mean is
__________
the median is
__________
the mode is
__________
Question
The diameter of an electric cable is normally distributed, with a mean of 0.9 inch and a standard deviation of 0.02 inch. What is the probability that the diameter will exceed 0.91 inch? 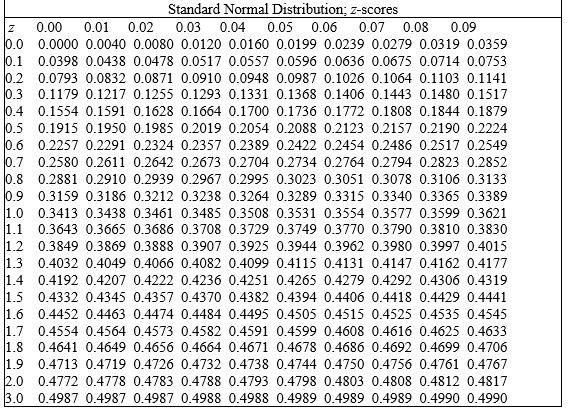
A) 0.1915
B) 0.2785
C) 0.6170
D) 0.3185
E) 0.3085
A) 0.1915
B) 0.2785
C) 0.6170
D) 0.3185
E) 0.3085
Question
The wages of employees of a small accounting firm are as follows. Draw a line graph that represents the distribution, and the y-axis represent the number. $60000, $14000, $25000, $25000, $16000, $30000,
$18000, $20000, $25000, $30000, $18000, $35000,
$50000
A)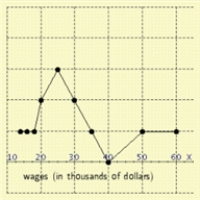
B)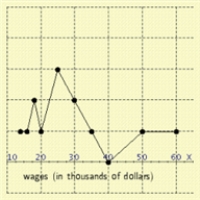
C)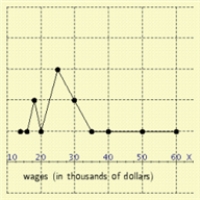
D)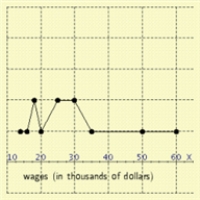
E)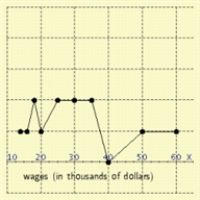
$18000, $20000, $25000, $30000, $18000, $35000,
$50000
A)
B)
C)
D)
E)
Question
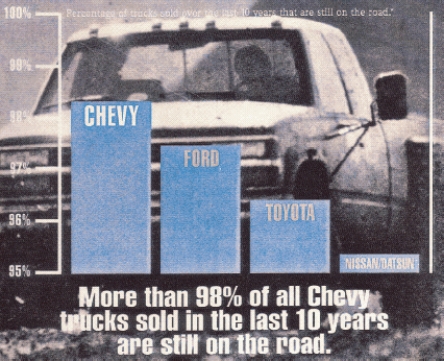
A newspaper article discussing whether Social Security could be cut offered the information shown in figure. Use the information in these graphs to answer the question.  There seems to be an error in one of the three line graphs. What is it?
A) Only one line at the bottom
B) The line graph at right begins at 1960
C) The line graph at right begins at 50 rather than 0
D) The lines are too close at the top left graph
E) There are no errors
There seems to be an error in one of the three line graphs. What is it?A) Only one line at the bottom
B) The line graph at right begins at 1960
C) The line graph at right begins at 50 rather than 0
D) The lines are too close at the top left graph
E) There are no errors
Question
The mean is sometimes called the arithmetic mean to distinguish it from other possible means. For example, a different mean, called the harmonic mean (H.M.), is used to average speeds. This mean is defined to be the sum of the reciprocals of all scores divided into the number of scores. For example, the harmonic mean of the numbers 4, 5, 6, 6, 7, 8 is  Find the arithmetic mean and the harmonic mean of the numbers 1, 1, 6, 6, 7, 8, 8, 9, 9, and 10.
Round your answers to the nearest tenth.
The arithmetic mean is
__________
The harmonic mean is
__________
Find the arithmetic mean and the harmonic mean of the numbers 1, 1, 6, 6, 7, 8, 8, 9, 9, and 10.Round your answers to the nearest tenth.
The arithmetic mean is
__________
The harmonic mean is
__________
Question
The amount of electricity used in a typical all-electric home is shown in the circle graph. If, in a certain month, a home used 2,000 kwh (kilowatt-hours), find the amounts of electricity used by the water heater from the graph. 
A) 2,200 kwh
B) 22,000 kwh
C) 220 kwh
D) 1,818 kwh
E) 182 kwh
A) 2,200 kwh
B) 22,000 kwh
C) 220 kwh
D) 1,818 kwh
E) 182 kwh
Question
The wages of employees of a small accounting firm are as follows. $20,000, $25,000, $25,000, $25,000, $30,000, $30,000,
$35,000, $50,000, $60,000, $14,000, $18,000, $16,000,
$18,000
Prepare a frequency distribution.
A)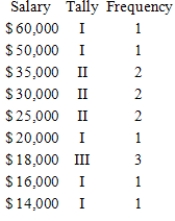
B)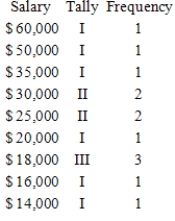
C)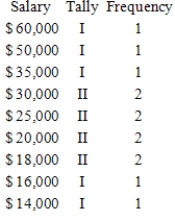
D)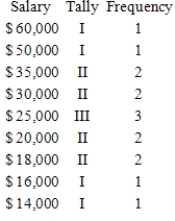
E)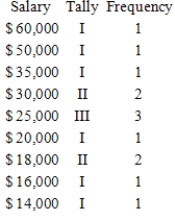
$35,000, $50,000, $60,000, $14,000, $18,000, $16,000,
$18,000
Prepare a frequency distribution.
A)
B)
C)
D)
E)
Question
The graph shows the distribution of scores on an examination. Decide whether the statement is true.
The mean is greater than the mode.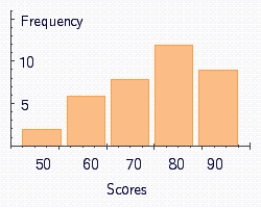 Answer yes or no.
The mean is greater than the mode.
Answer yes or no. Question
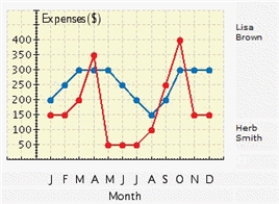
The mean is sometimes called the arithmetic mean to distinguish it from other possible means. For example, a different mean, called the geometric mean (G.M.), is used in business and economics for finding average rates of change, average rates of growth, or average ratios. This mean is defined to be the nth root of the product of the numbers. For example, the geometric mean of the numbers 4, 5, and 6 is 
Find the arithmetic and geometric means for the numbers 2, 4, 6, 7, 7, 8 and 10.
Round your answers to the nearest hundredth.
A)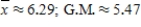
B)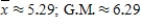
C) 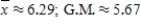
D) 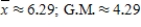
E) 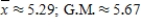
Find the arithmetic and geometric means for the numbers 2, 4, 6, 7, 7, 8 and 10.
Round your answers to the nearest hundredth.
A)
B)
C)
D)
E)
Question
Consider the graph and statement shown. Is the graph correct or misleading?
Question
A newspaper article discussing whether Social Security could be cut offered the information shown in figure. Use the information in these graphs to answer the question. 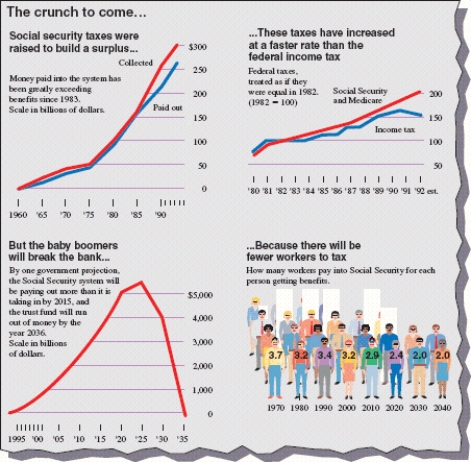 There seems to be an error in the pictograph. What is it?
A) The numbers of people are wrong at the each bar
B) Three-dimensional objects are used to represent linear data
C) There are too many colors in the pictograph
D) The pictograph begins at 1970
E) There are no errors
There seems to be an error in the pictograph. What is it?A) The numbers of people are wrong at the each bar
B) Three-dimensional objects are used to represent linear data
C) There are too many colors in the pictograph
D) The pictograph begins at 1970
E) There are no errors
Question
The figure shows a line graph. During which month did Herb incur the most expenses?
Question
Consider the graph and statement shown. Is the graph correct or misleading? 
A) The graph is correct.
B) The graph is misleading.
A) The graph is correct.
B) The graph is misleading.
Question
Question
Question
The wages of employees of a small accounting firm are as follows. Draw a bar graph that represents the distribution. $60000, $14000, $25000, $25000, $16000, $30000,
$18000, $20000, $25000, $30000, $18000, $35000,
$50000
A)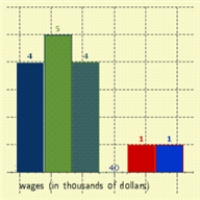
B)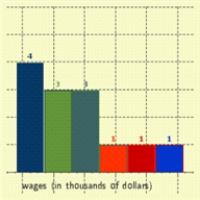
C)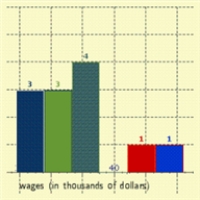
D)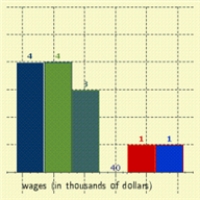
E)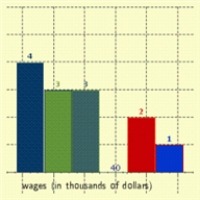
$18000, $20000, $25000, $30000, $18000, $35000,
$50000
A)
B)
C)
D)
E)
Question
Question
The mean is sometimes called the arithmetic mean to distinguish it from other possible means. For example, a different mean, called the geometric mean (G.M.), is used in business and economics for finding average rates of change, average rates of growth, or average ratios. This mean is defined to be the nth root of the product of the numbers. For example, the geometric mean of the numbers 4, 5, and 6 is 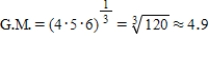 Find the arithmetic and geometric means for the numbers 2, 4, 5, 7, 7, 8 and 11.
Round your answers to the nearest hundredth, if necessary.
The arithmetic mean is
__________
The geometric mean is
__________
Find the arithmetic and geometric means for the numbers 2, 4, 5, 7, 7, 8 and 11.Round your answers to the nearest hundredth, if necessary.
The arithmetic mean is
__________
The geometric mean is
__________
Question
The amount of electricity used in a typical all-electric home is shown in the circle graph. If, in a certain month, a home used 1,200 kwh (kilowatt-hours), find the amounts of electricity used by the water heater, as displayed in the graph.
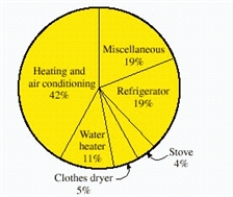
__________ kwh
__________ kwh
Question
The wages of employees of a small accounting firm are as follows. Draw a stem-and-leaf plot. $14,000, $16,000, $25,000, $25,000, $18,000, $30,000,
$20,000, $25,000, $30,000, $35,000, $18,000, $50,000,
$60,000
A)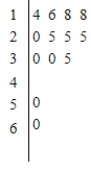
B)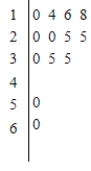
C)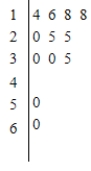
D)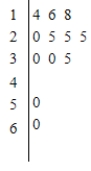
E)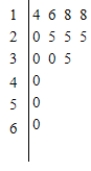
$20,000, $25,000, $30,000, $35,000, $18,000, $50,000,
$60,000
A)
B)
C)
D)
E)
Question
Question
The figure shows a line graph. During which month did Herb incur the most expenses? 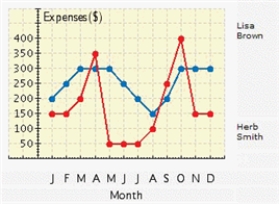
A) June
B) November
C) December
D) April
E) October
A) June
B) November
C) December
D) April
E) October

Unlock Deck
Sign up to unlock the cards in this deck!
Unlock Deck
Unlock Deck
1/82
Play
Full screen (f)
Deck 14: The Nature of Statistics
1
Conduct a survey to determine the major worry of school teachers.
Answers will vary.
2
An alpinism club would like to survey its members to determine where to go next summer.
Decide on a reasonable means for conducting the survey to obtain the desired information.
A) Survey as many alpinism club members as possible about where they want to go in summer.
B) Survey 1000 random people of different age, sex, nationality, and so on.
C) Survey 1000 random people in the street.
D) Survey 1000 persons whose names are chosen from the local telephone directory.
E) All of these are good surveys.
Survey as many alpinism club members as possible about where they want to go in summer.
3
Conduct a survey to determine whether there is a significant correlation between history scores in the 6th grade and amount of TV viewing.
Answers will vary.
4
Suppose that of 80 workers randomly selected and interviewed, 53 were opposed to an increase in Social Security taxes. Would you accept or reject the hypothesis that the majority of workers are opposed to the increase in taxes?
A) reject
B) accept
A) reject
B) accept
Unlock Deck
Unlock for access to all 82 flashcards in this deck.
Unlock Deck
k this deck
5
The government wants to use a survey to determine the extent of public approval for a adopting new rules of getting the driving license.
Decide on a reasonable means for conducting the survey to obtain the desired information.
A) Survey inhabitants of the neighbor country by randomly choosing them.
B) Survey as many inhabitants as possible about what they think of this preposition.
C) Survey students of the local college.
D) Ask the opinion of one student, one pensioner, one nurse and one teacher.
E) Ask the opinion of retired professors or inhabitants.
Unlock Deck
Unlock for access to all 82 flashcards in this deck.
Unlock Deck
k this deck
6
The government wants to use a survey to determine the extent of public approval for a adopting new rules of getting the driving license.
Decide on a reasonable means for conducting the survey to obtain the desired information.
Decide on a reasonable means for conducting the survey to obtain the desired information.
Unlock Deck
Unlock for access to all 82 flashcards in this deck.
Unlock Deck
k this deck
7
An environmental group wants to use a survey to determine the extent to which its members would be willing to protest a recent decision of the governor of a particular state. Which of the following procedures would be most appropriate for obtaining a statistically unbiased sample?
A) Survey a selection of people whose names are randomly chosen from the telephone directory.
B) Have sign-ups for workers to gather signatures at local malls throughout the state.
C) Survey members attending the annual convention of the environmental group.
D) Survey a selection of people whose names are randomly chosen from a list of members of the environmental group.
Unlock Deck
Unlock for access to all 82 flashcards in this deck.
Unlock Deck
k this deck
8
A pet store would like to use a survey to determine which factors are most important to cat owners in determining the brand of cat food that they purchase.
Decide on a reasonable means for conducting the survey to obtain the desired information.
A) Survey 1000 persons whose names are chosen from the local telephone directory.
B) Survey 1000 cat keepers by randomly choosing from a list of pets keepers.
C) Survey 1000 random people of different age, sex, nationality, and so on.
D) Survey 1000 random people in the street.
E) None of these means are reasonable.
Unlock Deck
Unlock for access to all 82 flashcards in this deck.
Unlock Deck
k this deck
9
Krispy Kreme is considering building a franchise in a particular city. It will use a survey to determine the extent of interest among residents of the city. Which of the following procedures would be most appropriate for obtaining a statistically unbiased sample?
A) Survey a selection of people who are listed on the residential roll sheets of the city.
B) Survey a random selection of customers coming out of other donut shops in the city.
C) Survey a selection of people whose names are randomly chosen from the telephone directory of the target city.
D) Survey a random selection of people whose names are obtained from national sales records of Krispy Kreme customers.
E) none of the above procedures would be most appropriate.
Unlock Deck
Unlock for access to all 82 flashcards in this deck.
Unlock Deck
k this deck
10
A movie theater would like to use a survey to determine which factors are most important to those who come to their theater. Which of the following procedures would be most appropriate for obtaining a statistically unbiased sample?
A) Survey a random selection of people passing by the theater in the mall in front of the theater.
B) Survey a random selection of shoppers in the mall.
C) Survey a random selection of people who are leaving the theater after watching a movie.
D) Induce people to answer survey questions by offering discount coupons for various city events, including the movie theater.
Unlock Deck
Unlock for access to all 82 flashcards in this deck.
Unlock Deck
k this deck
11
Conduct a survey to determine whether there is a significant correlation between math scores in the 8th grade and amount of listening to the radio.
A) 1. Do you entrust to your president?
2) Did you vote for him (her)?
B) 1. Where do you usually buy food?
2) How often do you visit big supermarkets?
C) 1. Do you have a pet?
2) What is it?
D) 1. Do you use the internet?
2) Where do you usually use the Internet?
E) 1. What was your math score in the 8th grade?
2) How much time do you spend listening to the radio?
Unlock Deck
Unlock for access to all 82 flashcards in this deck.
Unlock Deck
k this deck
12
A pet store would like to use a survey to determine which factors are most important to cat owners in determining the brand of cat food that they purchase.
Decide on a reasonable means for conducting the survey to obtain the desired information.
Decide on a reasonable means for conducting the survey to obtain the desired information.
Unlock Deck
Unlock for access to all 82 flashcards in this deck.
Unlock Deck
k this deck
13
A community will use a survey to determine if its members approve of a new charter.
Decide on a reasonable means for conducting the survey to obtain the desired information.
Decide on a reasonable means for conducting the survey to obtain the desired information.
Unlock Deck
Unlock for access to all 82 flashcards in this deck.
Unlock Deck
k this deck
14
Suppose that John hands you a coin to flip and wants to bet on the outcome. Now, John has tried this sort of thing before, and you suspect that the coin is "rigged." You decide to test this hypothesis by taking a sample. You flip the coin twice, and it is heads both times. You say, "Aha, I knew it was rigged!" John replies, "Don't be silly. Any coin can come up heads twice in a row."
The following scheme was devised to allow fair results even if the coin is somewhat biased. The coin is flipped twice. If it comes up heads both times or tails both times, it is flipped twice again. If it comes up heads-tails, this will decide the outcome in favor of the first party; and if it comes up tails-heads, this will decide the outcome in favor of the second party. Will this result in a fair toss even if the coins are biased?
A) No
B) Yes
Unlock Deck
Unlock for access to all 82 flashcards in this deck.
Unlock Deck
k this deck
15
Sprint would like to take customers from Pacific Bell, one of its competitors in a certain geographical area. Sprint would like to survey Pacific Bell's customers in order to find out which elements of its service are least satisfactory. Which of the following procedures would be most appropriate for obtaining a statistically unbiased sample?
A) Survey a random selection of people chosen from a list of Pacific Bell's customers.
B) Survey a random selection of people chosen from a list of Sprint's customers.
C) Place newspaper advertisements seeking survey participants and survey 100 people randomly chosen from those who respond.
D) Call local phone numbers and ask the person who answers if they are satisfied with their phone service.
Unlock Deck
Unlock for access to all 82 flashcards in this deck.
Unlock Deck
k this deck
16
A movie theater would like to use a survey to determine which factors are most important to those who come to their theater. Which of the following procedures would be most appropriate for obtaining a statistically unbiased sample?
A) Survey a random selection of people who are leaving the theater after watching a movie.
B) Survey a random selection of shoppers in the mall.
C) Survey a random selection of people passing by the theater in the mall in front of the theater.
D) Induce people to answer survey questions by offering discount coupons for various city events, including the movie theater.
E) None of these is a good measure.
Unlock Deck
Unlock for access to all 82 flashcards in this deck.
Unlock Deck
k this deck
17
Sprint would like to take customers from Pacific Bell, one of its competitors in a certain geographical area. Sprint would like to survey Pacific Bell's customers in order to find out which elements of its service are least satisfactory. What procedure would be most appropriate for obtaining a statistically unbiased sample?
Unlock Deck
Unlock for access to all 82 flashcards in this deck.
Unlock Deck
k this deck
18
Conduct a survey to determine the major worry of school teachers.
A) 1. Do you sometimes feel worry?
2) When do you usually feel worry?
3) What usually appears to be a reason of these feelings?
B) 1. Do you have a pet?
2) What is it?
3) What is it's name?
C) 1. Do you use the internet ?
2) Do you find it expensive?
3) Where do you usually use the internet?
D) 1. Where do you usually buy food?
2) How often do you visit big supermarkets?
3) What is the mean price of your purchase?
E) 1. Do you entrust to your president?
2) Did you vote for him (her)?
3) Can you name his decision, that you don't appreciate?
Unlock Deck
Unlock for access to all 82 flashcards in this deck.
Unlock Deck
k this deck
19
Suppose that John hands you a coin to flip and wants to bet on the outcome. Now, John has tried this sort of thing before, and you suspect that the coin is "rigged." You decide to test this hypothesis by taking a sample. You flip the coin twice, and it is heads both times. You say, "Aha, I knew it was rigged!" John replies, "Don't be silly. Any coin can come up heads twice in a row."
The following scheme was devised by mathematician John von Neumann to allow fair results even if the coin is somewhat biased. The coin is flipped twice. If it comes up heads both times or tails both times, it is flipped twice again. If it comes up heads-tails, this will decide the outcome in favor of the first party; and if it comes up tails-heads, this will decide the outcome in favor of the second party. Show that this will result in a fair toss even if the coins are biased.
The following scheme was devised by mathematician John von Neumann to allow fair results even if the coin is somewhat biased. The coin is flipped twice. If it comes up heads both times or tails both times, it is flipped twice again. If it comes up heads-tails, this will decide the outcome in favor of the first party; and if it comes up tails-heads, this will decide the outcome in favor of the second party. Show that this will result in a fair toss even if the coins are biased.
Unlock Deck
Unlock for access to all 82 flashcards in this deck.
Unlock Deck
k this deck
20
Suppose that of 80 workers randomly selected and interviewed, 47 were opposed to an increase in Social Security taxes. Would you accept or reject the hypothesis that the majority of workers are opposed to the increase in taxes?
It will be correct to __________ (accept, reject) the hypothesis.
It will be correct to __________ (accept, reject) the hypothesis.
Unlock Deck
Unlock for access to all 82 flashcards in this deck.
Unlock Deck
k this deck
21
A new computer circuit was tested and the times (in nanoseconds) required to carry out different subroutines were recorded. Find r. Round your answer to four decimal places.
A) 0.3051
B) 0.2777
C) 0.9131
D) 0.9601
E) 0.7479
A) 0.3051
B) 0.2777
C) 0.9131
D) 0.9601
E) 0.7479
Unlock Deck
Unlock for access to all 82 flashcards in this deck.
Unlock Deck
k this deck
22
Find the cumulative distribution for the table. The number of bedrooms of homes in a certain community is shown on the table below.
A)
B)
C)
D)
E)
A)
B)
C)
D)
E)
Unlock Deck
Unlock for access to all 82 flashcards in this deck.
Unlock Deck
k this deck
23
Find r for the data shown in table. Round your answer to the nearest thousandth.
A) -0.981
B) -0.952
C) -0.932
D) -0.883
E) -0.843
A) -0.981
B) -0.952
C) -0.932
D) -0.883
E) -0.843
Unlock Deck
Unlock for access to all 82 flashcards in this deck.
Unlock Deck
k this deck
24
Find the mean, median, and mode for the table. The table shows the distribution of households, according to the number of motor vehicles per household.
A) mean is 1.84; median is 2; mode is 2
B) mean is 1.79; median is 0; mode is 4
C) mean is 1.80; median is 1; mode is 1
D) mean is 1.81; median is 2; mode is 2
E) mean is 1.81; median is 3; mode is 2
A) mean is 1.84; median is 2; mode is 2
B) mean is 1.79; median is 0; mode is 4
C) mean is 1.80; median is 1; mode is 1
D) mean is 1.81; median is 2; mode is 2
E) mean is 1.81; median is 3; mode is 2
Unlock Deck
Unlock for access to all 82 flashcards in this deck.
Unlock Deck
k this deck
25
A bank records the number of mortgage applications and its own prevailing interest rate (at the first of the month) for each of 16 consecutive months. Find the best-fitting line for the interest rate (x) and the number of applications (y).
A)
B)
C)
D)
E)
A)
B)
C)
D)
E)
Unlock Deck
Unlock for access to all 82 flashcards in this deck.
Unlock Deck
k this deck
26
Match the equation and correlation with a graph.
Unlock Deck
Unlock for access to all 82 flashcards in this deck.
Unlock Deck
k this deck
27
Find the regression line for the data points. Round your answer to the nearest hundredth.
A)
B)
C)
D)
E)
A)
B)
C)
D)
E)
Unlock Deck
Unlock for access to all 82 flashcards in this deck.
Unlock Deck
k this deck
28
The ages of the runners in a race and their finishing positions are given in the following table. Assuming x is the finish position and y is the person's age, is there a significant correlation between age and finishing position?
A) significant at 5%, but not at 1%
B) significant at both 5% and 1%
C) significant at 1%
D) not significant
E) none of these choices
A) significant at 5%, but not at 1%
B) significant at both 5% and 1%
C) significant at 1%
D) not significant
E) none of these choices
Unlock Deck
Unlock for access to all 82 flashcards in this deck.
Unlock Deck
k this deck
29
Suppose that people's heights (in centimeters) are normally distributed, with a mean of 170 and a standard deviation of 5. We find the heights of 55 people. How many would you expect to be between 170 and 175 cm?
A) 34
B) 19
C) 17
D) 25
E) 23
A) 34
B) 19
C) 17
D) 25
E) 23
Unlock Deck
Unlock for access to all 82 flashcards in this deck.
Unlock Deck
k this deck
30
Draw a scatter diagram and find r for the data shown in the table.
A)
B)
C)
D)
E)
A)
B)
C)
D)
E)
Unlock Deck
Unlock for access to all 82 flashcards in this deck.
Unlock Deck
k this deck
31
A bank records the number of mortgage applications and its own prevailing interest rate (at the first of the month) for each of 16 consecutive months. Find the best-fitting line for the interest rate (x) and the number of applications (y). Round the coefficients in equation to three decimal places.
y' = __________
y' = __________
Unlock Deck
Unlock for access to all 82 flashcards in this deck.
Unlock Deck
k this deck
32
Find the regression line for the data points. Round the coefficients in the equation to the nearest hundredth. __________
__________ Unlock Deck
Unlock for access to all 82 flashcards in this deck.
Unlock Deck
k this deck
33
The ages of the runners in a race and their finishing positions are given in the following table. Assuming x is the finish position and y is the person's age, is there a significant correlation between age and finishing position? Answer significant at 5%, but not at 1%; not significant; or significant at 1%.
Answer significant at 5%, but not at 1%; not significant; or significant at 1%. Unlock Deck
Unlock for access to all 82 flashcards in this deck.
Unlock Deck
k this deck
34
Find r for the data shown in table. Round your answer to the nearest thousandth.
r = __________
r = __________
Unlock Deck
Unlock for access to all 82 flashcards in this deck.
Unlock Deck
k this deck
35
A bank records the number of mortgage applications and its own prevailing interest rate (at the first of the month) for each of 16 consecutive months. Is there a correlation between the interest rate (x) and the number of applicants (y), and if so, is it significant at the 5% or the 1% significance level?
A) -0.652, significant at 5%
B) -0.652, no significant correlation
C) -0.733, significant at 1%
D) -0.587, significant at 5%
E) -0.587, significant at 1%
A) -0.652, significant at 5%
B) -0.652, no significant correlation
C) -0.733, significant at 1%
D) -0.587, significant at 5%
E) -0.587, significant at 1%
Unlock Deck
Unlock for access to all 82 flashcards in this deck.
Unlock Deck
k this deck
36
What percent of the total population is found between the mean and the z-score?
A) 17.17%
B) 22.17%
C) 12.17%
D) 11.79%
E) 27.17%
A) 17.17%
B) 22.17%
C) 12.17%
D) 11.79%
E) 27.17%
Unlock Deck
Unlock for access to all 82 flashcards in this deck.
Unlock Deck
k this deck
37
Consider a sample of paired data which gives a linear correlation coefficient r. Use the table to determine whether there is a significant linear correlation.
The linear correlation is __________ (significant, not significant).
The linear correlation is __________ (significant, not significant).
Unlock Deck
Unlock for access to all 82 flashcards in this deck.
Unlock Deck
k this deck
38
Consider a sample of paired data which gives a linear correlation coefficient r. Use the table to determine whether there is a significant linear correlation.
A) yes
B) no
A) yes
B) no
Unlock Deck
Unlock for access to all 82 flashcards in this deck.
Unlock Deck
k this deck
39
A bank records the number of mortgage applications and its own prevailing interest rate (at the first of the month) for each of 16 consecutive months. Is there a correlation between the interest rate (x) and the number of applicants (y), and if so, is it significant at the 5% or the 1% significance level? Round your answer to three decimal places.
__________, significant at __________%.
__________, significant at __________%.
Unlock Deck
Unlock for access to all 82 flashcards in this deck.
Unlock Deck
k this deck
40
What percent of the total population is found between the mean and the z-score?
A) 34.38%
B) 34.13%
C) 44.13%
D) 39.13%
E) 19.13%
A) 34.38%
B) 34.13%
C) 44.13%
D) 39.13%
E) 19.13%
Unlock Deck
Unlock for access to all 82 flashcards in this deck.
Unlock Deck
k this deck
41
The graph shows the distribution of scores on a 10-point quiz. Which of the following statements is true about the distribution?
A) The mean is the same as the mode.
B) The mean is greater than the mode.
C) The mean is less than the mode.
A) The mean is the same as the mode.
B) The mean is greater than the mode.
C) The mean is less than the mode.
Unlock Deck
Unlock for access to all 82 flashcards in this deck.
Unlock Deck
k this deck
42
Find the range and the standard deviation.
Where necessary, the choices are rounded to the nearest hundredth.
0, 2, 2, 6, 7, 10, 12, 19
A)
B)
C)
D)
E)
Where necessary, the choices are rounded to the nearest hundredth.
0, 2, 2, 6, 7, 10, 12, 19
A)
B)
C)
D)
E)
Unlock Deck
Unlock for access to all 82 flashcards in this deck.
Unlock Deck
k this deck
43
Find the three measures of central tendency (the mean, median, and mode).
0, 1, 1, 5, 8, 10, 11, 132
A) mean = 6.5, median = 21, mode = 1
B) mean = 21, median = 6.5, mode = 1
C) mean = 6.5, median = 21, no mode
D) mean = 21, median = 1, no mode
E) mean = 6.5, median = 21, mode = 2
0, 1, 1, 5, 8, 10, 11, 132
A) mean = 6.5, median = 21, mode = 1
B) mean = 21, median = 6.5, mode = 1
C) mean = 6.5, median = 21, no mode
D) mean = 21, median = 1, no mode
E) mean = 6.5, median = 21, mode = 2
Unlock Deck
Unlock for access to all 82 flashcards in this deck.
Unlock Deck
k this deck
44
Suppose that people's heights (in centimeters) are normally distributed, with a mean of 170 and a standard deviation of 5. We find the heights of 50 people. How many would you expect to be between 160 and 170 cm? Round your answer to the nearest number.
__________ people
__________ people
Unlock Deck
Unlock for access to all 82 flashcards in this deck.
Unlock Deck
k this deck
45
The table shows the distribution of households, according to the number of motor vehicles per household. Find the cumulative distribution.
Find the mean, median, and mode. Round your answers to two decimal places, if required.
the mean is
__________
the median is
__________
the mode is
__________
Find the cumulative distribution.Find the mean, median, and mode. Round your answers to two decimal places, if required.
the mean is
__________
the median is
__________
the mode is
__________
Unlock Deck
Unlock for access to all 82 flashcards in this deck.
Unlock Deck
k this deck
46
Suppose that, for a certain exam, a teacher grades on a curve. It is known that the mean is 70 and the standard deviation is 8. There are 50 students in the class. What score would be necessary to obtain an A at least?
__________ or above
__________ or above
Unlock Deck
Unlock for access to all 82 flashcards in this deck.
Unlock Deck
k this deck
47
Suppose that, for a certain exam, a teacher grades on a curve. It is known that the mean is 50 and the standard deviation is 6. There are 60 students in the class. How many students should receive a C?
A) 43
B) 35
C) 37
D) 21
E) 41
A) 43
B) 35
C) 37
D) 21
E) 41
Unlock Deck
Unlock for access to all 82 flashcards in this deck.
Unlock Deck
k this deck
48
Suppose the neck size of men is normally distributed, with a mean of 15.5 inches and a standard deviation of 0.5 inch. A shirt manufacturer is going to introduce a new line of shirts. Assume that if your neck size falls between two shirt sizes, you purchase the next larger shirt size. How many shirts of the 17 size should be included in a batch of 1,000 shirts? Round your answer to the nearest number.
Standard Normal Distribution; z-scores __________ shirt(s)
Standard Normal Distribution; z-scores
__________ shirt(s) Unlock Deck
Unlock for access to all 82 flashcards in this deck.
Unlock Deck
k this deck
49
Suppose the neck size of men is normally distributed, with a mean of 15.5 inches and a standard deviation of 0.5 inch. A shirt manufacturer is going to introduce a new line of shirts. Assume that if your neck size falls between two shirt sizes, you purchase the next larger shirt size. How many shirts of the 15 size should be included in a batch of 1,000 shirts?
A) 341
B) 131
C) 136
D) 139
E) 146
A) 341
B) 131
C) 136
D) 139
E) 146
Unlock Deck
Unlock for access to all 82 flashcards in this deck.
Unlock Deck
k this deck
50
What percent of the total population is found between the mean and the z-score? Round your answer to two decimal places.
__________%
__________%
Unlock Deck
Unlock for access to all 82 flashcards in this deck.
Unlock Deck
k this deck
51
Suppose that people's heights (in centimeters) are normally distributed, with a mean of 170 and a standard deviation of 5. We find the heights of 60 people. How many would you expect to be taller than 175 cm?
A) 8
B) 6
C) 4
D) 10
E) 20
A) 8
B) 6
C) 4
D) 10
E) 20
Unlock Deck
Unlock for access to all 82 flashcards in this deck.
Unlock Deck
k this deck
52
Find the three measures of central tendency (the mean, median, and mode).
3, 6, 10, 12, 29
A) mean = 10, median = 12, no mode
B) mean = 12, median = 10, no mode
C) mean = 10, median = 12, mode = 12
D) mean = 12, median = 10, mode = 12
E) mean = 10, median = 10, mode = 12
3, 6, 10, 12, 29
A) mean = 10, median = 12, no mode
B) mean = 12, median = 10, no mode
C) mean = 10, median = 12, mode = 12
D) mean = 12, median = 10, mode = 12
E) mean = 10, median = 10, mode = 12
Unlock Deck
Unlock for access to all 82 flashcards in this deck.
Unlock Deck
k this deck
53
Suppose that, for a certain exam, a teacher grades on a curve. It is known that the mean is 55 and the standard deviation is 7. There are 50 students in the class. What score would be necessary to obtain a C?
A) 48 or above
B) 62 or above
C) 50 or above
D) 44 or above
E) 42 or above
A) 48 or above
B) 62 or above
C) 50 or above
D) 44 or above
E) 42 or above
Unlock Deck
Unlock for access to all 82 flashcards in this deck.
Unlock Deck
k this deck
54
Find the range and the standard deviation. Round your answer to the nearest hundredth.
1, 8, 12, 16, 20
A)
B)
C)
D)
E)
1, 8, 12, 16, 20
A)
B)
C)
D)
E)
Unlock Deck
Unlock for access to all 82 flashcards in this deck.
Unlock Deck
k this deck
55
Suppose that, for a certain exam, a teacher grades on a curve. It is known that the mean is 65 and the standard deviation is 6. There are 40 students in the class. How many students should receive a C?
__________ students
__________ students
Unlock Deck
Unlock for access to all 82 flashcards in this deck.
Unlock Deck
k this deck
56
The diameter of an electric cable is normally distributed, with a mean of 0.8 inch and a standard deviation of 0.01 inch. What is the probability that the diameter will exceed 0.82 inch? Round your answer to four decimal places.
Standard Normal Distribution; z-scores
Standard Normal Distribution; z-scores
Unlock Deck
Unlock for access to all 82 flashcards in this deck.
Unlock Deck
k this deck
57
The mean is sometimes called the arithmetic mean to distinguish it from other possible means. For example, a different mean, called the harmonic mean (H.M.), is used to average speeds. This mean is defined to be the sum of the reciprocals of all scores divided into the number of scores. For example, the harmonic mean of the numbers 4, 5, 6, 6, 7, 8 is
Find the arithmetic mean and the harmonic mean of the numbers 2, 2, 4, 4, 7, 8, 8, 9, 9, and 10.
Round your answers to the nearest hundredth.
A)
B)
C)
D)
E)
Find the arithmetic mean and the harmonic mean of the numbers 2, 2, 4, 4, 7, 8, 8, 9, 9, and 10.
Round your answers to the nearest hundredth.
A)
B)
C)
D)
E)
Unlock Deck
Unlock for access to all 82 flashcards in this deck.
Unlock Deck
k this deck
58
Suppose that people's heights (in centimeters) are normally distributed, with a mean of 170 and a standard deviation of 5. We find the heights of 47 people. How many would you expect to be taller than 174 cm? Round your answer to the nearest number. __________ people
__________ people Unlock Deck
Unlock for access to all 82 flashcards in this deck.
Unlock Deck
k this deck
59
The number of bedrooms of homes in a certain community is shown on the table. Find the cumulative distribution.
Find the mean, median, and mode. Round your answers to two decimal places, if required.
the mean is
__________
the median is
__________
the mode is
__________
Find the cumulative distribution.Find the mean, median, and mode. Round your answers to two decimal places, if required.
the mean is
__________
the median is
__________
the mode is
__________
Unlock Deck
Unlock for access to all 82 flashcards in this deck.
Unlock Deck
k this deck
60
The diameter of an electric cable is normally distributed, with a mean of 0.9 inch and a standard deviation of 0.02 inch. What is the probability that the diameter will exceed 0.91 inch?
A) 0.1915
B) 0.2785
C) 0.6170
D) 0.3185
E) 0.3085
A) 0.1915
B) 0.2785
C) 0.6170
D) 0.3185
E) 0.3085
Unlock Deck
Unlock for access to all 82 flashcards in this deck.
Unlock Deck
k this deck
61
The wages of employees of a small accounting firm are as follows. Draw a line graph that represents the distribution, and the y-axis represent the number. $60000, $14000, $25000, $25000, $16000, $30000,
$18000, $20000, $25000, $30000, $18000, $35000,
$50000
A)
B)
C)
D)
E)
$18000, $20000, $25000, $30000, $18000, $35000,
$50000
A)
B)
C)
D)
E)
Unlock Deck
Unlock for access to all 82 flashcards in this deck.
Unlock Deck
k this deck
62
A newspaper article discussing whether Social Security could be cut offered the information shown in figure. Use the information in these graphs to answer the question. There seems to be an error in one of the three line graphs. What is it?
A) Only one line at the bottom
B) The line graph at right begins at 1960
C) The line graph at right begins at 50 rather than 0
D) The lines are too close at the top left graph
E) There are no errors
There seems to be an error in one of the three line graphs. What is it?A) Only one line at the bottom
B) The line graph at right begins at 1960
C) The line graph at right begins at 50 rather than 0
D) The lines are too close at the top left graph
E) There are no errors
Unlock Deck
Unlock for access to all 82 flashcards in this deck.
Unlock Deck
k this deck
63
The mean is sometimes called the arithmetic mean to distinguish it from other possible means. For example, a different mean, called the harmonic mean (H.M.), is used to average speeds. This mean is defined to be the sum of the reciprocals of all scores divided into the number of scores. For example, the harmonic mean of the numbers 4, 5, 6, 6, 7, 8 is Find the arithmetic mean and the harmonic mean of the numbers 1, 1, 6, 6, 7, 8, 8, 9, 9, and 10.
Round your answers to the nearest tenth.
The arithmetic mean is
__________
The harmonic mean is
__________
Find the arithmetic mean and the harmonic mean of the numbers 1, 1, 6, 6, 7, 8, 8, 9, 9, and 10.Round your answers to the nearest tenth.
The arithmetic mean is
__________
The harmonic mean is
__________
Unlock Deck
Unlock for access to all 82 flashcards in this deck.
Unlock Deck
k this deck
64
The amount of electricity used in a typical all-electric home is shown in the circle graph. If, in a certain month, a home used 2,000 kwh (kilowatt-hours), find the amounts of electricity used by the water heater from the graph.
A) 2,200 kwh
B) 22,000 kwh
C) 220 kwh
D) 1,818 kwh
E) 182 kwh
A) 2,200 kwh
B) 22,000 kwh
C) 220 kwh
D) 1,818 kwh
E) 182 kwh
Unlock Deck
Unlock for access to all 82 flashcards in this deck.
Unlock Deck
k this deck
65
The wages of employees of a small accounting firm are as follows. $20,000, $25,000, $25,000, $25,000, $30,000, $30,000,
$35,000, $50,000, $60,000, $14,000, $18,000, $16,000,
$18,000
Prepare a frequency distribution.
A)
B)
C)
D)
E)
$35,000, $50,000, $60,000, $14,000, $18,000, $16,000,
$18,000
Prepare a frequency distribution.
A)
B)
C)
D)
E)
Unlock Deck
Unlock for access to all 82 flashcards in this deck.
Unlock Deck
k this deck
66
The graph shows the distribution of scores on an examination. Decide whether the statement is true.
The mean is greater than the mode. Answer yes or no.
The mean is greater than the mode.
Answer yes or no. Unlock Deck
Unlock for access to all 82 flashcards in this deck.
Unlock Deck
k this deck
67
The mean is sometimes called the arithmetic mean to distinguish it from other possible means. For example, a different mean, called the geometric mean (G.M.), is used in business and economics for finding average rates of change, average rates of growth, or average ratios. This mean is defined to be the nth root of the product of the numbers. For example, the geometric mean of the numbers 4, 5, and 6 is
Find the arithmetic and geometric means for the numbers 2, 4, 6, 7, 7, 8 and 10.
Round your answers to the nearest hundredth.
A)
B)
C)
D)
E)
Find the arithmetic and geometric means for the numbers 2, 4, 6, 7, 7, 8 and 10.
Round your answers to the nearest hundredth.
A)
B)
C)
D)
E)
Unlock Deck
Unlock for access to all 82 flashcards in this deck.
Unlock Deck
k this deck
68
Consider the graph and statement shown. Is the graph correct or misleading?
Unlock Deck
Unlock for access to all 82 flashcards in this deck.
Unlock Deck
k this deck
69
A newspaper article discussing whether Social Security could be cut offered the information shown in figure. Use the information in these graphs to answer the question. There seems to be an error in the pictograph. What is it?
A) The numbers of people are wrong at the each bar
B) Three-dimensional objects are used to represent linear data
C) There are too many colors in the pictograph
D) The pictograph begins at 1970
E) There are no errors
There seems to be an error in the pictograph. What is it?A) The numbers of people are wrong at the each bar
B) Three-dimensional objects are used to represent linear data
C) There are too many colors in the pictograph
D) The pictograph begins at 1970
E) There are no errors
Unlock Deck
Unlock for access to all 82 flashcards in this deck.
Unlock Deck
k this deck
70
The figure shows a line graph. During which month did Herb incur the most expenses?
Unlock Deck
Unlock for access to all 82 flashcards in this deck.
Unlock Deck
k this deck
71
Consider the graph and statement shown. Is the graph correct or misleading?
A) The graph is correct.
B) The graph is misleading.
A) The graph is correct.
B) The graph is misleading.
Unlock Deck
Unlock for access to all 82 flashcards in this deck.
Unlock Deck
k this deck
72
Find the three measures of central tendency (the mean, median, and mode).
1, 6, 9, 14, 20
mean =
__________
median =
__________
mode =
__________
Answer no mode if needed.
1, 6, 9, 14, 20
mean =
__________
median =
__________
mode =
__________
Answer no mode if needed.
Unlock Deck
Unlock for access to all 82 flashcards in this deck.
Unlock Deck
k this deck
73
Find the three measures of central tendency (the mean, median, and mode). Round your answers to the nearest tenth, if necessary.
0, 2, 2, 6, 8, 10, 11, 33
Answer no mode if needed.
mean =
__________
median =
__________
mode =
__________
0, 2, 2, 6, 8, 10, 11, 33
Answer no mode if needed.
mean =
__________
median =
__________
mode =
__________
Unlock Deck
Unlock for access to all 82 flashcards in this deck.
Unlock Deck
k this deck
74
The wages of employees of a small accounting firm are as follows. Draw a bar graph that represents the distribution. $60000, $14000, $25000, $25000, $16000, $30000,
$18000, $20000, $25000, $30000, $18000, $35000,
$50000
A)
B)
C)
D)
E)
$18000, $20000, $25000, $30000, $18000, $35000,
$50000
A)
B)
C)
D)
E)
Unlock Deck
Unlock for access to all 82 flashcards in this deck.
Unlock Deck
k this deck
75
Find the range and the standard deviation (correct to two decimal places, if necessary).
1, 4, 6, 8, 10
range is
__________
deviation is
__________
1, 4, 6, 8, 10
range is
__________
deviation is
__________
Unlock Deck
Unlock for access to all 82 flashcards in this deck.
Unlock Deck
k this deck
76
The mean is sometimes called the arithmetic mean to distinguish it from other possible means. For example, a different mean, called the geometric mean (G.M.), is used in business and economics for finding average rates of change, average rates of growth, or average ratios. This mean is defined to be the nth root of the product of the numbers. For example, the geometric mean of the numbers 4, 5, and 6 is Find the arithmetic and geometric means for the numbers 2, 4, 5, 7, 7, 8 and 11.
Round your answers to the nearest hundredth, if necessary.
The arithmetic mean is
__________
The geometric mean is
__________
Find the arithmetic and geometric means for the numbers 2, 4, 5, 7, 7, 8 and 11.Round your answers to the nearest hundredth, if necessary.
The arithmetic mean is
__________
The geometric mean is
__________
Unlock Deck
Unlock for access to all 82 flashcards in this deck.
Unlock Deck
k this deck
77
The amount of electricity used in a typical all-electric home is shown in the circle graph. If, in a certain month, a home used 1,200 kwh (kilowatt-hours), find the amounts of electricity used by the water heater, as displayed in the graph.
__________ kwh
__________ kwh
Unlock Deck
Unlock for access to all 82 flashcards in this deck.
Unlock Deck
k this deck
78
The wages of employees of a small accounting firm are as follows. Draw a stem-and-leaf plot. $14,000, $16,000, $25,000, $25,000, $18,000, $30,000,
$20,000, $25,000, $30,000, $35,000, $18,000, $50,000,
$60,000
A)
B)
C)
D)
E)
$20,000, $25,000, $30,000, $35,000, $18,000, $50,000,
$60,000
A)
B)
C)
D)
E)
Unlock Deck
Unlock for access to all 82 flashcards in this deck.
Unlock Deck
k this deck
79
Find the range and the standard deviation. Round to the nearest hundredth, if necessary.
0, 1, 1, 6, 8, 9, 12, 20
range is
__________
deviation is
__________
0, 1, 1, 6, 8, 9, 12, 20
range is
__________
deviation is
__________
Unlock Deck
Unlock for access to all 82 flashcards in this deck.
Unlock Deck
k this deck
80
The figure shows a line graph. During which month did Herb incur the most expenses?
A) June
B) November
C) December
D) April
E) October
A) June
B) November
C) December
D) April
E) October
Unlock Deck
Unlock for access to all 82 flashcards in this deck.
Unlock Deck
k this deck
Unlock Deck
Unlock for access to all 82 flashcards in this deck.


