Deck 51: Population Ecology
Full screen (f)
Question
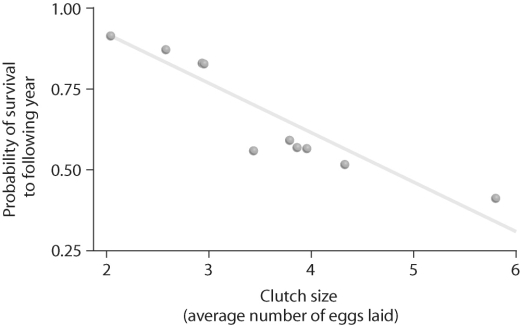 Figure 51.2
Looking at the data in the figure above, what can be said about survival and clutch size?
A) Animals with low survival tend to have low clutch sizes.
B) Animals with high fecundity tend not to live as long as animals with low fecundity.
C) Animals with high fecundity tend to live longer.
D) High clutch sizes tend to produce animals with low survival.
Question
Question
Question
Question
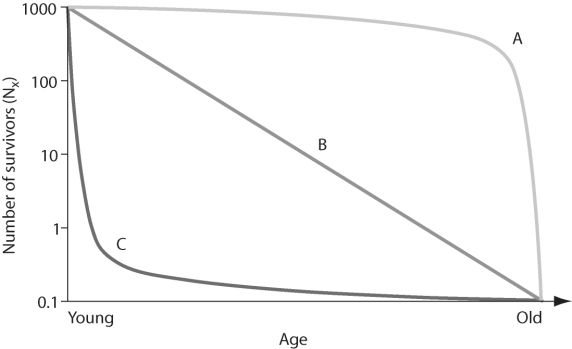 Figure 51.1
In the figure above, which of the following survivorship curves most applies to humans living in developed countries?
A) curve A
B) curve B
C) curve C
D) none of the above
Question
(a) Density dependence: Growth rate slows at high density.
 Figure 51.5
-In the figure above, which of the arrows represents the carrying capacity?
A) arrow A
B) arrow B
C) arrow C
Figure 51.5-In the figure above, which of the arrows represents the carrying capacity?
A) arrow A
B) arrow B
C) arrow C
Question
Question

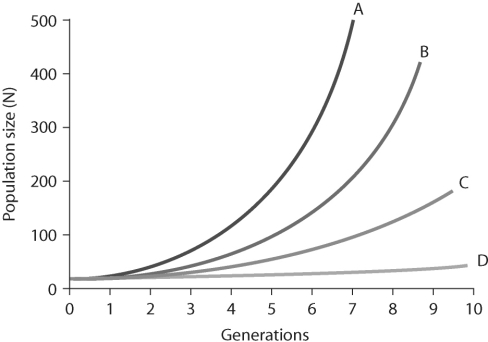 Figure 51.4
Assuming that these populations are density dependent, what is the likely outcome if the system depicted in the figure above were allowed to continue?
A) Population growth would likely decrease.
B) Populations would go extinct.
C) Population growth would continue to be discontinuous.
D) Individual growth would continue to be indeterminate.
Question
Question
Question
Figure 51.4In the figure above, which of the lines represents the highest per- capita rate increase r)?
A) line A
B) line B
C) line C
D) line D
Question
![<strong> Figure 51.3 -Looking at figure above, the white rhinoceros [more than 1000 kg 2200 lb)] is likely to exhibit which of the following?</strong> A) survivorship curve C and a LONG generation time. B) survivorship curve C and a SHORT generation time. C) survivorship curve A and a LONG generation time. D) survivorship curve B and a LONG generation time. E) survivorship curve A and a SHORT generation time. <div style=padding-top: 35px>](https://storage.examlex.com/TB6548/11eaca61_c155_9016_9abe_13be720700af_TB6548_00.jpg) Figure 51.3
Figure 51.3-Looking at figure above, the white rhinoceros [more than 1000 kg 2200 lb)] is likely to exhibit which of the following?
A) survivorship curve C and a LONG generation time.
B) survivorship curve C and a SHORT generation time.
C) survivorship curve A and a LONG generation time.
D) survivorship curve B and a LONG generation time.
E) survivorship curve A and a SHORT generation time.
Question
Figure 51.4In the figure above, which of the lines represents exponential growth?
A) line A
B) line B
C) line C
D) line D
E) all of the above
Question
Question
Figure 51.1In the figure above, which of the following survivorship curves implies that an animal may lay thousands of eggs, of which only a few will survive to reproduce?
A) curve A
B) curve B
C) curve C
D) none of the above
Question
Question
Question
Figure 51.1In the figure above, which of the following survivorship curves implies that an animal may lay thousands of eggs, of which a regular number die each year?
A) curve A
B) curve B
C) curve C
D) none of the above
Question
Question
(a) Density dependence: Growth rate slows at high density.
Figure 51.5
-In the figure above, which of the arrows represents the most rapid growth?
A) arrow A
B) arrow B
C) arrow C
Figure 51.5-In the figure above, which of the arrows represents the most rapid growth?
A) arrow A
B) arrow B
C) arrow C
Question
Question
Question
Question

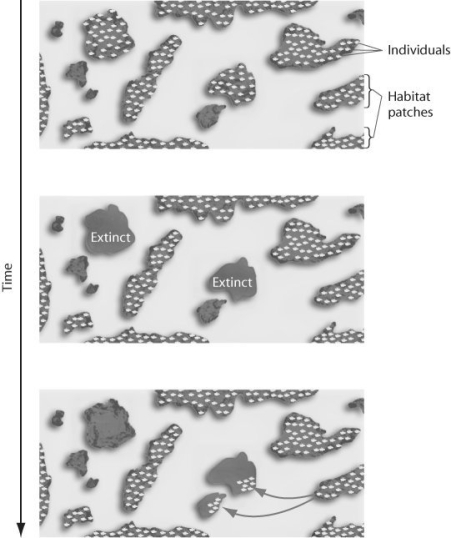 Figure 51.11
The figure above represents the dynamics of
A) emigration.
B) extinction.
C) metapopulations.
D) both metapopulations and extinction.
E) both extinction and emigration.
Question
(a)
(b)
(c)
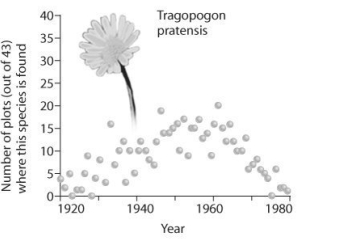
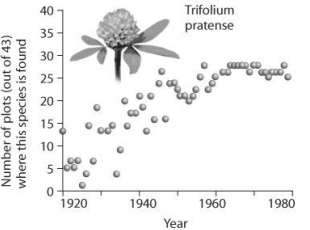
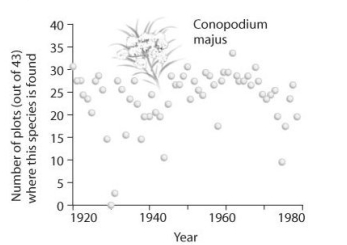 Figure 51.8
-Park Grass study in Rothamstead, UK is the longest- running biological experiment. A series of plots ~1/3 ha each) with uniform soil and vegetation have been treated either with fertilizer, lime, or left as controls. Annually, researchers record plant species present. Based on the graphs above, which species increased and maintained high population size?
A) Trifolium pratense
B) Tragopogon pratensis
C) Conopodium majus
(b)
(c)
Figure 51.8-Park Grass study in Rothamstead, UK is the longest- running biological experiment. A series of plots ~1/3 ha each) with uniform soil and vegetation have been treated either with fertilizer, lime, or left as controls. Annually, researchers record plant species present. Based on the graphs above, which species increased and maintained high population size?
A) Trifolium pratense
B) Tragopogon pratensis
C) Conopodium majus
Question
(a)
(b)
(c)
Figure 51.8
-Assuming graph b) in Figure 51.8 is the result of some experimental treatment, what can be concluded?
A) The experimental treatment has most likely identified the cause of population cycling.
B) The experimental treatment exacerbated the population cycling.
C) The experimental treatment did not affect population cycling in this species.
D) None of the above answers applies.
(b)
(c)
Figure 51.8-Assuming graph b) in Figure 51.8 is the result of some experimental treatment, what can be concluded?
A) The experimental treatment has most likely identified the cause of population cycling.
B) The experimental treatment exacerbated the population cycling.
C) The experimental treatment did not affect population cycling in this species.
D) None of the above answers applies.
Question
Question
Question
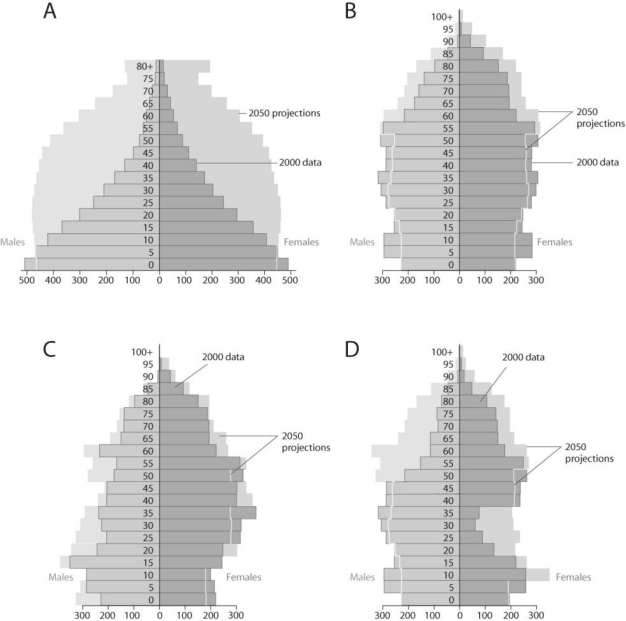 Figure 51.10
-Projections for Earth's human population by 2050 that were made in 1992 were much higher than those made in 2002. Which of the following did NOT likely contribute to this change in projection?
A) Deaths from AIDS have significantly increased since 1992.
B) Human fertility rates in developing countries have significantly decreased since 1992.
C) The number of developed countries has significantly increased since 1992.
D) The birth rates in developed countries have decreased since 1992.
Question
Question
Question
Question
(a)
(b)
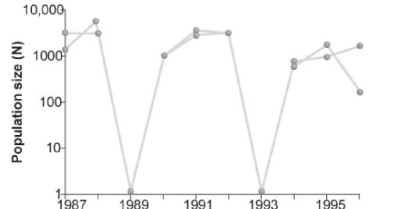
Figure 51.9
-Which of the two graphs in the figure above shows a population of organisms that has a strong population cycle?
A) a
B) b
C) both show identical cycles
(b)
Figure 51.9
-Which of the two graphs in the figure above shows a population of organisms that has a strong population cycle?
A) a
B) b
C) both show identical cycles
Question
Question
Question
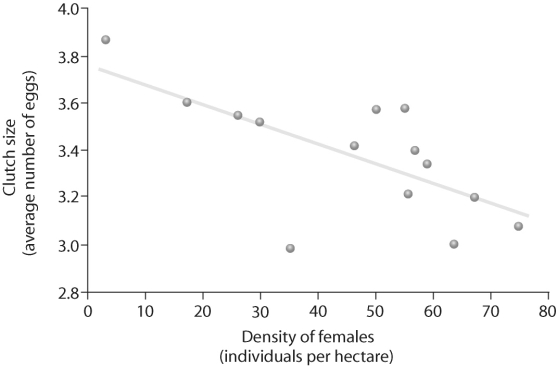 Figure 51.6
Based on the figure above, which of the following statements correctly interprets the data?
A) Clutch size is affected by female density.
B) Survivorship is affected by female density.
C) Female density is affected by clutch size.
Question
(a)
(b)
(c)
Figure 51.8
-Based on the graphs in the figure above from the Park Grass study, which species declines in population over time?
A) Conopodium majus
B) Trifolium pratense
C) Tragopogon pratensis
D) All species populations decline at some point in time.
(b)
(c)
Figure 51.8-Based on the graphs in the figure above from the Park Grass study, which species declines in population over time?
A) Conopodium majus
B) Trifolium pratense
C) Tragopogon pratensis
D) All species populations decline at some point in time.
Question
Question
Figure 51.10Based on the diagrams in the figure above and on the large population of baby boomers in Canada, what graph best reflects Canadian population in 20 years?
A) A
B) B
C) C
D) D
Question
Question
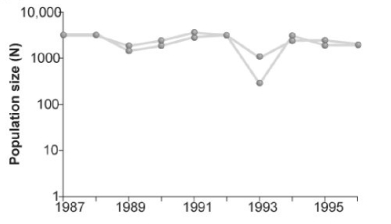
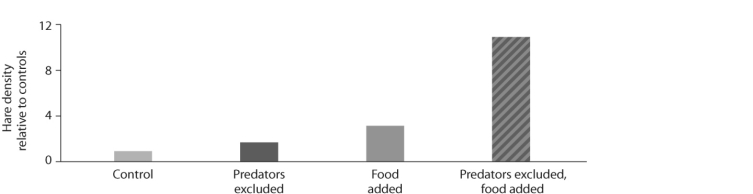 Figure 51.13
-Looking at the data in the figure above from the hare/lynx experiment, what conclusion can you draw?
A) Hares control lynx population size.
B) Lynx and hare populations are independent of each other.
C) Lynx control hare population size.
D) Hare populations are limited by both predation and food availability.
Question
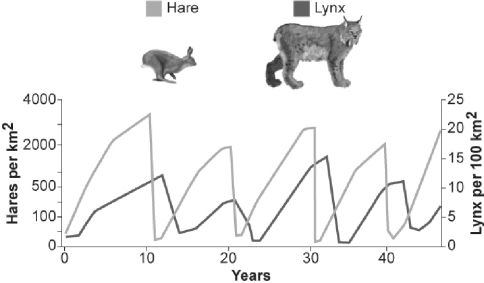 Figure 51.12
What conclusion can you draw from the figure above?
A) Lynx and hare populations are independent of each other.
B) Lynx control hare population size.
C) Hares control lynx population size.
D) The relationship between the populations cannot be determined from this graph.
Question
Question
Question
Question
Question
Question
Question

Unlock Deck
Sign up to unlock the cards in this deck!
Unlock Deck
Unlock Deck
1/49
Play
Full screen (f)
Deck 51: Population Ecology
1
Figure 51.2Looking at the data in the figure above, what can be said about survival and clutch size?
A) Animals with low survival tend to have low clutch sizes.
B) Animals with high fecundity tend not to live as long as animals with low fecundity.
C) Animals with high fecundity tend to live longer.
D) High clutch sizes tend to produce animals with low survival.
B
2
If 60 snow geese were alive in 1926 and 856 existed in 2001, what is r?
A) 0.094
B) 0.035
C) 0.070
A) 0.094
B) 0.035
C) 0.070
B
3
What is the primary limiting factor that determines why no female animal can produce a very large number of very large eggs?
A) temperature
B) male availability
C) time
D) energy stores
A) temperature
B) male availability
C) time
D) energy stores
D
4
During the Lacerta vivipara lizard study, researchers monitored individuals on a daily basis to document the number of young produced by each female in the wild. What would be the best way to obtain the same type of data but not have to visit the site every day?
A) Try the study in an isolated population in the lab.
B) Install cameras on site to monitor lizard movement.
C) Capture animals twice per year and count them.
D) Capture animals and implant tracking devices.
A) Try the study in an isolated population in the lab.
B) Install cameras on site to monitor lizard movement.
C) Capture animals twice per year and count them.
D) Capture animals and implant tracking devices.
Unlock Deck
Unlock for access to all 49 flashcards in this deck.
Unlock Deck
k this deck
5
Figure 51.1In the figure above, which of the following survivorship curves most applies to humans living in developed countries?
A) curve A
B) curve B
C) curve C
D) none of the above
Unlock Deck
Unlock for access to all 49 flashcards in this deck.
Unlock Deck
k this deck
6
(a) Density dependence: Growth rate slows at high density.
Figure 51.5
-In the figure above, which of the arrows represents the carrying capacity?
A) arrow A
B) arrow B
C) arrow C
Figure 51.5-In the figure above, which of the arrows represents the carrying capacity?
A) arrow A
B) arrow B
C) arrow C
Unlock Deck
Unlock for access to all 49 flashcards in this deck.
Unlock Deck
k this deck
7
The study of factors that determine the size and structure of populations through time is called
A) immigration.
B) population ecology.
C) demography.
D) populations.
A) immigration.
B) population ecology.
C) demography.
D) populations.
Unlock Deck
Unlock for access to all 49 flashcards in this deck.
Unlock Deck
k this deck
8
Figure 51.4Assuming that these populations are density dependent, what is the likely outcome if the system depicted in the figure above were allowed to continue?
A) Population growth would likely decrease.
B) Populations would go extinct.
C) Population growth would continue to be discontinuous.
D) Individual growth would continue to be indeterminate.
Unlock Deck
Unlock for access to all 49 flashcards in this deck.
Unlock Deck
k this deck
9
The definition of a generation is
A) 20 years.
B) the average time between a mother's first offspring and her daughter's first offspring.
C) the average time between parents' first offspring and their child's first offspring.
D) the average time between a father's first offspring and his son's first offspring.
A) 20 years.
B) the average time between a mother's first offspring and her daughter's first offspring.
C) the average time between parents' first offspring and their child's first offspring.
D) the average time between a father's first offspring and his son's first offspring.
Unlock Deck
Unlock for access to all 49 flashcards in this deck.
Unlock Deck
k this deck
10
It is estimated that snow geese will be able to sustain an r of 0.088 indefinitely. If the flock currently contains 3000 individuals, how long will it take to double?
A) 34.1 years
B) 264 years
C) 7.9 years
A) 34.1 years
B) 264 years
C) 7.9 years
Unlock Deck
Unlock for access to all 49 flashcards in this deck.
Unlock Deck
k this deck
11
Figure 51.4In the figure above, which of the lines represents the highest per- capita rate increase r)?
A) line A
B) line B
C) line C
D) line D
Unlock Deck
Unlock for access to all 49 flashcards in this deck.
Unlock Deck
k this deck
12
Figure 51.3-Looking at figure above, the white rhinoceros [more than 1000 kg 2200 lb)] is likely to exhibit which of the following?
A) survivorship curve C and a LONG generation time.
B) survivorship curve C and a SHORT generation time.
C) survivorship curve A and a LONG generation time.
D) survivorship curve B and a LONG generation time.
E) survivorship curve A and a SHORT generation time.
Unlock Deck
Unlock for access to all 49 flashcards in this deck.
Unlock Deck
k this deck
13
Figure 51.4In the figure above, which of the lines represents exponential growth?
A) line A
B) line B
C) line C
D) line D
E) all of the above
Unlock Deck
Unlock for access to all 49 flashcards in this deck.
Unlock Deck
k this deck
14
Why can't a female lizard have both high fecundity and high survival?
A) Only in rare cases do lizards have both high fecundity and high survival.
B) The more energy the female devotes to offspring, the less that can be devoted to her survival.
C) Female lizards are able to produce only one set of offspring.
D) Competition for resources prevents this.
A) Only in rare cases do lizards have both high fecundity and high survival.
B) The more energy the female devotes to offspring, the less that can be devoted to her survival.
C) Female lizards are able to produce only one set of offspring.
D) Competition for resources prevents this.
Unlock Deck
Unlock for access to all 49 flashcards in this deck.
Unlock Deck
k this deck
15
Figure 51.1In the figure above, which of the following survivorship curves implies that an animal may lay thousands of eggs, of which only a few will survive to reproduce?
A) curve A
B) curve B
C) curve C
D) none of the above
Unlock Deck
Unlock for access to all 49 flashcards in this deck.
Unlock Deck
k this deck
16
You observe two female fish of the same species breeding. One female lays 100 eggs and the other female lays 1000 eggs. Which one of the following statements does not agree with the concept of fitness trade- offs?
A) The eggs from the female laying 1000 eggs should have larger yolks compared to the yolks of the eggs from the female laying 100 eggs.
B) The female laying 100 eggs should be able to breed more often compared to the female laying 1000 eggs.
C) The female laying 100 eggs should live longer than the female laying 1000 eggs.
D) The female laying 1000 eggs should be larger than the female laying 100 eggs.
Unlock Deck
Unlock for access to all 49 flashcards in this deck.
Unlock Deck
k this deck
17
Which of these terms defines how the organism allocates resources to growth, reproduction, and activities or structures related to survival?
A) energy budget
B) life history
C) resource allocation
D) demography
A) energy budget
B) life history
C) resource allocation
D) demography
Unlock Deck
Unlock for access to all 49 flashcards in this deck.
Unlock Deck
k this deck
18
Figure 51.1In the figure above, which of the following survivorship curves implies that an animal may lay thousands of eggs, of which a regular number die each year?
A) curve A
B) curve B
C) curve C
D) none of the above
Unlock Deck
Unlock for access to all 49 flashcards in this deck.
Unlock Deck
k this deck
19
An ecologist recorded 12 white- tailed deer, Odocoileus virginianus, per square kilometre in one woodlot and 20 per square kilometre in another woodlot. What was the ecologist comparing?
A) dispersion
B) range
C) cohorts
D) density
E) carrying capacity
A) dispersion
B) range
C) cohorts
D) density
E) carrying capacity
Unlock Deck
Unlock for access to all 49 flashcards in this deck.
Unlock Deck
k this deck
20
(a) Density dependence: Growth rate slows at high density.
Figure 51.5
-In the figure above, which of the arrows represents the most rapid growth?
A) arrow A
B) arrow B
C) arrow C
Figure 51.5-In the figure above, which of the arrows represents the most rapid growth?
A) arrow A
B) arrow B
C) arrow C
Unlock Deck
Unlock for access to all 49 flashcards in this deck.
Unlock Deck
k this deck
21
Which of the following is the most important assumption for the mark-recapture method to estimate the size of wildlife populations?
A) Marked individuals have the same probability of being recaptured as unmarked individuals during the recapture phase.
B) More than 50 percent of the marked individuals need to be trapped during the recapture phase.
C) More individuals emigrate from, as opposed to immigrate into, a population.
D) All females in the population have the same litter size.
E) There is a 50:50 ratio of males to females in the population before and after trapping and recapture.
Unlock Deck
Unlock for access to all 49 flashcards in this deck.
Unlock Deck
k this deck
22
Figure 51.7
-Using information from the table above, calculate the net reproductive rate R0) for this population.
A) 1.30
B) 2.00
C) 1.00
D) 3.26
Unlock Deck
Unlock for access to all 49 flashcards in this deck.
Unlock Deck
k this deck
23
Why can't a female lizard have both high fecundity and high survival?
A) Female lizards are able to produce only one set of offspring.
B) In only rare cases, do lizards have both high fecundity and high survival.
C) Competition for resources prevents this.
D) The female is already maximizing the number of eggs she lays, and if she attempts to nest later in the season, there will not be enough food for her young.
E) The more energy the female devotes to offspring, the less that can be devoted to her survival.
Unlock Deck
Unlock for access to all 49 flashcards in this deck.
Unlock Deck
k this deck
24
Figure 51.11The figure above represents the dynamics of
A) emigration.
B) extinction.
C) metapopulations.
D) both metapopulations and extinction.
E) both extinction and emigration.
Unlock Deck
Unlock for access to all 49 flashcards in this deck.
Unlock Deck
k this deck
25
(a)
(b)
(c)
Figure 51.8
-Park Grass study in Rothamstead, UK is the longest- running biological experiment. A series of plots ~1/3 ha each) with uniform soil and vegetation have been treated either with fertilizer, lime, or left as controls. Annually, researchers record plant species present. Based on the graphs above, which species increased and maintained high population size?
A) Trifolium pratense
B) Tragopogon pratensis
C) Conopodium majus
(b)
(c)
Figure 51.8-Park Grass study in Rothamstead, UK is the longest- running biological experiment. A series of plots ~1/3 ha each) with uniform soil and vegetation have been treated either with fertilizer, lime, or left as controls. Annually, researchers record plant species present. Based on the graphs above, which species increased and maintained high population size?
A) Trifolium pratense
B) Tragopogon pratensis
C) Conopodium majus
Unlock Deck
Unlock for access to all 49 flashcards in this deck.
Unlock Deck
k this deck
26
(a)
(b)
(c)
Figure 51.8
-Assuming graph b) in Figure 51.8 is the result of some experimental treatment, what can be concluded?
A) The experimental treatment has most likely identified the cause of population cycling.
B) The experimental treatment exacerbated the population cycling.
C) The experimental treatment did not affect population cycling in this species.
D) None of the above answers applies.
(b)
(c)
Figure 51.8-Assuming graph b) in Figure 51.8 is the result of some experimental treatment, what can be concluded?
A) The experimental treatment has most likely identified the cause of population cycling.
B) The experimental treatment exacerbated the population cycling.
C) The experimental treatment did not affect population cycling in this species.
D) None of the above answers applies.
Unlock Deck
Unlock for access to all 49 flashcards in this deck.
Unlock Deck
k this deck
27
What can we NOT determine from examining age pyramids of human populations?
A) the future population size
B) the age structure of the population
C) the success of future generations
D) the fecundity of a future population
E) how populations reproduce
A) the future population size
B) the age structure of the population
C) the success of future generations
D) the fecundity of a future population
E) how populations reproduce
Unlock Deck
Unlock for access to all 49 flashcards in this deck.
Unlock Deck
k this deck
28
The regular fluctuations in size of animal populations are termed
A) population cycles.
B) growth factors.
C) population dynamics.
D) all of the above.
A) population cycles.
B) growth factors.
C) population dynamics.
D) all of the above.
Unlock Deck
Unlock for access to all 49 flashcards in this deck.
Unlock Deck
k this deck
29
Figure 51.10-Projections for Earth's human population by 2050 that were made in 1992 were much higher than those made in 2002. Which of the following did NOT likely contribute to this change in projection?
A) Deaths from AIDS have significantly increased since 1992.
B) Human fertility rates in developing countries have significantly decreased since 1992.
C) The number of developed countries has significantly increased since 1992.
D) The birth rates in developed countries have decreased since 1992.
Unlock Deck
Unlock for access to all 49 flashcards in this deck.
Unlock Deck
k this deck
30
Figure 51.7
-Using information from the table above, how would you describe the population dynamics of L. vivipara?
A) The population is decreasing.
B) The population is increasing.
C) The population is stable.
D) The figure does not provide this information.
Unlock Deck
Unlock for access to all 49 flashcards in this deck.
Unlock Deck
k this deck
31
Which statement about K is FALSE?
A) K varies among populations.
B) K varies in space.
C) K varies in time.
D) K is specific for a given species.
A) K varies among populations.
B) K varies in space.
C) K varies in time.
D) K is specific for a given species.
Unlock Deck
Unlock for access to all 49 flashcards in this deck.
Unlock Deck
k this deck
32
Suppose researchers marked 800 turtles and later were able to trap a total of 300 individuals in that population, of which 150 were marked. What is the estimate for total population size?
A) 530
B) 6000
C) 1600
D) 1000
A) 530
B) 6000
C) 1600
D) 1000
Unlock Deck
Unlock for access to all 49 flashcards in this deck.
Unlock Deck
k this deck
33
(a)
(b)
Figure 51.9
-Which of the two graphs in the figure above shows a population of organisms that has a strong population cycle?
A) a
B) b
C) both show identical cycles
(b)
Figure 51.9
-Which of the two graphs in the figure above shows a population of organisms that has a strong population cycle?
A) a
B) b
C) both show identical cycles
Unlock Deck
Unlock for access to all 49 flashcards in this deck.
Unlock Deck
k this deck
34
Conservationists will take snow geese off the endangered species list when the population hits 10,000. If populations are sustaining growth at r = 0.088 and the population in 2001 is 3000 individuals, in what year will snow geese be taken off the endangered species list?
A) 2003
B) 2617
C) 2014
A) 2003
B) 2617
C) 2014
Unlock Deck
Unlock for access to all 49 flashcards in this deck.
Unlock Deck
k this deck
35
Figure 51.7
-Using information from the table above, which year was the most successful for the population?
A) year 0
B) year 1
C) year 5
D) The figure does not provide this information.
Unlock Deck
Unlock for access to all 49 flashcards in this deck.
Unlock Deck
k this deck
36
Figure 51.6Based on the figure above, which of the following statements correctly interprets the data?
A) Clutch size is affected by female density.
B) Survivorship is affected by female density.
C) Female density is affected by clutch size.
Unlock Deck
Unlock for access to all 49 flashcards in this deck.
Unlock Deck
k this deck
37
(a)
(b)
(c)
Figure 51.8
-Based on the graphs in the figure above from the Park Grass study, which species declines in population over time?
A) Conopodium majus
B) Trifolium pratense
C) Tragopogon pratensis
D) All species populations decline at some point in time.
(b)
(c)
Figure 51.8-Based on the graphs in the figure above from the Park Grass study, which species declines in population over time?
A) Conopodium majus
B) Trifolium pratense
C) Tragopogon pratensis
D) All species populations decline at some point in time.
Unlock Deck
Unlock for access to all 49 flashcards in this deck.
Unlock Deck
k this deck
38
Natural selection involves energetic trade- offs between
A) high survival rates of offspring and the cost of parental care.
B) increasing the number of individuals produced during each reproductive episode and a corresponding decrease in parental care.
C) producing large numbers of gametes when employing internal fertilization versus fewer numbers of gametes when employing external fertilization.
D) the emigration of individuals when they are no longer reproductively capable or are committing suicide.
E) choosing how many offspring to produce over the course of a lifetime and how long to live.
Unlock Deck
Unlock for access to all 49 flashcards in this deck.
Unlock Deck
k this deck
39
Figure 51.10Based on the diagrams in the figure above and on the large population of baby boomers in Canada, what graph best reflects Canadian population in 20 years?
A) A
B) B
C) C
D) D
Unlock Deck
Unlock for access to all 49 flashcards in this deck.
Unlock Deck
k this deck
40
Which statements about K are correct?
I. K varies among populations.
II. K varies in space.
III. K varies in time.
IV. K is constant for any given species.
A) only I and III
B) only I, II, and IV
C) only I, II, and III
D) only II, III, and IV
E) only II and IV
I. K varies among populations.
II. K varies in space.
III. K varies in time.
IV. K is constant for any given species.
A) only I and III
B) only I, II, and IV
C) only I, II, and III
D) only II, III, and IV
E) only II and IV
Unlock Deck
Unlock for access to all 49 flashcards in this deck.
Unlock Deck
k this deck
41
Figure 51.13-Looking at the data in the figure above from the hare/lynx experiment, what conclusion can you draw?
A) Hares control lynx population size.
B) Lynx and hare populations are independent of each other.
C) Lynx control hare population size.
D) Hare populations are limited by both predation and food availability.
Unlock Deck
Unlock for access to all 49 flashcards in this deck.
Unlock Deck
k this deck
42
Figure 51.12What conclusion can you draw from the figure above?
A) Lynx and hare populations are independent of each other.
B) Lynx control hare population size.
C) Hares control lynx population size.
D) The relationship between the populations cannot be determined from this graph.
Unlock Deck
Unlock for access to all 49 flashcards in this deck.
Unlock Deck
k this deck
43
Use the following abstract from Theoretical Population Biology to answer the corresponding questions).
Abstract:
We derive measures for assessing the value of an individual habitat fragment for the dynamics and persistence of a metapopu living in a network of many fragments. We demonstrate that the most appropriate measure of fragment value depends on the question asked. Specifically, we analyse four alternative measures: the contribution of a fragment to the metapopulation capa the network, to the equilibrium metapopulation size, to the expected time to metapopulation extinction and the long- term contribution of a fragment to colonization events in the network. The latter measure is comparable to density- dependent measures in general matrix population theory, though some differences are introduced by the fact that "density dependence" is spatially localized in the metapopulation context. We show that the value of a fragment depends not only on the properties of the landscape but also on the properties of the species. Most importantly, variation in fragment values between the habitat fragments is greatest in the case of rare species that occur close to the extinction threshold, as these species are likely to be restricted to the most favorable parts of the landscape. We expect that the measures of habitat fragment described and analysed here have applications in landscape ecology and in conservation biology. Copyright © 2003 Elsevier Inc. All rights reserved. Otso Ovaskainen and Ilkka Hanski. 2003. How much does an individual habitat fragment contribute to metapopulation dynamics and persistence? Theoretical Population Biology 64:481- 95.)
One measure for the value of the patch was given by the long- term contribution of a fragment to colonization events in the network. How do the properties of a landscape and the properties of a species affect the value of a patch?
A) The value of the fragment depends on the properties of the landscape and the properties of the species.
B) The value of the fragment depends on neither the properties of the landscape nor on the properties of the species.
C) The value of the fragment depends only on the properties of the landscape and not on the properties of the species.
D) The value of the fragment depends not on the properties of the landscape but only on the properties of the species.
Unlock Deck
Unlock for access to all 49 flashcards in this deck.
Unlock Deck
k this deck
44
In 1987, there were only 22 condors birds) in the wild because of habitat destruction ; all were brought to zoos and breeding centres for captive breeding. In 1991, the first condors were re- introduced into the wild. To determine if the population of wild California condors is increasing, which methods would best be suited to gathering condor population size/density information?
A) dispersal sampling
B) direct counts from boats or planes
C) capture- mark- recapture
D) quadrat sampling
A) dispersal sampling
B) direct counts from boats or planes
C) capture- mark- recapture
D) quadrat sampling
Unlock Deck
Unlock for access to all 49 flashcards in this deck.
Unlock Deck
k this deck
45
Which of the following could be a density- independent factor limiting human population growth?
A) earthquakes
B) famines
C) Ebola infections
D) epidemic of measles
A) earthquakes
B) famines
C) Ebola infections
D) epidemic of measles
Unlock Deck
Unlock for access to all 49 flashcards in this deck.
Unlock Deck
k this deck
46
When the birth rate is equal to each woman producing exactly enough offspring to replace herself and her offspring's father, and the birth rate is sustained for a generation, then which of the following is correct?
A) 0 < r < 1
B) r = 0, and there is zero population growth.
C) r = 1
D) r > 1
E) Population size is at carrying capacity.
A) 0 < r < 1
B) r = 0, and there is zero population growth.
C) r = 1
D) r > 1
E) Population size is at carrying capacity.
Unlock Deck
Unlock for access to all 49 flashcards in this deck.
Unlock Deck
k this deck
47
As N approaches K for a certain population, which of the following is predicted by the logistic equation?
A) The population will show an Allee effect.
B) The population will increase exponentially.
C) The growth rate will not change.
D) The carrying capacity of the environment will increase.
E) The growth rate will approach zero.
A) The population will show an Allee effect.
B) The population will increase exponentially.
C) The growth rate will not change.
D) The carrying capacity of the environment will increase.
E) The growth rate will approach zero.
Unlock Deck
Unlock for access to all 49 flashcards in this deck.
Unlock Deck
k this deck
48
Use the following abstract from Theoretical Population Biology to answer the corresponding questions).
Abstract:
We derive measures for assessing the value of an individual habitat fragment for the dynamics and persistence of a metapopu living in a network of many fragments. We demonstrate that the most appropriate measure of fragment value depends on the question asked. Specifically, we analyse four alternative measures: the contribution of a fragment to the metapopulation capa the network, to the equilibrium metapopulation size, to the expected time to metapopulation extinction and the long- term contribution of a fragment to colonization events in the network. The latter measure is comparable to density- dependent measures in general matrix population theory, though some differences are introduced by the fact that "density dependence" is spatially localized in the metapopulation context. We show that the value of a fragment depends not only on the properties of the landscape but also on the properties of the species. Most importantly, variation in fragment values between the habitat fragments is greatest in the case of rare species that occur close to the extinction threshold, as these species are likely to be restricted to the most favorable parts of the landscape. We expect that the measures of habitat fragment described and analysed here have applications in landscape ecology and in conservation biology. Copyright © 2003 Elsevier Inc. All rights reserved. Otso Ovaskainen and Ilkka Hanski. 2003. How much does an individual habitat fragment contribute to metapopulation dynamics and persistence? Theoretical Population Biology 64:481- 95.)
Based on the information in the abstract, which of the following statements is the most correct?
A) If long- term contribution to colonization of a fragment increases, the metapopulation would destabilize.
B) If long- term contribution to colonization of a fragment increases, the metapopulation would have more fragments.
C) If long- term contribution to colonization of a fragment increases, the metapopulation would grow exponentially.
D) If long- term contribution to colonization of a fragment decreases, the metapopulation would disappear.
E) If long- term contribution to colonization of a fragment decreases, the metapopulation would stabilize.
Unlock Deck
Unlock for access to all 49 flashcards in this deck.
Unlock Deck
k this deck
49
Which of the following statements regarding the future of populations in developing countries is FALSE?
A) The fecundity is predicted to increase.
B) Overall population size will increase dramatically.
C) Survivorship will increase.
D) The number of offspring each year is predicted to remain high.
A) The fecundity is predicted to increase.
B) Overall population size will increase dramatically.
C) Survivorship will increase.
D) The number of offspring each year is predicted to remain high.
Unlock Deck
Unlock for access to all 49 flashcards in this deck.
Unlock Deck
k this deck
Unlock Deck
Unlock for access to all 49 flashcards in this deck.


