Deck 2: Presenting Data in Tables and Charts
Full screen (f)
Question
Question
Question
Question
Question
Question
Question
Question
Question
Question
Question
Question
Question
Question
Question
Question
Question
Question
Question
Question
Question
TABLE 2-3
At a meeting of information systems officers for regional offices of a national company, a survey was taken to determine the number of employees the officers supervise in the operation of their departments, where X is the number of employees overseen by each information systems officer.

Referring to Table 2-3, across all of the regional offices, how many total employees were supervised by those surveyed?
A) 15
B) 40
C) 127
D) 200
At a meeting of information systems officers for regional offices of a national company, a survey was taken to determine the number of employees the officers supervise in the operation of their departments, where X is the number of employees overseen by each information systems officer.
Referring to Table 2-3, across all of the regional offices, how many total employees were supervised by those surveyed?
A) 15
B) 40
C) 127
D) 200
Question
Question
TABLE 2-3
At a meeting of information systems officers for regional offices of a national company, a survey was taken to determine the number of employees the officers supervise in the operation of their departments, where X is the number of employees overseen by each information systems officer.
The width of each bar in a histogram corresponds to the
A) differences between the boundaries of the class.
B) number of observations in each class.
C) midpoint of each class.
D) percentage of observations in each class.
Question
Question
Question
Question
Question
Question
Question
Question
Question
TABLE 2-2
An insurance company evaluates many numerical variables about a person before deciding on an appropriate rate for automobile insurance. A representative from a local insurance agency selected a random sample of insured drivers and recorded, X, the number of claims each made in the last 3 years, with the following results.

Referring to Table 2-2, how many total claims are represented in the sample?
A) 15
B) 50
C) 111
D) 250
An insurance company evaluates many numerical variables about a person before deciding on an appropriate rate for automobile insurance. A representative from a local insurance agency selected a random sample of insured drivers and recorded, X, the number of claims each made in the last 3 years, with the following results.
Referring to Table 2-2, how many total claims are represented in the sample?
A) 15
B) 50
C) 111
D) 250
Question
TABLE 2-2
An insurance company evaluates many numerical variables about a person before deciding on an appropriate rate for automobile insurance. A representative from a local insurance agency selected a random sample of insured drivers and recorded, X, the number of claims each made in the last 3 years, with the following results.
Referring to Table 2-2, how many drivers are represented in the sample?
A) 5
B) 15
C) 18
D) 50
Question
TABLE 2-3
At a meeting of information systems officers for regional offices of a national company, a survey was taken to determine the number of employees the officers supervise in the operation of their departments, where X is the number of employees overseen by each information systems officer.
Referring to Table 2-3, how many regional offices are represented in the survey results?
A) 5
B) 11
C) 15
D) 40
Question
Question
Question
TABLE 2-2
An insurance company evaluates many numerical variables about a person before deciding on an appropriate rate for automobile insurance. A representative from a local insurance agency selected a random sample of insured drivers and recorded, X, the number of claims each made in the last 3 years, with the following results.
A type of vertical bar chart in which the categories are plotted in the descending rank order of the magnitude of their frequencies is called a
A) contingency table.
B) Pareto chart.
C) dot plot.
D) pie chart.
Question
Question
Question
Question
TABLE 2-4
Every spring semester, the School of Business coordinates with local business leaders a luncheon for graduating seniors, their families, and friends. Corporate sponsorship pays for the lunches of each of the seniors, but students have to purchase tickets to cover the cost of lunches served to guests they bring with them. The following histogram represents the attendance at the senior luncheon, where X is the number of guests each graduating senior invited to the luncheon and f is the number of graduating seniors in each category.
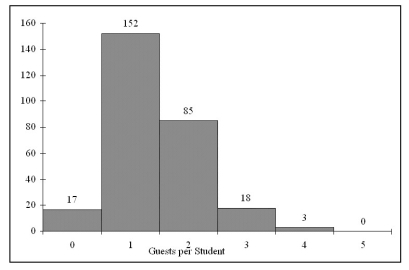
Referring to the histogram from Table 2-4, if all the tickets purchased were used, how many guests attended the luncheon?
A) 4
B) 152
C) 275
D) 388
Every spring semester, the School of Business coordinates with local business leaders a luncheon for graduating seniors, their families, and friends. Corporate sponsorship pays for the lunches of each of the seniors, but students have to purchase tickets to cover the cost of lunches served to guests they bring with them. The following histogram represents the attendance at the senior luncheon, where X is the number of guests each graduating senior invited to the luncheon and f is the number of graduating seniors in each category.
Referring to the histogram from Table 2-4, if all the tickets purchased were used, how many guests attended the luncheon?
A) 4
B) 152
C) 275
D) 388
Question
TABLE 2-6
The following are the durations in minutes of a sample of long-distance phone calls made within the continental United States reported by one long-distance carrier.

Referring to Table 2-6, if 100 calls were randomly sampled, ________ of them would have lasted at least 15 minutes but less than 20 minutes.
A) 6
B) 8
C) 10
D) 16
The following are the durations in minutes of a sample of long-distance phone calls made within the continental United States reported by one long-distance carrier.
Referring to Table 2-6, if 100 calls were randomly sampled, ________ of them would have lasted at least 15 minutes but less than 20 minutes.
A) 6
B) 8
C) 10
D) 16
Question
Question
TABLE 2-6
The following are the durations in minutes of a sample of long-distance phone calls made within the continental United States reported by one long-distance carrier.
Referring to Table 2-6, if 100 calls were randomly sampled, how many calls lasted 15 minutes or longer?
A) 10
B) 14
C) 26
D) 74
The following are the durations in minutes of a sample of long-distance phone calls made within the continental United States reported by one long-distance carrier.
Referring to Table 2-6, if 100 calls were randomly sampled, how many calls lasted 15 minutes or longer?
A) 10
B) 14
C) 26
D) 74
Question
TABLE 2-5
A survey was conducted to determine how people rated the quality of programming available on television. Respondents were asked to rate the overall quality from 0 (no quality at all) to 100 (extremely good quality). The stem-and-leaf display of the data is shown below.
 8
8

Referring to Table 2-5, what percentage of the respondents rated overall television quality with a rating of 80 or above?
A) 0
B) 4
C) 96
D) 100
A survey was conducted to determine how people rated the quality of programming available on television. Respondents were asked to rate the overall quality from 0 (no quality at all) to 100 (extremely good quality). The stem-and-leaf display of the data is shown below.
8Referring to Table 2-5, what percentage of the respondents rated overall television quality with a rating of 80 or above?
A) 0
B) 4
C) 96
D) 100
Question
TABLE 2-4
Every spring semester, the School of Business coordinates with local business leaders a luncheon for graduating seniors, their families, and friends. Corporate sponsorship pays for the lunches of each of the seniors, but students have to purchase tickets to cover the cost of lunches served to guests they bring with them. The following histogram represents the attendance at the senior luncheon, where X is the number of guests each graduating senior invited to the luncheon and f is the number of graduating seniors in each category.
When polygons or histograms are constructed, which axis must show the true zero or "origin"?
A) The horizontal axis.
B) The vertical axis.
C) Both the horizontal and vertical axes.
D) Neither the horizontal nor the vertical axis.
Question
TABLE 2-5
A survey was conducted to determine how people rated the quality of programming available on television. Respondents were asked to rate the overall quality from 0 (no quality at all) to 100 (extremely good quality). The stem-and-leaf display of the data is shown below.
8
Referring to Table 2-5, what percentage of the respondents rated overall television quality with a rating of 50 or below?
A) 11
B) 40
C) 44
D) 56
A survey was conducted to determine how people rated the quality of programming available on television. Respondents were asked to rate the overall quality from 0 (no quality at all) to 100 (extremely good quality). The stem-and-leaf display of the data is shown below.
8Referring to Table 2-5, what percentage of the respondents rated overall television quality with a rating of 50 or below?
A) 11
B) 40
C) 44
D) 56
Question
TABLE 2-6
The following are the durations in minutes of a sample of long-distance phone calls made within the continental United States reported by one long-distance carrier.
Referring to Table 2-6, what is the cumulative relative frequency for the percentage of calls that lasted under 20 minutes?
A) 0.10
B) 0.59
C) 0.76
D) 0.84
Question
TABLE 2-4
Every spring semester, the School of Business coordinates with local business leaders a luncheon for graduating seniors, their families, and friends. Corporate sponsorship pays for the lunches of each of the seniors, but students have to purchase tickets to cover the cost of lunches served to guests they bring with them. The following histogram represents the attendance at the senior luncheon, where X is the number of guests each graduating senior invited to the luncheon and f is the number of graduating seniors in each category.
When constructing charts, the following is plotted at the class midpoints:
A) frequency histograms.
B) percentage polygons.
C) cumulative relative frequency ogives.
D) All of the above.
Question
TABLE 2-6
The following are the durations in minutes of a sample of long-distance phone calls made within the continental United States reported by one long-distance carrier.
Referring to Table 2-6, if 100 calls were sampled, ________ of them would have lasted less than 15 minutes.
A) 26
B) 74
C) 10
D) None of the above.
Question
TABLE 2-6
The following are the durations in minutes of a sample of long-distance phone calls made within the continental United States reported by one long-distance carrier.
Referring to Table 2-6, if 1,000 calls were randomly sampled, how many calls lasted under 10 minutes?
A) 220
B) 370
C) 410
D) 590
The following are the durations in minutes of a sample of long-distance phone calls made within the continental United States reported by one long-distance carrier.
Referring to Table 2-6, if 1,000 calls were randomly sampled, how many calls lasted under 10 minutes?
A) 220
B) 370
C) 410
D) 590
Question
Question
TABLE 2-6
The following are the durations in minutes of a sample of long-distance phone calls made within the continental United States reported by one long-distance carrier.
Referring to Table 2-6, if 100 calls were sampled, ________ of them would have lasted less than 5 minutes or at least 30 minutes or more.
A) 35
B) 37
C) 39
D) None of the above.
Question
TABLE 2-6
The following are the durations in minutes of a sample of long-distance phone calls made within the continental United States reported by one long-distance carrier.
Referring to Table 2-6, if 100 calls were sampled, ________ of them would have lasted 20 minutes or more.
A) 26
B) 16
C) 74
D) None of the above.
Question
TABLE 2-5
A survey was conducted to determine how people rated the quality of programming available on television. Respondents were asked to rate the overall quality from 0 (no quality at all) to 100 (extremely good quality). The stem-and-leaf display of the data is shown below.
8
Referring to Table 2-5, what percentage of the respondents rated overall television quality with a rating between 50 and 75?
A) 11
B) 40
C) 44
D) 56
A survey was conducted to determine how people rated the quality of programming available on television. Respondents were asked to rate the overall quality from 0 (no quality at all) to 100 (extremely good quality). The stem-and-leaf display of the data is shown below.
8Referring to Table 2-5, what percentage of the respondents rated overall television quality with a rating between 50 and 75?
A) 11
B) 40
C) 44
D) 56
Question
TABLE 2-6
The following are the durations in minutes of a sample of long-distance phone calls made within the continental United States reported by one long-distance carrier.
Referring to Table 2-6, if 10 calls lasted 30 minutes or more, how many calls lasted less than 5 minutes?
A) 10
B) 185
C) 295
D) 500
The following are the durations in minutes of a sample of long-distance phone calls made within the continental United States reported by one long-distance carrier.
Referring to Table 2-6, if 10 calls lasted 30 minutes or more, how many calls lasted less than 5 minutes?
A) 10
B) 185
C) 295
D) 500
Question
TABLE 2-6
The following are the durations in minutes of a sample of long-distance phone calls made within the continental United States reported by one long-distance carrier.
Referring to Table 2-6, what is the width of each class?
A) 1 minute
B) 5 minutes
C) 2%
D) 100%
The following are the durations in minutes of a sample of long-distance phone calls made within the continental United States reported by one long-distance carrier.
Referring to Table 2-6, what is the width of each class?
A) 1 minute
B) 5 minutes
C) 2%
D) 100%
Question
TABLE 2-6
The following are the durations in minutes of a sample of long-distance phone calls made within the continental United States reported by one long-distance carrier.
Referring to Table 2-6, what is the cumulative relative frequency for the percentage of calls that lasted 10 minutes or more?
A) 0.16
B) 0.24
C) 0.41
D) 0.90
Question
TABLE 2-4
Every spring semester, the School of Business coordinates with local business leaders a luncheon for graduating seniors, their families, and friends. Corporate sponsorship pays for the lunches of each of the seniors, but students have to purchase tickets to cover the cost of lunches served to guests they bring with them. The following histogram represents the attendance at the senior luncheon, where X is the number of guests each graduating senior invited to the luncheon and f is the number of graduating seniors in each category.
A professor of economics at a small Texas university wanted to determine what year in school students were taking his tough economics course. Shown below is a pie chart of the results. What percentage of the class took the course prior to reaching their senior year?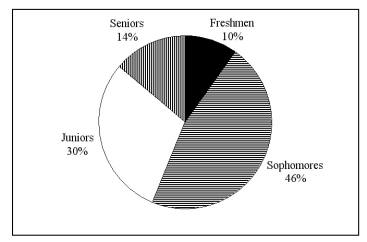
A) 14%
B) 44%
C) 54%
D) 86%
Question
TABLE 2-4
Every spring semester, the School of Business coordinates with local business leaders a luncheon for graduating seniors, their families, and friends. Corporate sponsorship pays for the lunches of each of the seniors, but students have to purchase tickets to cover the cost of lunches served to guests they bring with them. The following histogram represents the attendance at the senior luncheon, where X is the number of guests each graduating senior invited to the luncheon and f is the number of graduating seniors in each category.
Referring to the histogram from Table 2-4, how many graduating seniors attended the luncheon?
A) 4
B) 152
C) 275
D) 388
Question
TABLE 2-7
A sample of 200 students at a Big-Ten university was taken after the midterm to ask them whether they went bar hopping the weekend before the midterm or spent the weekend studying, and whether they did well or poorly on the midterm. The following table contains the result.

Referring to Table 2-7, of those who went bar hopping the weekend before the midterm in the sample, ________ percent of them did well on the midterm.
A) 15
B) 27.27
C) 30
D) 55
A sample of 200 students at a Big-Ten university was taken after the midterm to ask them whether they went bar hopping the weekend before the midterm or spent the weekend studying, and whether they did well or poorly on the midterm. The following table contains the result.
Referring to Table 2-7, of those who went bar hopping the weekend before the midterm in the sample, ________ percent of them did well on the midterm.
A) 15
B) 27.27
C) 30
D) 55
Question
Question
Question
TABLE 2-7
A sample of 200 students at a Big-Ten university was taken after the midterm to ask them whether they went bar hopping the weekend before the midterm or spent the weekend studying, and whether they did well or poorly on the midterm. The following table contains the result.
Referring to Table 2-7, if the sample is a good representation of the population, we can expect ________ percent of those who spent the weekend studying to do poorly on the midterm.
A) 10
B) 20
C) 45
D) 50
Question
TABLE 2-7
A sample of 200 students at a Big-Ten university was taken after the midterm to ask them whether they went bar hopping the weekend before the midterm or spent the weekend studying, and whether they did well or poorly on the midterm. The following table contains the result.
Referring to Table 2-7, ________ percent of the students in the sample spent the weekend studying and did well on the midterm.
A) 40
B) 50
C) 72.72
D) 80
Question
Question
Question
Question
Question
Question
TABLE 2-7
A sample of 200 students at a Big-Ten university was taken after the midterm to ask them whether they went bar hopping the weekend before the midterm or spent the weekend studying, and whether they did well or poorly on the midterm. The following table contains the result.
Referring to Table 2-7, of those who did well on the midterm in the sample, ________ percent of them went bar hopping the weekend before the midterm.
A) 15
B) 27.27
C) 30
D) 50
Question
TABLE 2-7
A sample of 200 students at a Big-Ten university was taken after the midterm to ask them whether they went bar hopping the weekend before the midterm or spent the weekend studying, and whether they did well or poorly on the midterm. The following table contains the result.
Referring to Table 2-7, ________ percent of the students in the sample went bar hopping the weekend before the midterm and did well on the midterm.
A) 15
B) 27.27
C) 30
D) 50
Question
TABLE 2-7
A sample of 200 students at a Big-Ten university was taken after the midterm to ask them whether they went bar hopping the weekend before the midterm or spent the weekend studying, and whether they did well or poorly on the midterm. The following table contains the result.
Referring to Table 2-7, if the sample is a good representation of the population, we can expect ________ percent of those who did poorly on the midterm to have spent the weekend studying.
A) 10
B) 22.22
C) 45
D) 50
Question
Question
Question
Question
TABLE 2-7
A sample of 200 students at a Big-Ten university was taken after the midterm to ask them whether they went bar hopping the weekend before the midterm or spent the weekend studying, and whether they did well or poorly on the midterm. The following table contains the result.
Referring to Table 2-7, if the sample is a good representation of the population, we can expect ________ percent of the students in the population to spend the weekend studying and do poorly on the midterm.
A) 10
B) 20
C) 45
D) 50
Question
Question
Question

Unlock Deck
Sign up to unlock the cards in this deck!
Unlock Deck
Unlock Deck
1/277
Play
Full screen (f)
Deck 2: Presenting Data in Tables and Charts
1
TABLE 2-1
The manager of the customer service division of a major consumer electronics company is interested in determining whether the customers who have purchased a DVD player made by the company over the past 12 months are satisfied with their products.
Referring to Table 2-1, the possible responses to the question "How much time do you use the DVD player every week on the average?" are values from a
A) discrete numerical random variable.
B) continuous numerical random variable.
C) categorical random variable.
D) parameter.
continuous numerical random variable.
2
TABLE 2-1
The manager of the customer service division of a major consumer electronics company is interested in determining whether the customers who have purchased a DVD player made by the company over the past 12 months are satisfied with their products.
Referring to Table 2-1, the possible responses to the question "Are you happy, indifferent, or unhappy with the performance per dollar spent on the DVD player?" are values from a
A) discrete numerical random variable.
B) continuous numerical random variable.
C) categorical random variable.
D) parameter.
categorical random variable.
3
TABLE 2-1
The manager of the customer service division of a major consumer electronics company is interested in determining whether the customers who have purchased a DVD player made by the company over the past 12 months are satisfied with their products.
Referring to Table 2-1, the possible responses to the question "How many DVD players made by other manufacturers have you used?" are values from a
A) discrete random variable.
B) continuous random variable.
C) categorical random variable.
D) parameter.
discrete random variable.
4
Jared was working on a project to look at global warming and accessed an Internet site where he captured average global surface temperatures from 1866. Which of the four methods of data collection was he using?
A) Published sources
B) Experimentation
C) Surveying
D) Observation
A) Published sources
B) Experimentation
C) Surveying
D) Observation
Unlock Deck
Unlock for access to all 277 flashcards in this deck.
Unlock Deck
k this deck
5
To monitor campus security, the campus police office is taking a survey of the number of students in a parking lot each 30 minutes of a 24-hour period with the goal of determining when patrols of the lot would serve the most students. If X is the number of students in the lot each period of time, then X is an example of
A) a categorical random variable.
B) a discrete random variable.
C) a continuous random variable.
D) a statistic.
A) a categorical random variable.
B) a discrete random variable.
C) a continuous random variable.
D) a statistic.
Unlock Deck
Unlock for access to all 277 flashcards in this deck.
Unlock Deck
k this deck
6
A study attempted to estimate the proportion of Florida residents who were willing to spend more tax dollars on protecting the beaches from environmental disasters. Twenty-five hundred Florida residents were surveyed. What type of data collection procedure was most likely used to collect the data for this study?
A) a designed experiment
B) a published source
C) a random sample
D) observational data
A) a designed experiment
B) a published source
C) a random sample
D) observational data
Unlock Deck
Unlock for access to all 277 flashcards in this deck.
Unlock Deck
k this deck
7
Researchers are concerned that the weight of the average American school child is increasing implying, among other things, that children's clothing should be manufactured and marketed in larger sizes. If X is the weight of school children sampled in a nationwide study, then X is an example of
A) a categorical random variable.
B) a discrete random variable.
C) a continuous random variable.
D) a parameter.
A) a categorical random variable.
B) a discrete random variable.
C) a continuous random variable.
D) a parameter.
Unlock Deck
Unlock for access to all 277 flashcards in this deck.
Unlock Deck
k this deck
8
A statistics student found a reference in the campus library that contained the median family incomes for all 50 states. She would report her data as being collected using
A) a designed experiment.
B) observational data.
C) a random sample.
D) a published source.
A) a designed experiment.
B) observational data.
C) a random sample.
D) a published source.
Unlock Deck
Unlock for access to all 277 flashcards in this deck.
Unlock Deck
k this deck
9
The personnel director at a large company studied the eating habits of the company's employees. The director noted whether employees brought their own lunches to work, ate at the company cafeteria, or went out to lunch. The goal of the study was to improve the food service at the company cafeteria. This type of data collection would best be considered as
A) an observational study.
B) a designed experiment.
C) a random sample.
D) a quota sample.
A) an observational study.
B) a designed experiment.
C) a random sample.
D) a quota sample.
Unlock Deck
Unlock for access to all 277 flashcards in this deck.
Unlock Deck
k this deck
10
The British Airways Internet site provides a questionnaire instrument that can be answered electronically. Which of the 4 methods of data collection is involved when people complete the questionnaire?
A) Published sources
B) Experimentation
C) Surveying
D) Observation
A) Published sources
B) Experimentation
C) Surveying
D) Observation
Unlock Deck
Unlock for access to all 277 flashcards in this deck.
Unlock Deck
k this deck
11
The chancellor of a major university was concerned about alcohol abuse on her campus and wanted to find out the proportion of students at her university who visited campus bars on the weekend before the final exam week. Her assistant took a random sample of 250 students. The portion of students in the sample who visited campus bars on the weekend before the final exam week is an example of ________.
A) a categorical random variable
B) a discrete random variable
C) a continuous random variable
D) a parameter
A) a categorical random variable
B) a discrete random variable
C) a continuous random variable
D) a parameter
Unlock Deck
Unlock for access to all 277 flashcards in this deck.
Unlock Deck
k this deck
12
Which of the following is a continuous numerical variable?
A) The color of a student's eyes
B) The number of employees of an insurance company
C) The amount of milk produced by a cow in one 24-hour period
D) The number of gallons of milk sold at the local grocery store yesterday
A) The color of a student's eyes
B) The number of employees of an insurance company
C) The amount of milk produced by a cow in one 24-hour period
D) The number of gallons of milk sold at the local grocery store yesterday
Unlock Deck
Unlock for access to all 277 flashcards in this deck.
Unlock Deck
k this deck
13
TABLE 2-1
The manager of the customer service division of a major consumer electronics company is interested in determining whether the customers who have purchased a DVD player made by the company over the past 12 months are satisfied with their products.
Referring to Table 2-1, the possible responses to the question "What is your annual income rounded to the nearest thousands?" are values from a
A) discrete numerical random variable.
B) continuous numerical random variable.
C) categorical random variable.
D) parameter.
Unlock Deck
Unlock for access to all 277 flashcards in this deck.
Unlock Deck
k this deck
14
Which of the following is a discrete numerical variable?
A) The Dow Jones Industrial average
B) The volume of water released from a dam
C) The distance you drove yesterday
D) The number of employees of an insurance company
A) The Dow Jones Industrial average
B) The volume of water released from a dam
C) The distance you drove yesterday
D) The number of employees of an insurance company
Unlock Deck
Unlock for access to all 277 flashcards in this deck.
Unlock Deck
k this deck
15
The classification of student class designation (freshman, sophomore, junior, senior) is an example of
A) a categorical random variable.
B) a discrete random variable.
C) a continuous random variable.
D) a parameter.
A) a categorical random variable.
B) a discrete random variable.
C) a continuous random variable.
D) a parameter.
Unlock Deck
Unlock for access to all 277 flashcards in this deck.
Unlock Deck
k this deck
16
Which of the 4 methods of data collection is involved when a person counts the number of cars passing designated locations on the Los Angeles freeway system?
A) Published sources
B) Experimentation
C) Surveying
D) Observation
A) Published sources
B) Experimentation
C) Surveying
D) Observation
Unlock Deck
Unlock for access to all 277 flashcards in this deck.
Unlock Deck
k this deck
17
The chancellor of a major university was concerned about alcohol abuse on her campus and wanted to find out the proportion of students at her university who visited campus bars on the weekend before the final exam week. Her assistant took a random sample of 250 students. The total number of students in the sample who visited campus bars on the weekend before the final exam week is an example of
A) a categorical random variable.
B) a discrete random variable.
C) a continuous random variable.
D) a parameter.
A) a categorical random variable.
B) a discrete random variable.
C) a continuous random variable.
D) a parameter.
Unlock Deck
Unlock for access to all 277 flashcards in this deck.
Unlock Deck
k this deck
18
The classification of student major (accounting, economics, management, marketing, other) is an example of
A) a categorical random variable.
B) a discrete random variable.
C) a continuous random variable.
D) a parameter.
A) a categorical random variable.
B) a discrete random variable.
C) a continuous random variable.
D) a parameter.
Unlock Deck
Unlock for access to all 277 flashcards in this deck.
Unlock Deck
k this deck
19
Tim was planning for a meeting with his boss to discuss a raise in his annual salary. In preparation, he wanted to use the Consumer Price Index to determine the percentage increase in his real (inflation-adjusted) salary over the last three years. Which of the 4 methods of data collection was involved when he used the Consumer Price Index?
A) Published sources
B) Experimentation
C) Surveying
D) Observation
A) Published sources
B) Experimentation
C) Surveying
D) Observation
Unlock Deck
Unlock for access to all 277 flashcards in this deck.
Unlock Deck
k this deck
20
A marketing research firm, in conducting a comparative taste test, provided three types of peanut butter to a sample of households randomly selected within the state. Which of the 4 methods of data collection is involved when people are asked to compare the three types of peanut butter?
A) Published sources
B) Experimentation
C) Surveying
D) Observation
A) Published sources
B) Experimentation
C) Surveying
D) Observation
Unlock Deck
Unlock for access to all 277 flashcards in this deck.
Unlock Deck
k this deck
21
TABLE 2-3
At a meeting of information systems officers for regional offices of a national company, a survey was taken to determine the number of employees the officers supervise in the operation of their departments, where X is the number of employees overseen by each information systems officer.
Referring to Table 2-3, across all of the regional offices, how many total employees were supervised by those surveyed?
A) 15
B) 40
C) 127
D) 200
Unlock Deck
Unlock for access to all 277 flashcards in this deck.
Unlock Deck
k this deck
22
TABLE 2-1
The manager of the customer service division of a major consumer electronics company is interested in determining whether the customers who have purchased a DVD player made by the company over the past 12 months are satisfied with their products.
Referring to Table 2-1, the possible responses to the question "What is your annual income rounded to the nearest thousands?" result in
A) a nominal scale variable.
B) an ordinal scale variable.
C) an interval scale variable.
D) a ratio scale variable.
Unlock Deck
Unlock for access to all 277 flashcards in this deck.
Unlock Deck
k this deck
23
TABLE 2-3
At a meeting of information systems officers for regional offices of a national company, a survey was taken to determine the number of employees the officers supervise in the operation of their departments, where X is the number of employees overseen by each information systems officer.
The width of each bar in a histogram corresponds to the
A) differences between the boundaries of the class.
B) number of observations in each class.
C) midpoint of each class.
D) percentage of observations in each class.
Unlock Deck
Unlock for access to all 277 flashcards in this deck.
Unlock Deck
k this deck
24
TABLE 2-1
The manager of the customer service division of a major consumer electronics company is interested in determining whether the customers who have purchased a DVD player made by the company over the past 12 months are satisfied with their products.
Referring to Table 2-1, the possible responses to the question "What brand of DVD player did you purchase?" result in
A) a nominal scale variable.
B) an ordinal scale variable.
C) an interval scale variable.
D) a ratio scale variable.
Unlock Deck
Unlock for access to all 277 flashcards in this deck.
Unlock Deck
k this deck
25
TABLE 2-1
The manager of the customer service division of a major consumer electronics company is interested in determining whether the customers who have purchased a DVD player made by the company over the past 12 months are satisfied with their products.
Referring to Table 2-1, the possible responses to the question "How many people are there in your household?" are values from a
A) discrete numerical random variable.
B) continuous numerical random variable.
C) categorical random variable.
D) parameter.
Unlock Deck
Unlock for access to all 277 flashcards in this deck.
Unlock Deck
k this deck
26
TABLE 2-1
The manager of the customer service division of a major consumer electronics company is interested in determining whether the customers who have purchased a DVD player made by the company over the past 12 months are satisfied with their products.
Referring to Table 2-1, the possible responses to the question "How many DVD players made by other manufacturers have you used?" result in
A) a nominal scale variable.
B) an ordinal scale variable.
C) an interval scale variable.
D) a ratio scale variable.
Unlock Deck
Unlock for access to all 277 flashcards in this deck.
Unlock Deck
k this deck
27
TABLE 2-1
The manager of the customer service division of a major consumer electronics company is interested in determining whether the customers who have purchased a DVD player made by the company over the past 12 months are satisfied with their products.
Referring to Table 2-1, the possible responses to the question "Are you happy, indifferent, or unhappy with the performance per dollar spent on the DVD player?" result in
A) a nominal scale variable.
B) an ordinal scale variable.
C) an interval scale variable.
D) a ratio scale variable.
Unlock Deck
Unlock for access to all 277 flashcards in this deck.
Unlock Deck
k this deck
28
TABLE 2-1
The manager of the customer service division of a major consumer electronics company is interested in determining whether the customers who have purchased a DVD player made by the company over the past 12 months are satisfied with their products.
Referring to Table 2-1, the possible responses to the question " Out of a 100 point score with 100 being the highest and 0 being the lowest, what is your satisfaction level on the DVD player that you purchased?" result in
A) a nominal scale variable.
B) an ordinal scale variable.
C) an interval scale variable.
D) a ratio scale variable.
Unlock Deck
Unlock for access to all 277 flashcards in this deck.
Unlock Deck
k this deck
29
TABLE 2-1
The manager of the customer service division of a major consumer electronics company is interested in determining whether the customers who have purchased a DVD player made by the company over the past 12 months are satisfied with their products.
Referring to Table 2-1, the possible responses to the question "In which year were you born?" result in
A) a nominal scale variable.
B) an ordinal scale variable.
C) an interval scale variable.
D) a ratio scale variable.
Unlock Deck
Unlock for access to all 277 flashcards in this deck.
Unlock Deck
k this deck
30
TABLE 2-1
The manager of the customer service division of a major consumer electronics company is interested in determining whether the customers who have purchased a DVD player made by the company over the past 12 months are satisfied with their products.
Referring to Table 2-1, the possible responses to the question "How would you rate the quality of your purchase experience with 1 = excellent, 2 = good, 3 = decent, 4 = poor, 5 = terrible?" result in
A) a nominal scale variable.
B) an ordinal scale variable.
C) an interval scale variable.
D) a ratio scale variable.
Unlock Deck
Unlock for access to all 277 flashcards in this deck.
Unlock Deck
k this deck
31
TABLE 2-1
The manager of the customer service division of a major consumer electronics company is interested in determining whether the customers who have purchased a DVD player made by the company over the past 12 months are satisfied with their products.
Referring to Table 2-1, the possible responses to the question "How would you rate the quality of your purchase experience with 1 = excellent, 2 = good, 3 = decent, 4 = poor, 5 = terrible?" are values from a
A) discrete numerical random variable.
B) continuous numerical random variable.
C) categorical random variable.
D) parameter.
Unlock Deck
Unlock for access to all 277 flashcards in this deck.
Unlock Deck
k this deck
32
TABLE 2-2
An insurance company evaluates many numerical variables about a person before deciding on an appropriate rate for automobile insurance. A representative from a local insurance agency selected a random sample of insured drivers and recorded, X, the number of claims each made in the last 3 years, with the following results.
Referring to Table 2-2, how many total claims are represented in the sample?
A) 15
B) 50
C) 111
D) 250
Unlock Deck
Unlock for access to all 277 flashcards in this deck.
Unlock Deck
k this deck
33
TABLE 2-2
An insurance company evaluates many numerical variables about a person before deciding on an appropriate rate for automobile insurance. A representative from a local insurance agency selected a random sample of insured drivers and recorded, X, the number of claims each made in the last 3 years, with the following results.
Referring to Table 2-2, how many drivers are represented in the sample?
A) 5
B) 15
C) 18
D) 50
Unlock Deck
Unlock for access to all 277 flashcards in this deck.
Unlock Deck
k this deck
34
TABLE 2-3
At a meeting of information systems officers for regional offices of a national company, a survey was taken to determine the number of employees the officers supervise in the operation of their departments, where X is the number of employees overseen by each information systems officer.
Referring to Table 2-3, how many regional offices are represented in the survey results?
A) 5
B) 11
C) 15
D) 40
Unlock Deck
Unlock for access to all 277 flashcards in this deck.
Unlock Deck
k this deck
35
TABLE 2-1
The manager of the customer service division of a major consumer electronics company is interested in determining whether the customers who have purchased a DVD player made by the company over the past 12 months are satisfied with their products.
Referring to Table 2-1, the possible responses to the question "How many people are there in your household?" result in
A) a nominal scale variable.
B) an ordinal scale variable.
C) an interval scale variable.
D) a ratio scale variable.
Unlock Deck
Unlock for access to all 277 flashcards in this deck.
Unlock Deck
k this deck
36
TABLE 2-1
The manager of the customer service division of a major consumer electronics company is interested in determining whether the customers who have purchased a DVD player made by the company over the past 12 months are satisfied with their products.
Referring to Table 2-1, the possible responses to the question "Out of a 100 point score with 100 being the highest and 0 being the lowest, what is your satisfaction level on the DVD player that you purchased?" are values from a
A) discrete numerical random variable.
B) continuous numerical random variable.
C) categorical random variable.
D) parameter.
Unlock Deck
Unlock for access to all 277 flashcards in this deck.
Unlock Deck
k this deck
37
TABLE 2-2
An insurance company evaluates many numerical variables about a person before deciding on an appropriate rate for automobile insurance. A representative from a local insurance agency selected a random sample of insured drivers and recorded, X, the number of claims each made in the last 3 years, with the following results.
A type of vertical bar chart in which the categories are plotted in the descending rank order of the magnitude of their frequencies is called a
A) contingency table.
B) Pareto chart.
C) dot plot.
D) pie chart.
Unlock Deck
Unlock for access to all 277 flashcards in this deck.
Unlock Deck
k this deck
38
TABLE 2-1
The manager of the customer service division of a major consumer electronics company is interested in determining whether the customers who have purchased a DVD player made by the company over the past 12 months are satisfied with their products.
Referring to Table 2-1, the possible responses to the question "In which year were you born?" are values from a
A) discrete numerical random variable.
B) continuous numerical random variable.
C) categorical random variable.
D) parameter.
Unlock Deck
Unlock for access to all 277 flashcards in this deck.
Unlock Deck
k this deck
39
TABLE 2-1
The manager of the customer service division of a major consumer electronics company is interested in determining whether the customers who have purchased a DVD player made by the company over the past 12 months are satisfied with their products.
Referring to Table 2-1, the possible responses to the question "What brand of DVD player did you purchase?" are values from a
A) discrete numerical random variable.
B) continuous numerical random variable.
C) categorical random variable.
D) parameter.
Unlock Deck
Unlock for access to all 277 flashcards in this deck.
Unlock Deck
k this deck
40
TABLE 2-1
The manager of the customer service division of a major consumer electronics company is interested in determining whether the customers who have purchased a DVD player made by the company over the past 12 months are satisfied with their products.
Referring to Table 2-1, the possible responses to the question "How much time do you use the DVD player every week on the average?" result in
A) a nominal scale variable.
B) an ordinal scale variable.
C) an interval scale variable.
D) a ratio scale variable.
Unlock Deck
Unlock for access to all 277 flashcards in this deck.
Unlock Deck
k this deck
41
TABLE 2-4
Every spring semester, the School of Business coordinates with local business leaders a luncheon for graduating seniors, their families, and friends. Corporate sponsorship pays for the lunches of each of the seniors, but students have to purchase tickets to cover the cost of lunches served to guests they bring with them. The following histogram represents the attendance at the senior luncheon, where X is the number of guests each graduating senior invited to the luncheon and f is the number of graduating seniors in each category.
Referring to the histogram from Table 2-4, if all the tickets purchased were used, how many guests attended the luncheon?
A) 4
B) 152
C) 275
D) 388
Unlock Deck
Unlock for access to all 277 flashcards in this deck.
Unlock Deck
k this deck
42
TABLE 2-6
The following are the durations in minutes of a sample of long-distance phone calls made within the continental United States reported by one long-distance carrier.
Referring to Table 2-6, if 100 calls were randomly sampled, ________ of them would have lasted at least 15 minutes but less than 20 minutes.
A) 6
B) 8
C) 10
D) 16
Unlock Deck
Unlock for access to all 277 flashcards in this deck.
Unlock Deck
k this deck
43
Northern Ireland is experiencing a baby boom, with the number of births rising for the fifth year in a row, according to a BBC News report. Which of the following is best for displaying this data?
A) A Pareto chart
B) A two-way classification table
C) A histogram
D) A scatter plot
A) A Pareto chart
B) A two-way classification table
C) A histogram
D) A scatter plot
Unlock Deck
Unlock for access to all 277 flashcards in this deck.
Unlock Deck
k this deck
44
TABLE 2-6
The following are the durations in minutes of a sample of long-distance phone calls made within the continental United States reported by one long-distance carrier.
Referring to Table 2-6, if 100 calls were randomly sampled, how many calls lasted 15 minutes or longer?
A) 10
B) 14
C) 26
D) 74
The following are the durations in minutes of a sample of long-distance phone calls made within the continental United States reported by one long-distance carrier.
Referring to Table 2-6, if 100 calls were randomly sampled, how many calls lasted 15 minutes or longer?
A) 10
B) 14
C) 26
D) 74
Unlock Deck
Unlock for access to all 277 flashcards in this deck.
Unlock Deck
k this deck
45
TABLE 2-5
A survey was conducted to determine how people rated the quality of programming available on television. Respondents were asked to rate the overall quality from 0 (no quality at all) to 100 (extremely good quality). The stem-and-leaf display of the data is shown below.
8
Referring to Table 2-5, what percentage of the respondents rated overall television quality with a rating of 80 or above?
A) 0
B) 4
C) 96
D) 100
A survey was conducted to determine how people rated the quality of programming available on television. Respondents were asked to rate the overall quality from 0 (no quality at all) to 100 (extremely good quality). The stem-and-leaf display of the data is shown below.
8Referring to Table 2-5, what percentage of the respondents rated overall television quality with a rating of 80 or above?
A) 0
B) 4
C) 96
D) 100
Unlock Deck
Unlock for access to all 277 flashcards in this deck.
Unlock Deck
k this deck
46
TABLE 2-4
Every spring semester, the School of Business coordinates with local business leaders a luncheon for graduating seniors, their families, and friends. Corporate sponsorship pays for the lunches of each of the seniors, but students have to purchase tickets to cover the cost of lunches served to guests they bring with them. The following histogram represents the attendance at the senior luncheon, where X is the number of guests each graduating senior invited to the luncheon and f is the number of graduating seniors in each category.
When polygons or histograms are constructed, which axis must show the true zero or "origin"?
A) The horizontal axis.
B) The vertical axis.
C) Both the horizontal and vertical axes.
D) Neither the horizontal nor the vertical axis.
Unlock Deck
Unlock for access to all 277 flashcards in this deck.
Unlock Deck
k this deck
47
TABLE 2-5
A survey was conducted to determine how people rated the quality of programming available on television. Respondents were asked to rate the overall quality from 0 (no quality at all) to 100 (extremely good quality). The stem-and-leaf display of the data is shown below.
8
Referring to Table 2-5, what percentage of the respondents rated overall television quality with a rating of 50 or below?
A) 11
B) 40
C) 44
D) 56
A survey was conducted to determine how people rated the quality of programming available on television. Respondents were asked to rate the overall quality from 0 (no quality at all) to 100 (extremely good quality). The stem-and-leaf display of the data is shown below.
8Referring to Table 2-5, what percentage of the respondents rated overall television quality with a rating of 50 or below?
A) 11
B) 40
C) 44
D) 56
Unlock Deck
Unlock for access to all 277 flashcards in this deck.
Unlock Deck
k this deck
48
TABLE 2-6
The following are the durations in minutes of a sample of long-distance phone calls made within the continental United States reported by one long-distance carrier.
Referring to Table 2-6, what is the cumulative relative frequency for the percentage of calls that lasted under 20 minutes?
A) 0.10
B) 0.59
C) 0.76
D) 0.84
Unlock Deck
Unlock for access to all 277 flashcards in this deck.
Unlock Deck
k this deck
49
TABLE 2-4
Every spring semester, the School of Business coordinates with local business leaders a luncheon for graduating seniors, their families, and friends. Corporate sponsorship pays for the lunches of each of the seniors, but students have to purchase tickets to cover the cost of lunches served to guests they bring with them. The following histogram represents the attendance at the senior luncheon, where X is the number of guests each graduating senior invited to the luncheon and f is the number of graduating seniors in each category.
When constructing charts, the following is plotted at the class midpoints:
A) frequency histograms.
B) percentage polygons.
C) cumulative relative frequency ogives.
D) All of the above.
Unlock Deck
Unlock for access to all 277 flashcards in this deck.
Unlock Deck
k this deck
50
TABLE 2-6
The following are the durations in minutes of a sample of long-distance phone calls made within the continental United States reported by one long-distance carrier.
Referring to Table 2-6, if 100 calls were sampled, ________ of them would have lasted less than 15 minutes.
A) 26
B) 74
C) 10
D) None of the above.
Unlock Deck
Unlock for access to all 277 flashcards in this deck.
Unlock Deck
k this deck
51
TABLE 2-6
The following are the durations in minutes of a sample of long-distance phone calls made within the continental United States reported by one long-distance carrier.
Referring to Table 2-6, if 1,000 calls were randomly sampled, how many calls lasted under 10 minutes?
A) 220
B) 370
C) 410
D) 590
The following are the durations in minutes of a sample of long-distance phone calls made within the continental United States reported by one long-distance carrier.
Referring to Table 2-6, if 1,000 calls were randomly sampled, how many calls lasted under 10 minutes?
A) 220
B) 370
C) 410
D) 590
Unlock Deck
Unlock for access to all 277 flashcards in this deck.
Unlock Deck
k this deck
52
Which of the following is appropriate for displaying data collected on the different brands of cars students at a major university drive?
A) A Pareto chart
B) A two-way classification table
C) A histogram
D) A scatter plot
A) A Pareto chart
B) A two-way classification table
C) A histogram
D) A scatter plot
Unlock Deck
Unlock for access to all 277 flashcards in this deck.
Unlock Deck
k this deck
53
TABLE 2-6
The following are the durations in minutes of a sample of long-distance phone calls made within the continental United States reported by one long-distance carrier.
Referring to Table 2-6, if 100 calls were sampled, ________ of them would have lasted less than 5 minutes or at least 30 minutes or more.
A) 35
B) 37
C) 39
D) None of the above.
Unlock Deck
Unlock for access to all 277 flashcards in this deck.
Unlock Deck
k this deck
54
TABLE 2-6
The following are the durations in minutes of a sample of long-distance phone calls made within the continental United States reported by one long-distance carrier.
Referring to Table 2-6, if 100 calls were sampled, ________ of them would have lasted 20 minutes or more.
A) 26
B) 16
C) 74
D) None of the above.
Unlock Deck
Unlock for access to all 277 flashcards in this deck.
Unlock Deck
k this deck
55
TABLE 2-5
A survey was conducted to determine how people rated the quality of programming available on television. Respondents were asked to rate the overall quality from 0 (no quality at all) to 100 (extremely good quality). The stem-and-leaf display of the data is shown below.
8
Referring to Table 2-5, what percentage of the respondents rated overall television quality with a rating between 50 and 75?
A) 11
B) 40
C) 44
D) 56
A survey was conducted to determine how people rated the quality of programming available on television. Respondents were asked to rate the overall quality from 0 (no quality at all) to 100 (extremely good quality). The stem-and-leaf display of the data is shown below.
8Referring to Table 2-5, what percentage of the respondents rated overall television quality with a rating between 50 and 75?
A) 11
B) 40
C) 44
D) 56
Unlock Deck
Unlock for access to all 277 flashcards in this deck.
Unlock Deck
k this deck
56
TABLE 2-6
The following are the durations in minutes of a sample of long-distance phone calls made within the continental United States reported by one long-distance carrier.
Referring to Table 2-6, if 10 calls lasted 30 minutes or more, how many calls lasted less than 5 minutes?
A) 10
B) 185
C) 295
D) 500
The following are the durations in minutes of a sample of long-distance phone calls made within the continental United States reported by one long-distance carrier.
Referring to Table 2-6, if 10 calls lasted 30 minutes or more, how many calls lasted less than 5 minutes?
A) 10
B) 185
C) 295
D) 500
Unlock Deck
Unlock for access to all 277 flashcards in this deck.
Unlock Deck
k this deck
57
TABLE 2-6
The following are the durations in minutes of a sample of long-distance phone calls made within the continental United States reported by one long-distance carrier.
Referring to Table 2-6, what is the width of each class?
A) 1 minute
B) 5 minutes
C) 2%
D) 100%
The following are the durations in minutes of a sample of long-distance phone calls made within the continental United States reported by one long-distance carrier.
Referring to Table 2-6, what is the width of each class?
A) 1 minute
B) 5 minutes
C) 2%
D) 100%
Unlock Deck
Unlock for access to all 277 flashcards in this deck.
Unlock Deck
k this deck
58
TABLE 2-6
The following are the durations in minutes of a sample of long-distance phone calls made within the continental United States reported by one long-distance carrier.
Referring to Table 2-6, what is the cumulative relative frequency for the percentage of calls that lasted 10 minutes or more?
A) 0.16
B) 0.24
C) 0.41
D) 0.90
Unlock Deck
Unlock for access to all 277 flashcards in this deck.
Unlock Deck
k this deck
59
TABLE 2-4
Every spring semester, the School of Business coordinates with local business leaders a luncheon for graduating seniors, their families, and friends. Corporate sponsorship pays for the lunches of each of the seniors, but students have to purchase tickets to cover the cost of lunches served to guests they bring with them. The following histogram represents the attendance at the senior luncheon, where X is the number of guests each graduating senior invited to the luncheon and f is the number of graduating seniors in each category.
A professor of economics at a small Texas university wanted to determine what year in school students were taking his tough economics course. Shown below is a pie chart of the results. What percentage of the class took the course prior to reaching their senior year?
A) 14%
B) 44%
C) 54%
D) 86%
Unlock Deck
Unlock for access to all 277 flashcards in this deck.
Unlock Deck
k this deck
60
TABLE 2-4
Every spring semester, the School of Business coordinates with local business leaders a luncheon for graduating seniors, their families, and friends. Corporate sponsorship pays for the lunches of each of the seniors, but students have to purchase tickets to cover the cost of lunches served to guests they bring with them. The following histogram represents the attendance at the senior luncheon, where X is the number of guests each graduating senior invited to the luncheon and f is the number of graduating seniors in each category.
Referring to the histogram from Table 2-4, how many graduating seniors attended the luncheon?
A) 4
B) 152
C) 275
D) 388
Unlock Deck
Unlock for access to all 277 flashcards in this deck.
Unlock Deck
k this deck
61
TABLE 2-7
A sample of 200 students at a Big-Ten university was taken after the midterm to ask them whether they went bar hopping the weekend before the midterm or spent the weekend studying, and whether they did well or poorly on the midterm. The following table contains the result.
Referring to Table 2-7, of those who went bar hopping the weekend before the midterm in the sample, ________ percent of them did well on the midterm.
A) 15
B) 27.27
C) 30
D) 55
Unlock Deck
Unlock for access to all 277 flashcards in this deck.
Unlock Deck
k this deck
62
You have collected data on the monthly seasonally adjusted civilian unemployment rate for the United States from 1998 to 2007. Which of the following is the best for presenting the data?
A) A contingency table.
B) A stem-and-leaf display.
C) A time-series plot.
D) A side-by-side bar chart.
A) A contingency table.
B) A stem-and-leaf display.
C) A time-series plot.
D) A side-by-side bar chart.
Unlock Deck
Unlock for access to all 277 flashcards in this deck.
Unlock Deck
k this deck
63
You have collected information on the consumption by the 15 largest coffee-consuming nations. Which of the following is the best for presenting the shares of the consumption?
A) A pie chart.
B) A Pareto chart.
C) A side-by-side bar chart.
D) A contingency table.
A) A pie chart.
B) A Pareto chart.
C) A side-by-side bar chart.
D) A contingency table.
Unlock Deck
Unlock for access to all 277 flashcards in this deck.
Unlock Deck
k this deck
64
TABLE 2-7
A sample of 200 students at a Big-Ten university was taken after the midterm to ask them whether they went bar hopping the weekend before the midterm or spent the weekend studying, and whether they did well or poorly on the midterm. The following table contains the result.
Referring to Table 2-7, if the sample is a good representation of the population, we can expect ________ percent of those who spent the weekend studying to do poorly on the midterm.
A) 10
B) 20
C) 45
D) 50
Unlock Deck
Unlock for access to all 277 flashcards in this deck.
Unlock Deck
k this deck
65
TABLE 2-7
A sample of 200 students at a Big-Ten university was taken after the midterm to ask them whether they went bar hopping the weekend before the midterm or spent the weekend studying, and whether they did well or poorly on the midterm. The following table contains the result.
Referring to Table 2-7, ________ percent of the students in the sample spent the weekend studying and did well on the midterm.
A) 40
B) 50
C) 72.72
D) 80
Unlock Deck
Unlock for access to all 277 flashcards in this deck.
Unlock Deck
k this deck
66
You have collected data on the number of U.S. households actively using online banking and/or online bill payment from 1995 to 2007. Which of the following is the best for presenting the data?
A) A pie chart.
B) A stem-and-leaf display.
C) A side-by-side bar chart.
D) A time-series plot.
A) A pie chart.
B) A stem-and-leaf display.
C) A side-by-side bar chart.
D) A time-series plot.
Unlock Deck
Unlock for access to all 277 flashcards in this deck.
Unlock Deck
k this deck
67
You have collected information on the market share of 5 different search engines used by U.S. Internet users in May 2007. Which of the following is the best for presenting the information?
A) A pie chart.
B) A histogram.
C) A stem-and-leaf display.
D) A contingency table.
A) A pie chart.
B) A histogram.
C) A stem-and-leaf display.
D) A contingency table.
Unlock Deck
Unlock for access to all 277 flashcards in this deck.
Unlock Deck
k this deck
68
In a contingency table, the number of rows and columns
A) must always be the same.
B) must always be 2.
C) must add to 100%.
D) None of the above.
A) must always be the same.
B) must always be 2.
C) must add to 100%.
D) None of the above.
Unlock Deck
Unlock for access to all 277 flashcards in this deck.
Unlock Deck
k this deck
69
Data on 1,500 students' height were collected at a larger university in the East Coast. Which of the following is the best chart for presenting the information?
A) A pie chart.
B) A Pareto chart.
C) A side-by-side bar chart.
D) A histogram.
A) A pie chart.
B) A Pareto chart.
C) A side-by-side bar chart.
D) A histogram.
Unlock Deck
Unlock for access to all 277 flashcards in this deck.
Unlock Deck
k this deck
70
A survey of 150 executives were asked what they think is the most common mistake candidates make during job interviews. Six different mistakes were given. Which of the following is the best for presenting the information?
A) A bar chart.
B) A histogram.
C) A stem-and-leaf display.
D) A contingency table.
A) A bar chart.
B) A histogram.
C) A stem-and-leaf display.
D) A contingency table.
Unlock Deck
Unlock for access to all 277 flashcards in this deck.
Unlock Deck
k this deck
71
TABLE 2-7
A sample of 200 students at a Big-Ten university was taken after the midterm to ask them whether they went bar hopping the weekend before the midterm or spent the weekend studying, and whether they did well or poorly on the midterm. The following table contains the result.
Referring to Table 2-7, of those who did well on the midterm in the sample, ________ percent of them went bar hopping the weekend before the midterm.
A) 15
B) 27.27
C) 30
D) 50
Unlock Deck
Unlock for access to all 277 flashcards in this deck.
Unlock Deck
k this deck
72
TABLE 2-7
A sample of 200 students at a Big-Ten university was taken after the midterm to ask them whether they went bar hopping the weekend before the midterm or spent the weekend studying, and whether they did well or poorly on the midterm. The following table contains the result.
Referring to Table 2-7, ________ percent of the students in the sample went bar hopping the weekend before the midterm and did well on the midterm.
A) 15
B) 27.27
C) 30
D) 50
Unlock Deck
Unlock for access to all 277 flashcards in this deck.
Unlock Deck
k this deck
73
TABLE 2-7
A sample of 200 students at a Big-Ten university was taken after the midterm to ask them whether they went bar hopping the weekend before the midterm or spent the weekend studying, and whether they did well or poorly on the midterm. The following table contains the result.
Referring to Table 2-7, if the sample is a good representation of the population, we can expect ________ percent of those who did poorly on the midterm to have spent the weekend studying.
A) 10
B) 22.22
C) 45
D) 50
Unlock Deck
Unlock for access to all 277 flashcards in this deck.
Unlock Deck
k this deck
74
You have collected data on the responses to two questions asked in a survey of 40 college students majoring in business-What is your gender (Male = M; Female =F) and What is your major (Accountancy = A; Computer Information Systems = C; Marketing = M). Which of the following is the best for presenting the data?
A) A contingency table.
B) A stem-and-leaf display.
C) A time-series plot.
D) A Pareto chart.
A) A contingency table.
B) A stem-and-leaf display.
C) A time-series plot.
D) A Pareto chart.
Unlock Deck
Unlock for access to all 277 flashcards in this deck.
Unlock Deck
k this deck
75
Data on the number of credit hours of 20,000 students at a public university enrolled in a Spring semester were collected. Which of the following is the best for presenting the information?
A) A pie chart.
B) A Pareto chart.
C) A stem-and-leaf display.
D) A contingency table.
A) A pie chart.
B) A Pareto chart.
C) A stem-and-leaf display.
D) A contingency table.
Unlock Deck
Unlock for access to all 277 flashcards in this deck.
Unlock Deck
k this deck
76
Data on the number of part-time hours students at a public university worked in a week were collected. Which of the following is the best chart for presenting the information?
A) A pie chart.
B) A Pareto chart.
C) A percentage table.
D) A percentage polygon.
A) A pie chart.
B) A Pareto chart.
C) A percentage table.
D) A percentage polygon.
Unlock Deck
Unlock for access to all 277 flashcards in this deck.
Unlock Deck
k this deck
77
TABLE 2-7
A sample of 200 students at a Big-Ten university was taken after the midterm to ask them whether they went bar hopping the weekend before the midterm or spent the weekend studying, and whether they did well or poorly on the midterm. The following table contains the result.
Referring to Table 2-7, if the sample is a good representation of the population, we can expect ________ percent of the students in the population to spend the weekend studying and do poorly on the midterm.
A) 10
B) 20
C) 45
D) 50
Unlock Deck
Unlock for access to all 277 flashcards in this deck.
Unlock Deck
k this deck
78
You have collected data on the annual average amount of cash rebate offered by 6 different brands of automobiles sold in the US in 2006 and in 2007. Which of the following is the best for presenting the data?
A) A contingency table.
B) A stem-and-leaf display.
C) A time-series plot.
D) A side-by-side bar chart.
A) A contingency table.
B) A stem-and-leaf display.
C) A time-series plot.
D) A side-by-side bar chart.
Unlock Deck
Unlock for access to all 277 flashcards in this deck.
Unlock Deck
k this deck
79
You have collected data on the approximate retail price (in $) and the energy cost per year (in $) of 15 refrigerators. Which of the following is the best for presenting the data?
A) A pie chart.
B) A scatter chart.
C) A side-by-side bar chart.
D) A contingency table.
A) A pie chart.
B) A scatter chart.
C) A side-by-side bar chart.
D) A contingency table.
Unlock Deck
Unlock for access to all 277 flashcards in this deck.
Unlock Deck
k this deck
80
When studying the simultaneous responses to two categorical questions, we should set up a
A) contingency table.
B) frequency distribution table.
C) cumulative percentage distribution table.
D) histogram.
A) contingency table.
B) frequency distribution table.
C) cumulative percentage distribution table.
D) histogram.
Unlock Deck
Unlock for access to all 277 flashcards in this deck.
Unlock Deck
k this deck
Unlock Deck
Unlock for access to all 277 flashcards in this deck.


