Deck 2: Economic Theories,data,and Graphs
Full screen (f)
Question
Question
Question
Question
Question
Question
Question
Question
Question
Question
Question
Question
Question
Question
Question
Question
Question
Question
Question
Question
Question
Question
Question
Question
Question
Question
Question
Question
Question
Question
Question
Question
Question
The table below shows hypothetical per- minute cell phone charges for "pay- and- talk" service over several years.  TABLE 2- 2
Let 1 stand for "any given period" and 2 stand for "base period." The formula of any index number can be written as: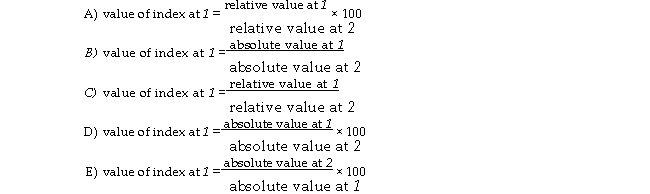
TABLE 2- 2Let 1 stand for "any given period" and 2 stand for "base period." The formula of any index number can be written as:
Question
Question
Question
Question
Question
Question
Question
Question
Question
Question
Question
Question
Question
Question
Question
Question
Question
Question
Question
Question
Question
Question
Question
Question
Question
Question
Question
Question
Question
FIGURE 2- 3 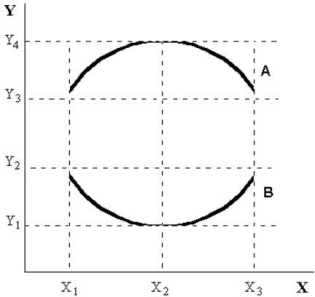
Refer to Figure 2- 3.At X2 on curve A,the
A)minimum occurs at Y4.
B)slope is increasing.
C)slope of the curve is zero.
D)maximum occurs at Y1.
E)slope is decreasing.
Refer to Figure 2- 3.At X2 on curve A,the
A)minimum occurs at Y4.
B)slope is increasing.
C)slope of the curve is zero.
D)maximum occurs at Y1.
E)slope is decreasing.
Question
Question
Question
Question
Question
Question
Question
Question
Question
Question
Question
Question
FIGURE 2- 3
At the minimum or the maximum of the graph of a non- linear function (with x on the horizontal axis and y on the vertical axis)the marginal response of y to a small change in x is
A)0.
B)1.
C)undefined.
D)- 1.
E)infinite.
At the minimum or the maximum of the graph of a non- linear function (with x on the horizontal axis and y on the vertical axis)the marginal response of y to a small change in x is
A)0.
B)1.
C)undefined.
D)- 1.
E)infinite.
Question
Question
Question
Question
Question
Question

Unlock Deck
Sign up to unlock the cards in this deck!
Unlock Deck
Unlock Deck
1/85
Play
Full screen (f)
Deck 2: Economic Theories,data,and Graphs
1
The table below shows hypothetical data for the volume of gold and nickel output across several years. TABLE 2- 4
-Refer to Table 2- 4.What is the index number for nickel output in Year 6?
A)105.3
B)110.7
C)108.2
D)95.0
E)95.0%
-Refer to Table 2- 4.What is the index number for nickel output in Year 6?
A)105.3
B)110.7
C)108.2
D)95.0
E)95.0%
105.3
2
Suppose that two points on a straight line are (X = 4,Y = 5),and (X = 2,Y = 1).The slope of this line is
A)2.
B)4 .
C)- 1 .
D)- 2.
E)1 . 5 2 2
A)2.
B)4 .
C)- 1 .
D)- 2.
E)1 . 5 2 2
A
3
Suppose point A represents co- ordinates (x=2,y=16)and point B represents coordinates (x=10,y=4).What is the slope of the straight line joining points A and B?
A)0.75
B)- 0.43
C)1.5
D)- 1.5
E)- 0.75
A)0.75
B)- 0.43
C)1.5
D)- 1.5
E)- 0.75
D
4
Which of the following is a normative statement?
A)Reducing unemployment is more important than reducing inflation.
B)An increase in the price of lumber is followed by a decrease in the construction of new houses.
C)A government deficit will reduce unemployment and cause an increase in prices.
D)Queen Elizabeth II is the wealthiest woman in the world.
E)The sun rises in the west and sets in the east.
Unlock Deck
Unlock for access to all 85 flashcards in this deck.
Unlock Deck
k this deck
5
Suppose we observe that consumption of electricity decreases when the price of electricity rises.We can say that the two variables are related
A)negatively.
B)positively.
C)exogenously.
D)linearly.
E)non- linearly.
A)negatively.
B)positively.
C)exogenously.
D)linearly.
E)non- linearly.
Unlock Deck
Unlock for access to all 85 flashcards in this deck.
Unlock Deck
k this deck
6
An economic theory requires,among other things,
A)a set of definitions of the variables to be considered.
B)that the set of predictions be correct.
C)a controlled laboratory setting in which the theory can be tested.
D)the use of endogenous variables only.
E)a set of value judgments to interpret the empirical evidence.
A)a set of definitions of the variables to be considered.
B)that the set of predictions be correct.
C)a controlled laboratory setting in which the theory can be tested.
D)the use of endogenous variables only.
E)a set of value judgments to interpret the empirical evidence.
Unlock Deck
Unlock for access to all 85 flashcards in this deck.
Unlock Deck
k this deck
7
The table below shows hypothetical data for the volume of gold and nickel output across several years. TABLE 2- 4
-Refer to Table 2- 4.What is the index number for gold output in Year 1?
A)91.2
B)0.91
C)99.7
D)109.7
E)1.097
-Refer to Table 2- 4.What is the index number for gold output in Year 1?
A)91.2
B)0.91
C)99.7
D)109.7
E)1.097
Unlock Deck
Unlock for access to all 85 flashcards in this deck.
Unlock Deck
k this deck
8
Which is an example of a positive statement?
A)Substitutes for fossil fuels should be developed.
B)There should be one price for gasoline throughout Canada.
C)Corporations in Canada should pay more taxes.
D)Canada should reduce its imports of consumer goods.
E)The higher the price for gasoline,the less of it will be consumed.
A)Substitutes for fossil fuels should be developed.
B)There should be one price for gasoline throughout Canada.
C)Corporations in Canada should pay more taxes.
D)Canada should reduce its imports of consumer goods.
E)The higher the price for gasoline,the less of it will be consumed.
Unlock Deck
Unlock for access to all 85 flashcards in this deck.
Unlock Deck
k this deck
9
FIGURE 2- 4
Suppose we have data for 1000 students for a period of one year.The data show that those students who spend more hours studying have a higher grade point average (GPA).We can say that
A)there is a causal relationship between hours of study time and GPA.
B)there is a positive correlation between hours of study time and GPA.
C)more hours spent studying leads to a higher GPA.
D)if hours of study time increase,then GPA will automatically increase.
E)having a higher GPA leads students to spend more time studying.
Unlock Deck
Unlock for access to all 85 flashcards in this deck.
Unlock Deck
k this deck
10
The table below shows hypothetical tuition costs at a Canadian university. TABLE 2- 1
-Refer to Table 2- 1.Assume that 2008 is used as the base year,with the index number = 100.The value of the index number in 2012 is
A)0.96
B)100
C)96
D)1.04
E)104
-Refer to Table 2- 1.Assume that 2008 is used as the base year,with the index number = 100.The value of the index number in 2012 is
A)0.96
B)100
C)96
D)1.04
E)104
Unlock Deck
Unlock for access to all 85 flashcards in this deck.
Unlock Deck
k this deck
11
The statement "Y is a function of X" means that the
A)value of Y depends on that of X.
B)values of Y and X are related to some third variable.
C)value of X depends on that of Y.
D)values of Y and X are the same.
E)values of Y and X are independent.
A)value of Y depends on that of X.
B)values of Y and X are related to some third variable.
C)value of X depends on that of Y.
D)values of Y and X are the same.
E)values of Y and X are independent.
Unlock Deck
Unlock for access to all 85 flashcards in this deck.
Unlock Deck
k this deck
12
The table below shows hypothetical data for the volume of gold and nickel output across several years. TABLE 2- 4
-Suppose an economist tells you that,on average,people in Canada have too much personal debt.This is an example of a(n)statement.
A)positive
B)normative
C)induced
D)autonomous
E)independent
-Suppose an economist tells you that,on average,people in Canada have too much personal debt.This is an example of a(n)statement.
A)positive
B)normative
C)induced
D)autonomous
E)independent
Unlock Deck
Unlock for access to all 85 flashcards in this deck.
Unlock Deck
k this deck
13
The scientific approach to economic inquiry involves
A)testing the reality of the assumptions of the model.
B)using only endogenous variables in economic models.
C)using only independent variables.
D)testing the predictions with empirical data.
E)choosing data that will support the predictions.
A)testing the reality of the assumptions of the model.
B)using only endogenous variables in economic models.
C)using only independent variables.
D)testing the predictions with empirical data.
E)choosing data that will support the predictions.
Unlock Deck
Unlock for access to all 85 flashcards in this deck.
Unlock Deck
k this deck
14
FIGURE 2- 4
Refer to Figure 2- 4.This non- linear function shows that over the range shown,
A)as more fertilizer is applied,the marginal change in yield is diminishing.
B)as more fertilizer is applied,the marginal response in yield is increasing
C)as the yield per acre increases,the amount of fertilizer required per acre is diminishing.
D)as more fertilizer is applied,the total yield per acre is diminishing.
E)as the yield per acre increases,the amount of fertilizer required per acre is increasing.
Unlock Deck
Unlock for access to all 85 flashcards in this deck.
Unlock Deck
k this deck
15
When an increase in one variable is associated with an increase in a second variable,the two variables are
A)proportionally related.
B)positively related.
C)equivalent.
D)inversely proportionally related.
E)negatively related.
A)proportionally related.
B)positively related.
C)equivalent.
D)inversely proportionally related.
E)negatively related.
Unlock Deck
Unlock for access to all 85 flashcards in this deck.
Unlock Deck
k this deck
16
Suppose that over a 12- month period,Sonali's income (Y)rises from $27 000 to $35 000 per year and,as a result,her spending on travel (T)increases from $1500 to $2500 per year.Assume there is a linear relation between the two variables,Y and T.What is the marginal response in T to a change in Y?
A)4
B)0.25
C)8
D)0.125
E)0
A)4
B)0.25
C)8
D)0.125
E)0
Unlock Deck
Unlock for access to all 85 flashcards in this deck.
Unlock Deck
k this deck
17
Economists build models that abstract from the complexities of reality because
A)the complexities of reality are unimportant.
B)it is easier to do so.
C)economists do not understand the real world.
D)they believe they gain a greater understanding of reality.
E)economists are not interested in reality.
A)the complexities of reality are unimportant.
B)it is easier to do so.
C)economists do not understand the real world.
D)they believe they gain a greater understanding of reality.
E)economists are not interested in reality.
Unlock Deck
Unlock for access to all 85 flashcards in this deck.
Unlock Deck
k this deck
18
When using statistics in economics,the possibility of error
A)cannot be controlled.
B)cannot be eliminated.
C)can be eliminated with more sophisticated statistical techniques.
D)is not considered to be important.
E)cannot be evaluated.
A)cannot be controlled.
B)cannot be eliminated.
C)can be eliminated with more sophisticated statistical techniques.
D)is not considered to be important.
E)cannot be evaluated.
Unlock Deck
Unlock for access to all 85 flashcards in this deck.
Unlock Deck
k this deck
19
Economic theories
A)must apply to all economies to be true.
B)can be used to help explain and predict economic behaviour.
C)are not useful because of the unrealistic assumptions they contain.
D)cannot help to predict future behaviour.
E)cannot be tested because we cannot do economic "experiments."
A)must apply to all economies to be true.
B)can be used to help explain and predict economic behaviour.
C)are not useful because of the unrealistic assumptions they contain.
D)cannot help to predict future behaviour.
E)cannot be tested because we cannot do economic "experiments."
Unlock Deck
Unlock for access to all 85 flashcards in this deck.
Unlock Deck
k this deck
20
Data collected repeatedly over successive periods of time are called
A)topographic data.
B)time- series data.
C)cross- sectional data.
D)logarithmic data.
E)time- analysis data.
A)topographic data.
B)time- series data.
C)cross- sectional data.
D)logarithmic data.
E)time- analysis data.
Unlock Deck
Unlock for access to all 85 flashcards in this deck.
Unlock Deck
k this deck
21
Which of the following statements is NOT correct?
A)Positive statements can best be tested by exposing them to empirical evidence.
B)Economic predictions cannot be tested because human decisions involve free will.
C)An economic model can be useful even if its underlying assumptions are unrealistic.
D)Economists test their theories by confronting the predictions of their theories with the evidence drawn from the real world.
E)Normative statements cannot be tested by the scientific method.
Unlock Deck
Unlock for access to all 85 flashcards in this deck.
Unlock Deck
k this deck
22
The statement that a country's rate of GDP growth is influenced by individuals' saving behaviour is an example of a(n)
A)theory.
B)normative statement.
C)prediction.
D)economic law.
E)variable.
A)theory.
B)normative statement.
C)prediction.
D)economic law.
E)variable.
Unlock Deck
Unlock for access to all 85 flashcards in this deck.
Unlock Deck
k this deck
23
At the minimum or the maximum of the graph of a non- linear function (with x on the horizontal axis and y on the vertical axis)the slope of the curve is
A)- 1.
B)undefined.
C)1.
D)0.
E)infinite.
A)- 1.
B)undefined.
C)1.
D)0.
E)infinite.
Unlock Deck
Unlock for access to all 85 flashcards in this deck.
Unlock Deck
k this deck
24
According to the Bank of Canada's website,Canada's Consumer Price Index (CPI)in August 2009 was 114.7,August 2010 was 116.7,August 2011 was 120.3 and August 2012 was 121.8.Given this set of index numbers,what is the percentage change in the average level of prices between August 2009 and August 2012?
A)114.7%
B)6.2%
C)7.1%
D)5.8%
E)121.8%
A)114.7%
B)6.2%
C)7.1%
D)5.8%
E)121.8%
Unlock Deck
Unlock for access to all 85 flashcards in this deck.
Unlock Deck
k this deck
25
The statement that introducing a policy of legislated rent controls will lead to a housing shortage is an example of a(n)
A)prediction.
B)model.
C)theory.
D)normative statement.
E)assumption.
A)prediction.
B)model.
C)theory.
D)normative statement.
E)assumption.
Unlock Deck
Unlock for access to all 85 flashcards in this deck.
Unlock Deck
k this deck
26
Most economists believe that economic analysis be made completely free of judgement,in part because it is to absolutely refute a theory on the basis of factual evidence.
A)can; impossible
B)will; necessary
C)cannot; impossible
D)can; possible
E)cannot; possible
A)can; impossible
B)will; necessary
C)cannot; impossible
D)can; possible
E)cannot; possible
Unlock Deck
Unlock for access to all 85 flashcards in this deck.
Unlock Deck
k this deck
27
Choose the answer that best explains why economists build models that abstract from the complexities of reality.
A)Because economists are not interested in reality.
B)Because economics deals only in the abstract.
C)Because the complexities of reality are unimportant.
D)Because this allows economists to conduct controlled experiments to test their theories.
E)Because they believe they gain a greater understanding of reality.
Unlock Deck
Unlock for access to all 85 flashcards in this deck.
Unlock Deck
k this deck
28
The table below shows hypothetical per- minute cell phone charges for "pay- and- talk" service over several years. TABLE 2- 2
-Refer to Table 2- 2.Assume that 2008 is used as the base year,with the index number = 100.The value of the index number in 2011 is calculated as follows:
A)0.55/0.35 = 1.57
B)(0.55/0.35)× 100 = 157.14
C)(0.35/0.55)× 100 = 63.64
D)0.35 × 100 = 35
E)0.35/0.55 = 0.64
-Refer to Table 2- 2.Assume that 2008 is used as the base year,with the index number = 100.The value of the index number in 2011 is calculated as follows:
A)0.55/0.35 = 1.57
B)(0.55/0.35)× 100 = 157.14
C)(0.35/0.55)× 100 = 63.64
D)0.35 × 100 = 35
E)0.35/0.55 = 0.64
Unlock Deck
Unlock for access to all 85 flashcards in this deck.
Unlock Deck
k this deck
29
Suppose point A represents coordinates (X = 5,Y = 6)and point B represents coordinates (X = 2,Y = 3).Then the slope of the straight line joining points A and B is
A)2/3.
B)5/6.
C)1.
D)3/2.
E)- 1.
A)2/3.
B)5/6.
C)1.
D)3/2.
E)- 1.
Unlock Deck
Unlock for access to all 85 flashcards in this deck.
Unlock Deck
k this deck
30
The table below shows hypothetical data for volumes of e- books and hardcover books sold over a 3- year period in a particular city. TABLE 2- 3
-For a given year,an index number of average prices across the economy (such as the Consumer Price Index)is the ratio of the
A)weighted prices of a typical bundle of goods purchased in a given year to that in the base year.
B)weighted prices of a typical bundle of goods purchased in the base year to that in the given year.
C)price of several goods in the given year to that in the base year.
D)average price of several goods in the base year to that in the given year.
E)average price of all goods in the given year to that in the base year.
Unlock Deck
Unlock for access to all 85 flashcards in this deck.
Unlock Deck
k this deck
31
An economist collects data comparing per- capita expenditures on health care across provinces and territories for the year 2012.The best way to illustrate this data is
A)a scatter diagram.
B)a time- series bar chart diagram.
C)a time- series line graph.
D)a logarithmic scale diagram.
E)a cross- sectional bar- chart graph.
A)a scatter diagram.
B)a time- series bar chart diagram.
C)a time- series line graph.
D)a logarithmic scale diagram.
E)a cross- sectional bar- chart graph.
Unlock Deck
Unlock for access to all 85 flashcards in this deck.
Unlock Deck
k this deck
32
When studying economic data,index numbers are especially valuable when comparing
A)linear and logarithmic data.
B)relative movements in different variables measured in different units.
C)time- series data with cross- sectional data.
D)relative movements in real and nominal variables.
E)government data with private- sector data.
A)linear and logarithmic data.
B)relative movements in different variables measured in different units.
C)time- series data with cross- sectional data.
D)relative movements in real and nominal variables.
E)government data with private- sector data.
Unlock Deck
Unlock for access to all 85 flashcards in this deck.
Unlock Deck
k this deck
33
The table below shows hypothetical per- minute cell phone charges for "pay- and- talk" service over several years. TABLE 2- 2
Let 1 stand for "any given period" and 2 stand for "base period." The formula of any index number can be written as:
TABLE 2- 2Let 1 stand for "any given period" and 2 stand for "base period." The formula of any index number can be written as:
Unlock Deck
Unlock for access to all 85 flashcards in this deck.
Unlock Deck
k this deck
34
The table below shows hypothetical data for volumes of e- books and hardcover books sold over a 3- year period in a particular city. TABLE 2- 3
-Refer to Table 2- 3.Between Year 1 and Year 3,what is the percentage change in sales of hardcover books?
A)- 0.569%
B)- 56.9%
C)56.9%
D)- 569%
E)0.569%
-Refer to Table 2- 3.Between Year 1 and Year 3,what is the percentage change in sales of hardcover books?
A)- 0.569%
B)- 56.9%
C)56.9%
D)- 569%
E)0.569%
Unlock Deck
Unlock for access to all 85 flashcards in this deck.
Unlock Deck
k this deck
35
The table below shows hypothetical data for volumes of e- books and hardcover books sold over a 3- year period in a particular city. TABLE 2- 3
-Refer to Table 2- 3.Suppose we choose Year 1 as the base year and construct a series of index numbers with which to analyze sales data.The index numbers for volumes of hardcover books sold (starting with Year 1)is:
A)100; 0.819; 0.431
B)0.431; 0.819; 100
C)431; 819; 100
D)43.1; 81.9; 100
E)100; 81.9; 43.1
Unlock Deck
Unlock for access to all 85 flashcards in this deck.
Unlock Deck
k this deck
36
Consider the line which is the graph of the function Y = 60 - 4X.The slope of this line is
A)- 4.0.
B)- 2.5.
C)60.
D)- 40.
E)4.
A)- 4.0.
B)- 2.5.
C)60.
D)- 40.
E)4.
Unlock Deck
Unlock for access to all 85 flashcards in this deck.
Unlock Deck
k this deck
37
An economic model that contains a highly realistic set of assumptions is
A)certainly superior to a model whose assumptions are highly unrealistic.
B)more abstract than a model whose assumptions are further removed from reality.
C)useful because there is then very little difference between "theory" and "reality."
D)necessarily better able to predict the future.
E)not likely to be useful because of its particularized nature and its complexity.
Unlock Deck
Unlock for access to all 85 flashcards in this deck.
Unlock Deck
k this deck
38
The table below shows hypothetical tuition costs at a Canadian university. TABLE 2- 1
-Suppose economists at the World Bank discover a positive correlation between family income and female education levels in developing countries.We can say that
A)an increase in female education levels causes an increase in family incomes.
B)the correlation is inconsistent with a theory that an increase in female education levels causes an increase in family income.
C)the observed correlation is consistent with a theory that an increase in female education levels causes an increase in family income.
D)an increase in family income causes an increase in female education levels.
E)there is a causal relationship between family income and female education.
Unlock Deck
Unlock for access to all 85 flashcards in this deck.
Unlock Deck
k this deck
39
The base year for an index number is
A)chosen arbitrarily by those who construct the data.
B)dependant upon the type of data.
C)declared by the federal government.
D)the year in which 2 or more index numbers are equal to 100.
E)determined by the year the variable equals exactly 100.
A)chosen arbitrarily by those who construct the data.
B)dependant upon the type of data.
C)declared by the federal government.
D)the year in which 2 or more index numbers are equal to 100.
E)determined by the year the variable equals exactly 100.
Unlock Deck
Unlock for access to all 85 flashcards in this deck.
Unlock Deck
k this deck
40
The table below shows hypothetical data for volumes of e- books and hardcover books sold over a 3- year period in a particular city. TABLE 2- 3
-When studying economic data,and when comparing the magnitude of changes in variables with different scales it is best to
A)express each variable as an index number.
B)compare the relative data on each variable.
C)compare the absolute data on each variable.
D)use only time- series data.
E)express each variable as a logarithmic number.
Unlock Deck
Unlock for access to all 85 flashcards in this deck.
Unlock Deck
k this deck
41
As a science,economics is disadvantaged in that
A)some economic variables are determined within the theory.
B)economic variables do not change enough to provide reliable data for testing hypotheses.
C)it deals with human behaviour and thus is not open to empirical testing.
D)it is usually not possible to conduct controlled experiments in economics,in contrast with certain other sciences.
E)economic hypotheses cannot be accepted with complete certainty,by contrast with the other sciences.
Unlock Deck
Unlock for access to all 85 flashcards in this deck.
Unlock Deck
k this deck
42
The slope of a curve is
A)always constant.
B)always negative.
C)positive if the curve rises to the right.
D)always positive.
E)negative if the curve rises to the right.
A)always constant.
B)always negative.
C)positive if the curve rises to the right.
D)always positive.
E)negative if the curve rises to the right.
Unlock Deck
Unlock for access to all 85 flashcards in this deck.
Unlock Deck
k this deck
43
Suppose that a particular theory predicts that on sunny days consumption of ice cream will rise and that on cloudy days consumption of ice cream will fall.If an economist tests this theory and finds that over a six- month period the theory predicts accurately,the economist would likely say
A)the evidence fails to reject the theory.
B)the theory shouldn't be taken seriously.
C)the theory has been proven correct.
D)that the theory is not useful because consumption involves irrational human behaviour.
E)the theory is always reliable.
A)the evidence fails to reject the theory.
B)the theory shouldn't be taken seriously.
C)the theory has been proven correct.
D)that the theory is not useful because consumption involves irrational human behaviour.
E)the theory is always reliable.
Unlock Deck
Unlock for access to all 85 flashcards in this deck.
Unlock Deck
k this deck
44
A scientific prediction is
A)always based on the law of large numbers.
B)a conditional statement of the following form: if A occurs,then B will follow.
C)a causal statement of the following form: A will occur because B occurred.
D)a prophesy of how the future will unfold.
E)not testable.
A)always based on the law of large numbers.
B)a conditional statement of the following form: if A occurs,then B will follow.
C)a causal statement of the following form: A will occur because B occurred.
D)a prophesy of how the future will unfold.
E)not testable.
Unlock Deck
Unlock for access to all 85 flashcards in this deck.
Unlock Deck
k this deck
45
Which of the following best describes the relationship between positive and normative statements in economics?
A)Neither positive nor normative statements are concerned with the desirability of certain economic changes.
B)Normative statements evaluate the desirability of certain economic changes; positive statements do not.
C)Normative statements are those with which all economists agree; positive statements may give rise to some disagreement.
D)Economists generally agree with each other regardless of whether a question is positive or normative.
E)Positive and normative statements are alternate ways of describing the desirability of certain economic policies.
Unlock Deck
Unlock for access to all 85 flashcards in this deck.
Unlock Deck
k this deck
46
The table below shows hypothetical data for volumes of e- books and hardcover books sold over a 3- year period in a particular city. TABLE 2- 3
-Refer to Table 2- 3.Suppose we choose Year 1 as the base year and construct a series of index numbers with which to analyze the sales data.The index numbers for volumes of e- books sold (starting with Year 1)is:
A)100; 226.1; 460.9
B)1; 0.442; 0.217
C)23 000; 52 000; 106 000
D)100; 126.1; 360.1
E)100; 44.2; 21.7
Unlock Deck
Unlock for access to all 85 flashcards in this deck.
Unlock Deck
k this deck
47
Which of the following statements belongs more properly in the field of normative economics than positive economics?
A)When a drought occurs,the price of vegetables tends to rise.
B)Technological change has reduced the cost of cell phone service.
C)The price of one Canadian dollar is $0.85 U.S.
D)Canadian governments should provide assistance to the auto industry.
E)An increase in the minimum wage leads to more unemployment.
Unlock Deck
Unlock for access to all 85 flashcards in this deck.
Unlock Deck
k this deck
48
Which of the following is a normative statement?
A)A reduction in export taxes on petroleum would result in higher wages.
B)The higher is the level of taxes,the higher are wage demands.
C)The higher is the level of taxes,the lower is consumption spending.
D)A free- trade agreement between two countries will result in an increase in trade.
E)Tuition fees should be waived for low- income students.
Unlock Deck
Unlock for access to all 85 flashcards in this deck.
Unlock Deck
k this deck
49
The table below shows hypothetical data for volumes of e- books and hardcover books sold over a 3- year period in a particular city. TABLE 2- 3
-Which is the best description of positive statements? Positive statements
A)form the basis of all normative arguments.
B)have been verified by appeal to factual evidence.
C)have no place in economics because economics deals only with value judgments.
D)are falsifiable in principle by appeal to factual evidence.
E)are seldom employed in social sciences like economics.
Unlock Deck
Unlock for access to all 85 flashcards in this deck.
Unlock Deck
k this deck
50
FIGURE 2- 3
Suppose there is a linear relationship between the ticket price (P)to a university basketball game and the number of tickets sold (Q).If the ticket price is $20,then 600 tickets are sold; if the ticket price is $8,then $3000 tickets are sold.What is the slope of the function if Q is plotted on the horizontal axis and P is plotted on the vertical axis?
A)0.005
B)- 0.005
C)- 0.05
D)0.05
E)0
Unlock Deck
Unlock for access to all 85 flashcards in this deck.
Unlock Deck
k this deck
51
The table below shows hypothetical data for volumes of e- books and hardcover books sold over a 3- year period in a particular city. TABLE 2- 3
-Refer to Table 2- 3.Between Year 1 and Year 3,what is the percentage change in sales of e- books?
A)83 000%
B)360.9%
C)83%
D)21.7%
E)460.9%
-Refer to Table 2- 3.Between Year 1 and Year 3,what is the percentage change in sales of e- books?
A)83 000%
B)360.9%
C)83%
D)21.7%
E)460.9%
Unlock Deck
Unlock for access to all 85 flashcards in this deck.
Unlock Deck
k this deck
52
In order to test a theory,one must
A)use assumptions that most closely reflect reality.
B)develop normative statements from the law of large numbers.
C)confront the predictions of the theory with evidence.
D)present a series of normative statements and positive statements.
E)develop a better explanation than the one presented.
A)use assumptions that most closely reflect reality.
B)develop normative statements from the law of large numbers.
C)confront the predictions of the theory with evidence.
D)present a series of normative statements and positive statements.
E)develop a better explanation than the one presented.
Unlock Deck
Unlock for access to all 85 flashcards in this deck.
Unlock Deck
k this deck
53
Suppose a theory predicts that lowering tuition fees at Canadian universities will increase enrollment from low- income households.If empirical evidence consistently rejects this prediction,then we
A)should test the theory again.
B)need to amend the theory.
C)change the exogenous variables in the theory.
D)should change the empirical data.
E)should increase tuition fees back to their initial level.
A)should test the theory again.
B)need to amend the theory.
C)change the exogenous variables in the theory.
D)should change the empirical data.
E)should increase tuition fees back to their initial level.
Unlock Deck
Unlock for access to all 85 flashcards in this deck.
Unlock Deck
k this deck
54
Suppose point A represents co- ordinates (X=10,Y=12)and point B represents co- ordinates (X=5,Y=7).The slope of the straight line joining points A and B is
A)1.
B)3/2.
C)- 1.
D)5/6.
E)2/3.
A)1.
B)3/2.
C)- 1.
D)5/6.
E)2/3.
Unlock Deck
Unlock for access to all 85 flashcards in this deck.
Unlock Deck
k this deck
55
The table below shows hypothetical data for volumes of e- books and hardcover books sold over a 3- year period in a particular city. TABLE 2- 3
-If a theory's prediction is tested and rejected,
A)a new hypothesis is usually suggested and tested.
B)it is rejected with certainty,because it is not possible to reject a hypothesis that is actually true.
C)inquiry into the matter should cease.
D)the original data and assumptions should be discarded.
E)the statistical tolerance of risk for accepting a false hypothesis should be increased.
Unlock Deck
Unlock for access to all 85 flashcards in this deck.
Unlock Deck
k this deck
56
The assumptions of a theory
A)are indirectly refuted if and when the theory itself is rejected by empirical observation.
B)are not necessary for the scientific approach.
C)are supposed to be as unrealistic as possible.
D)are assumed to be true even when empirical observation rejects the predictions of the theory.
E)must be realistic if the theory is to be of any use.
Unlock Deck
Unlock for access to all 85 flashcards in this deck.
Unlock Deck
k this deck
57
FIGURE 2- 3
Refer to Figure 2- 3.On curve A,the maximum value of Y occurs at
A)X1.
B)X = 0.
C)X2.
D)values of X greater than X3.
E)X3.
Refer to Figure 2- 3.On curve A,the maximum value of Y occurs at
A)X1.
B)X = 0.
C)X2.
D)values of X greater than X3.
E)X3.
Unlock Deck
Unlock for access to all 85 flashcards in this deck.
Unlock Deck
k this deck
58
Suppose Ahmoud would spend $1200 per year on travel,even if his annual income were zero.As his income rises,he would spend 20% of each additional dollar of income on travel.Choose the correct mathematical equation that describes the functional relation between his travel spending (T)and his income (Y).
A)T = 0.2 + 1200Y
B)Y = 1200 + 0.2T
C)T = 1200 + 0.2Y
D)Y = 1200 - 0.2T
E)T = 1200 + 0.8Y
A)T = 0.2 + 1200Y
B)Y = 1200 + 0.2T
C)T = 1200 + 0.2Y
D)Y = 1200 - 0.2T
E)T = 1200 + 0.8Y
Unlock Deck
Unlock for access to all 85 flashcards in this deck.
Unlock Deck
k this deck
59
An economist has data showing Canadian GDP for the years 1945- 2012.The best way to illustrate these data is
A)a cross- sectional bar- chart graph.
B)a time- series pie chart.
C)a time- series line graph.
D)a logarithmic scale diagram.
E)a scatter diagram.
A)a cross- sectional bar- chart graph.
B)a time- series pie chart.
C)a time- series line graph.
D)a logarithmic scale diagram.
E)a scatter diagram.
Unlock Deck
Unlock for access to all 85 flashcards in this deck.
Unlock Deck
k this deck
60
The statement that a 2% increase in the money supply leads to a 2% increase in the price level is an example of a(n)
A)model.
B)normative statement.
C)variable.
D)prediction.
E)assumption.
A)model.
B)normative statement.
C)variable.
D)prediction.
E)assumption.
Unlock Deck
Unlock for access to all 85 flashcards in this deck.
Unlock Deck
k this deck
61
Consider the functional relationship between two variables,X and Y.If Y is an increasing function of X,then
A)X remains constant as Y increases.
B)Y increases when X increases.
C)X decreases when Y increases.
D)Y decreases when X increases.
E)Y increases when X decreases.
A)X remains constant as Y increases.
B)Y increases when X increases.
C)X decreases when Y increases.
D)Y decreases when X increases.
E)Y increases when X decreases.
Unlock Deck
Unlock for access to all 85 flashcards in this deck.
Unlock Deck
k this deck
62
FIGURE 2- 3
Refer to Figure 2- 3.At X2 on curve A,the
A)minimum occurs at Y4.
B)slope is increasing.
C)slope of the curve is zero.
D)maximum occurs at Y1.
E)slope is decreasing.
Refer to Figure 2- 3.At X2 on curve A,the
A)minimum occurs at Y4.
B)slope is increasing.
C)slope of the curve is zero.
D)maximum occurs at Y1.
E)slope is decreasing.
Unlock Deck
Unlock for access to all 85 flashcards in this deck.
Unlock Deck
k this deck
63
If the graph of a function is a horizontal line,the slope of this line is
A)undefined.
B)- 1.
C)0.
D)infinity.
E)1.
A)undefined.
B)- 1.
C)0.
D)infinity.
E)1.
Unlock Deck
Unlock for access to all 85 flashcards in this deck.
Unlock Deck
k this deck
64
Economics is scientific because
A)economists routinely conduct laboratory experiments.
B)economists use data.
C)economists test hypotheses by appealing to empirical evidence.
D)individual behaviour is predictable.
E)economists routinely conduct controlled experiments.
A)economists routinely conduct laboratory experiments.
B)economists use data.
C)economists test hypotheses by appealing to empirical evidence.
D)individual behaviour is predictable.
E)economists routinely conduct controlled experiments.
Unlock Deck
Unlock for access to all 85 flashcards in this deck.
Unlock Deck
k this deck
65
Using the scientific method to approach an economic issue involves
A)formulating normative statements about it.
B)considering stock and flow variables.
C)finding the correct data to validate the theory.
D)building a theory to explain the issue and then determining if the theory can be refuted by evidence.
E)the use of controlled experiments to confirm the evidence presented by the data.
Unlock Deck
Unlock for access to all 85 flashcards in this deck.
Unlock Deck
k this deck
66
Of the following,which is the most important characteristic of a successful theory?
A)all assumptions on which the theory is based are true
B)the theory allows us to predict behaviour reasonably accurately
C)the theory provides a basis for facts about economic behaviour
D)the theory adequately explains all economic behaviour
E)the theory could never be refuted
A)all assumptions on which the theory is based are true
B)the theory allows us to predict behaviour reasonably accurately
C)the theory provides a basis for facts about economic behaviour
D)the theory adequately explains all economic behaviour
E)the theory could never be refuted
Unlock Deck
Unlock for access to all 85 flashcards in this deck.
Unlock Deck
k this deck
67
When an increase in one variable is associated with a decrease in a second variable,the two variables are
A)inversely proportionally related.
B)positively related.
C)negatively related.
D)proportionally related.
E)equivalent.
A)inversely proportionally related.
B)positively related.
C)negatively related.
D)proportionally related.
E)equivalent.
Unlock Deck
Unlock for access to all 85 flashcards in this deck.
Unlock Deck
k this deck
68
The table below shows hypothetical per- minute cell phone charges for "pay- and- talk" service over several years. TABLE 2- 2
-Refer to Table 2- 2.Assume that 2008 is used as the base year,with the index number = 100.The value of the index number in 2012 is
A)45.45
B)0.45
C)25.0
D)2.5
E)0.25
-Refer to Table 2- 2.Assume that 2008 is used as the base year,with the index number = 100.The value of the index number in 2012 is
A)45.45
B)0.45
C)25.0
D)2.5
E)0.25
Unlock Deck
Unlock for access to all 85 flashcards in this deck.
Unlock Deck
k this deck
69
The table below shows hypothetical tuition costs at a Canadian university. TABLE 2- 1
-Refer to Table 2- 1.Assume that 2008 is used as the base year,with the index number = 100.The value of the index number in 2010 is calculated as follows:
A)5100/5000 = 1.02
B)(5100/5000)× 100 = 102
C)5100/5100 = 100
D)(5000/5100)× 100 = 98
E)5000/5100 = 0.98
-Refer to Table 2- 1.Assume that 2008 is used as the base year,with the index number = 100.The value of the index number in 2010 is calculated as follows:
A)5100/5000 = 1.02
B)(5100/5000)× 100 = 102
C)5100/5100 = 100
D)(5000/5100)× 100 = 98
E)5000/5100 = 0.98
Unlock Deck
Unlock for access to all 85 flashcards in this deck.
Unlock Deck
k this deck
70
Disagreements over positive statements
A)are best handled by an appeal to the facts.
B)are basically devoid of any emotion.
C)never occur.
D)cannot arise because positive statements are facts.
E)arise from the failure to distinguish between a positive and a normative statement.
A)are best handled by an appeal to the facts.
B)are basically devoid of any emotion.
C)never occur.
D)cannot arise because positive statements are facts.
E)arise from the failure to distinguish between a positive and a normative statement.
Unlock Deck
Unlock for access to all 85 flashcards in this deck.
Unlock Deck
k this deck
71
On a coordinate graph,what is the X intercept of the function X = 60 + 3Y?
A)0
B)- 20
C)60
D)20
E)- 60
A)0
B)- 20
C)60
D)20
E)- 60
Unlock Deck
Unlock for access to all 85 flashcards in this deck.
Unlock Deck
k this deck
72
Suppose an economist tells you that the unemployment rate in Canada last year was 7.8%.This is an example of a(n)statement.
A)induced
B)imputed
C)normative
D)positive
E)autonomous
A)induced
B)imputed
C)normative
D)positive
E)autonomous
Unlock Deck
Unlock for access to all 85 flashcards in this deck.
Unlock Deck
k this deck
73
Choose the statement that best characterizes an economic theory.An economic theory
A)must be judged on its ability to explain and predict real- world phenomena.
B)is only useful if its underlying assumptions are realistic.
C)will predict more accurately if it contains a greater number of mathematical equations.
D)will be useful only if all human behaviour is rational.
E)will be useful as long as it is logically consistent.
Unlock Deck
Unlock for access to all 85 flashcards in this deck.
Unlock Deck
k this deck
74
FIGURE 2- 3
At the minimum or the maximum of the graph of a non- linear function (with x on the horizontal axis and y on the vertical axis)the marginal response of y to a small change in x is
A)0.
B)1.
C)undefined.
D)- 1.
E)infinite.
At the minimum or the maximum of the graph of a non- linear function (with x on the horizontal axis and y on the vertical axis)the marginal response of y to a small change in x is
A)0.
B)1.
C)undefined.
D)- 1.
E)infinite.
Unlock Deck
Unlock for access to all 85 flashcards in this deck.
Unlock Deck
k this deck
75
Suppose economists at the Department of Finance in Ottawa employ an economic model that predicts the effects of an increase in the GST.After implementation of the change,researchers find that the empirical data rejects the prediction.They are likely to
A)reject the empirical data as faulty because it did not support the theory.
B)modify the theory in light of this newly acquired empirical knowledge.
C)modify the prediction in light of the new evidence.
D)ignore the empirical evidence and continue using the model.
E)modify the data to suit the definitions and assumptions.
Unlock Deck
Unlock for access to all 85 flashcards in this deck.
Unlock Deck
k this deck
76
A scatter diagram
A)is a graph of a theoretical relationship between two variables.
B)plots a series of observations,showing the relationship between two variables.
C)relates time series data only.
D)relates cross- sectional data only.
E)shows the dependence of one variable on another.
A)is a graph of a theoretical relationship between two variables.
B)plots a series of observations,showing the relationship between two variables.
C)relates time series data only.
D)relates cross- sectional data only.
E)shows the dependence of one variable on another.
Unlock Deck
Unlock for access to all 85 flashcards in this deck.
Unlock Deck
k this deck
77
Suppose that a particular theory predicts that on Monday,Wednesday,and Friday the stock market will rise and that on Tuesday and Thursday the stock market will fall.If an economist tests this theory and finds that over a six- month period the theory predicts accurately,the economist would likely say that the theory
A)has been proven correct.
B)shouldn't be taken seriously.
C)is reliable.
D)is not rejected by the evidence.
E)is not useful because stock markets involve irrational human behaviour.
A)has been proven correct.
B)shouldn't be taken seriously.
C)is reliable.
D)is not rejected by the evidence.
E)is not useful because stock markets involve irrational human behaviour.
Unlock Deck
Unlock for access to all 85 flashcards in this deck.
Unlock Deck
k this deck
78
If we seek to explain the number of seats sold on a particular air route,say Toronto to Halifax,over a one- year period,we would consider many variables.Which of the following variables would be endogenous to our theory?
A)the number of airline seats sold on this route
B)the price of jet fuel
C)the average salary of Canadian airline pilots
D)the number of fog days in Halifax
E)the unemployment rate in Toronto
A)the number of airline seats sold on this route
B)the price of jet fuel
C)the average salary of Canadian airline pilots
D)the number of fog days in Halifax
E)the unemployment rate in Toronto
Unlock Deck
Unlock for access to all 85 flashcards in this deck.
Unlock Deck
k this deck
79
When it is said that variable A depends on variable B,then A is
A)a function of B.
B)a derivative of B.
C)proportional to B.
D)independent of B.
E)partially exclusive of B.
A)a function of B.
B)a derivative of B.
C)proportional to B.
D)independent of B.
E)partially exclusive of B.
Unlock Deck
Unlock for access to all 85 flashcards in this deck.
Unlock Deck
k this deck
80
Negatively related variables change such that as the value of one variable
A)increases,the value of the other decreases.
B)increases,the value of the other variable remains the same.
C)decreases,the value of the other variable remains the same.
D)decreases,the value of the other variable decreases.
E)increases,the value of the other variable increases.
A)increases,the value of the other decreases.
B)increases,the value of the other variable remains the same.
C)decreases,the value of the other variable remains the same.
D)decreases,the value of the other variable decreases.
E)increases,the value of the other variable increases.
Unlock Deck
Unlock for access to all 85 flashcards in this deck.
Unlock Deck
k this deck
Unlock Deck
Unlock for access to all 85 flashcards in this deck.


