Deck 13: How Factor Markets Work
Full screen (f)
Question
Question
Question
Consider the following production and cost schedule for a firm. The first column shows the number of units of a variable factor of production employed by the firm.  TABLE 13-1
Refer to Table 13-1. The marginal product of the 12th unit of the factor of production is
A) 4.
B) 14.
C) 20.
D) 44.
E) 64.
TABLE 13-1Refer to Table 13-1. The marginal product of the 12th unit of the factor of production is
A) 4.
B) 14.
C) 20.
D) 44.
E) 64.
Question
Question
Question
Consider the following production and cost schedule for a firm. The first column shows the number of units of a variable factor of production employed by the firm. TABLE 13-1
Refer to Table 13-1. The total revenue of the output produced by 12 units of the factor is
A) $120.
B) $520.
C) $640.
D) $768.
E) $1440.
TABLE 13-1Refer to Table 13-1. The total revenue of the output produced by 12 units of the factor is
A) $120.
B) $520.
C) $640.
D) $768.
E) $1440.
Question
Question
Question
Consider the following production and cost schedule for a firm. The first column shows the number of units of a variable factor of production employed by the firm. TABLE 13-1
Refer to Table 13-1. The marginal product of the 15th unit of the factor of production is
A) -2.
B) 0.
C) 2.
D) 82.
E) 84.
TABLE 13-1Refer to Table 13-1. The marginal product of the 15th unit of the factor of production is
A) -2.
B) 0.
C) 2.
D) 82.
E) 84.
Question
Consider the following production and cost schedule for a firm. The first column shows the number of units of a variable factor of production employed by the firm. TABLE 13-1
Refer to Table 13-1. The total revenue of the output produced by 15 units of the factor is
A) $860.
B) $150.
C) $640.
D) $780.
E) $1440.
TABLE 13-1Refer to Table 13-1. The total revenue of the output produced by 15 units of the factor is
A) $860.
B) $150.
C) $640.
D) $780.
E) $1440.
Question
Question
Question
Question
Consider the following production and cost schedule for a firm. The first column shows the number of units of a variable factor of production employed by the firm. TABLE 13-1
Refer to Table 13-1. The marginal revenue product of the 15th unit of the factor is
A) -$20.
B) $20.
C) $60.
D) $150.
E) $820.
TABLE 13-1Refer to Table 13-1. The marginal revenue product of the 15th unit of the factor is
A) -$20.
B) $20.
C) $60.
D) $150.
E) $820.
Question
Consider the following production and cost schedule for a firm. The first column shows the number of units of a variable factor of production employed by the firm. TABLE 13-1
Refer to Table 13-1. The marginal revenue product of the 14th unit of the factor is
A) -$60.
B) $60.
C) $140.
D) $700.
E) $840.
TABLE 13-1Refer to Table 13-1. The marginal revenue product of the 14th unit of the factor is
A) -$60.
B) $60.
C) $140.
D) $700.
E) $840.
Question
Question
Consider the following production and cost schedule for a firm. The first column shows the number of units of a variable factor of production employed by the firm. TABLE 13-1
Refer to Table 13-1. Diminishing marginal returns are present for which units of the factor of production?
A) 10th unit only
B) 11th unit only
C) 12th unit only
D) 13th unit only
E) all units shown in the table
TABLE 13-1Refer to Table 13-1. Diminishing marginal returns are present for which units of the factor of production?
A) 10th unit only
B) 11th unit only
C) 12th unit only
D) 13th unit only
E) all units shown in the table
Question
Question
Question
Question
Question
Consider the following production and cost schedule for a firm. The first column shows the number of units of a variable factor of production employed by the firm. TABLE 13-1
Refer to Table 13-1. How many units of this factor of production would the profit-maximizing firm choose to hire?
A) 11
B) 12
C) 13
D) 14
E) It is not possible to determine with the data provided.
TABLE 13-1Refer to Table 13-1. How many units of this factor of production would the profit-maximizing firm choose to hire?
A) 11
B) 12
C) 13
D) 14
E) It is not possible to determine with the data provided.
Question
Consider the following production and cost schedule for a firm. The first column shows the number of units of a variable factor of production employed by the firm. 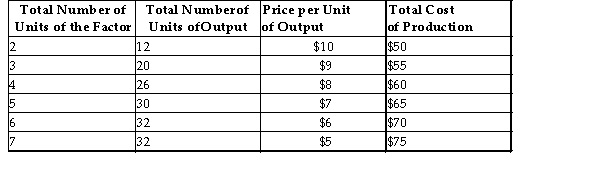 TABLE 13-3
Refer to Table 13-3. The marginal product of the 6th unit of the factor of production is
A) -2.
B) 2.
C) 4.
D) 8.
E) 32.
TABLE 13-3Refer to Table 13-3. The marginal product of the 6th unit of the factor of production is
A) -2.
B) 2.
C) 4.
D) 8.
E) 32.
Question
Consider the following table for a firm. The first column shows the number of units of a variable factor of production employed by the firm. 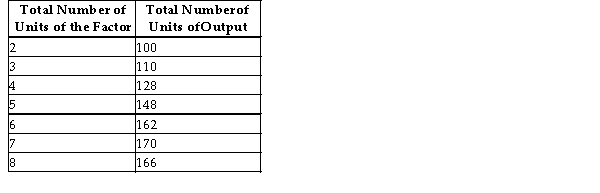 TABLE 13-2
Refer to Table 13-2. This firm begins to experience diminishing marginal productivity when it hires the
Unit of the factor.
A) 3rd
B) 4th
C) 5th
D) 6th
E) 7th
TABLE 13-2Refer to Table 13-2. This firm begins to experience diminishing marginal productivity when it hires the
Unit of the factor.
A) 3rd
B) 4th
C) 5th
D) 6th
E) 7th
Question
Consider the following production and cost schedule for a firm. The first column shows the number of units of a variable factor of production employed by the firm. TABLE 13-3
Refer to Table 13-3. The increase in total revenue generated by hiring the 5th unit of the factor of production is
A) -$11.00.
B) -$2.00.
C) $2.00.
D) $7.50.
E) $11.00.
TABLE 13-3Refer to Table 13-3. The increase in total revenue generated by hiring the 5th unit of the factor of production is
A) -$11.00.
B) -$2.00.
C) $2.00.
D) $7.50.
E) $11.00.
Question
Consider the following table for a firm. The first column shows the number of units of a variable factor of production employed by the firm. TABLE 13-2
Refer to Table 13-2. Suppose the firm is a perfect competitor and faces a given price of the product equal to $2 per unit. The marginal revenue product of the 5th unit of the factor is
A) $128.
B) $148.
C) $20.
D) $40.
E) $2.
TABLE 13-2Refer to Table 13-2. Suppose the firm is a perfect competitor and faces a given price of the product equal to $2 per unit. The marginal revenue product of the 5th unit of the factor is
A) $128.
B) $148.
C) $20.
D) $40.
E) $2.
Question
Consider the following production and cost schedule for a firm. The first column shows the number of units of a variable factor of production employed by the firm. TABLE 13-3
Refer to Table 13-3. The marginal product of the 4th unit of the factor of production is
A) 4.
B) 6.
C) 8.
D) 26.
E) 30.
TABLE 13-3Refer to Table 13-3. The marginal product of the 4th unit of the factor of production is
A) 4.
B) 6.
C) 8.
D) 26.
E) 30.
Question
The table below shows the total production for varying numbers of hours worked producing yo -yos. The firm sells its product and hires its workers in competitive markets. 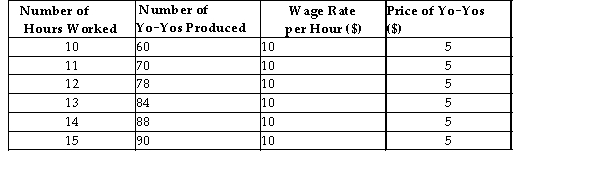 TABLE 13-4
Refer to Table 13-4. What is the marginal cost of the variable factor employed by this firm?
A) $0
B) $5
C) $10
D) $20
E) $30
TABLE 13-4Refer to Table 13-4. What is the marginal cost of the variable factor employed by this firm?
A) $0
B) $5
C) $10
D) $20
E) $30
Question
Question
Consider the following table for a firm. The first column shows the number of units of a variable factor of production employed by the firm. TABLE 13-2
Refer to Table 13-2. Suppose this firm is a perfect competitor and faces a given price of the product equal to $10 per unit. The marginal revenue product of the 3rd unit of the factor is
A) $30.
B) $100.
C) $110.
D) $1000.
E) $1100.
TABLE 13-2Refer to Table 13-2. Suppose this firm is a perfect competitor and faces a given price of the product equal to $10 per unit. The marginal revenue product of the 3rd unit of the factor is
A) $30.
B) $100.
C) $110.
D) $1000.
E) $1100.
Question
Question
Question
Consider the following production and cost schedule for a firm. The first column shows the number of units of a variable factor of production employed by the firm. TABLE 13-3
Refer to Table 13-3. A profit-maximizing firm would never hire more than the unit of this factor of production.
A) 3rd
B) 4th
C) 5th
D) 6th
E) 7th
TABLE 13-3Refer to Table 13-3. A profit-maximizing firm would never hire more than the unit of this factor of production.
A) 3rd
B) 4th
C) 5th
D) 6th
E) 7th
Question
The table below shows the total production for varying numbers of hours worked producing yo -yos. The firm sells its product and hires its workers in competitive markets. TABLE 13-4
Refer to Table 13-4. What is the MRP for the 13th hour worked?
A) $78
B) $84
C) $5
D) $30
E) $10
TABLE 13-4Refer to Table 13-4. What is the MRP for the 13th hour worked?
A) $78
B) $84
C) $5
D) $30
E) $10
Question
Consider the following table for a firm. The first column shows the number of units of a variable factor of production employed by the firm. TABLE 13-2
Refer to Table 13-2. Suppose this firm is a perfect competitor and faces a given price of the product equal to $15 per unit. The marginal revenue product of the 5th unit of the factor is
A) $30.
B) $100.
C) $75.
D) $300.
E) $2220.
TABLE 13-2Refer to Table 13-2. Suppose this firm is a perfect competitor and faces a given price of the product equal to $15 per unit. The marginal revenue product of the 5th unit of the factor is
A) $30.
B) $100.
C) $75.
D) $300.
E) $2220.
Question
Consider the following table for a firm. The first column shows the number of units of a variable factor of production employed by the firm. TABLE 13-2
Refer to Table 13-2. The marginal product of the 7th unit of the factor is
A) -8.
B) 0.
C) 8.
D) 162.
E) 170.
TABLE 13-2Refer to Table 13-2. The marginal product of the 7th unit of the factor is
A) -8.
B) 0.
C) 8.
D) 162.
E) 170.
Question
Consider the following production and cost schedule for a firm. The first column shows the number of units of a variable factor of production employed by the firm. TABLE 13-3
Refer to Table 13-3. The total revenue obtained if the 7th unit of the factor of production is hired is
A) $160.
B) $180.
C) $192.
D) $202.
E) $210.
TABLE 13-3Refer to Table 13-3. The total revenue obtained if the 7th unit of the factor of production is hired is
A) $160.
B) $180.
C) $192.
D) $202.
E) $210.
Question
Consider the following production and cost schedule for a firm. The first column shows the number of units of a variable factor of production employed by the firm. TABLE 13-3
Refer to Table 13-3. The total revenue obtained if the 5th unit of the factor of production is hired is
A) $160.
B) $180.
C) $192.
D) $202.
E) $210.
TABLE 13-3Refer to Table 13-3. The total revenue obtained if the 5th unit of the factor of production is hired is
A) $160.
B) $180.
C) $192.
D) $202.
E) $210.
Question
Question
Consider the following production and cost schedule for a firm. The first column shows the number of units of a variable factor of production employed by the firm. TABLE 13-3
Refer to Table 13-3. The rise in total revenue generated by hiring the 4th unit of the factor of production is
A) -$11.00.
B) $2.00.
C) $3.67.
D) $7.50.
E) $28.00.
TABLE 13-3Refer to Table 13-3. The rise in total revenue generated by hiring the 4th unit of the factor of production is
A) -$11.00.
B) $2.00.
C) $3.67.
D) $7.50.
E) $28.00.
Question
The diagram below shows the MRP curve for a firm producing copper plumbing pipe. The factor of production being considered here is hours of labour.
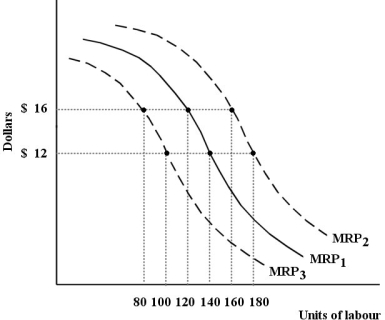 FIGURE 13-1
Refer to Figure 13-1. Assume that the firm is a perfect competitor and the price of the firmʹs output is fixed. We know that the firmʹs MRP curve is
A) the same shape as the firmʹs marginal product curve for labour.
B) the same shape as the firmʹs marginal revenue curve.
C) horizontal, if the firm is perfectly competitive.
D) steeper than the firmʹs marginal product curve for labour.
E) flatter than the firmʹs marginal product curve for labour.
FIGURE 13-1Refer to Figure 13-1. Assume that the firm is a perfect competitor and the price of the firmʹs output is fixed. We know that the firmʹs MRP curve is
A) the same shape as the firmʹs marginal product curve for labour.
B) the same shape as the firmʹs marginal revenue curve.
C) horizontal, if the firm is perfectly competitive.
D) steeper than the firmʹs marginal product curve for labour.
E) flatter than the firmʹs marginal product curve for labour.
Question
Question
The diagram below shows the MRP curve for a firm producing copper plumbing pipe. The factor of production being considered here is hours of labour.
FIGURE 13-1
Refer to Figure 13-1. This firmʹs MRP curve is the firmʹs
A) derived demand for copper plumbing pipe.
B) demand curve for labour.
C) market demand curve for copper plumbing pipe.
D) marginal product of labour curve.
E) total product curve for labour.
FIGURE 13-1Refer to Figure 13-1. This firmʹs MRP curve is the firmʹs
A) derived demand for copper plumbing pipe.
B) demand curve for labour.
C) market demand curve for copper plumbing pipe.
D) marginal product of labour curve.
E) total product curve for labour.
Question
Question
The table below shows the total production for varying numbers of hours worked producing yo -yos. The firm sells its product and hires its workers in competitive markets. TABLE 13-4
Refer to Table 13-4. Which of the following statements best describes the situation of this firm when it is employing 15 hours of labour? The 15th hour of labour hired
A) adds $5 to revenue, but costs $10 to hire, so this firm should hire less labour.
B) adds $20 to revenue, but only costs $10 to hire, so this firm should hire more labour.
C) adds $10 to revenue and costs $10 to hire, so this firm is maximizing its profit at 15 hours of labour.
D) adds $50 to revenue, but only costs $10 to hire, so this firm should hire more labour.
E) adds $2 to revenue, but costs $10 to hire, so this firm should hire less labour.
TABLE 13-4Refer to Table 13-4. Which of the following statements best describes the situation of this firm when it is employing 15 hours of labour? The 15th hour of labour hired
A) adds $5 to revenue, but costs $10 to hire, so this firm should hire less labour.
B) adds $20 to revenue, but only costs $10 to hire, so this firm should hire more labour.
C) adds $10 to revenue and costs $10 to hire, so this firm is maximizing its profit at 15 hours of labour.
D) adds $50 to revenue, but only costs $10 to hire, so this firm should hire more labour.
E) adds $2 to revenue, but costs $10 to hire, so this firm should hire less labour.
Question
The table below shows the total production for varying numbers of hours worked producing yo -yos. The firm sells its product and hires its workers in competitive markets. TABLE 13-4
Refer to Table 13-4. A profit-maximizing firm will continue to hire labour to produce yo-yos until they have equated
A) the price of yo-yos and the wage rate per hour.
B) the marginal product of an additional hour of labour and the price of the yo -yos.
C) the wage rate per hour and the value of the yo -yos produced by hiring one additional hour of labour.
D) the marginal revenue product of an additional hour of labour and the price of yo -yos.
E) the wage rate per hour and the marginal product of labour.
TABLE 13-4Refer to Table 13-4. A profit-maximizing firm will continue to hire labour to produce yo-yos until they have equated
A) the price of yo-yos and the wage rate per hour.
B) the marginal product of an additional hour of labour and the price of the yo -yos.
C) the wage rate per hour and the value of the yo -yos produced by hiring one additional hour of labour.
D) the marginal revenue product of an additional hour of labour and the price of yo -yos.
E) the wage rate per hour and the marginal product of labour.
Question
Question
Question
The table below shows the total production for varying numbers of hours worked producing yo -yos. The firm sells its product and hires its workers in competitive markets. TABLE 13-4
Refer to Table 13-4. If plotted on a graph, the marginal revenue product curve for the ʺnumber of hours workedʺ would be the same as
A) the firmʹs marginal product curve, and would be downward sloping and concave to the origin.
B) the firmʹs marginal product curve, and would be downward sloping and convex to the origin.
C) the firmʹs demand curve for hours worked, and would be downward sloping and linear.
D) the firmʹs demand curve for yo-yos, and would be downward sloping and linear.
E) the firmʹs marginal revenue curve, and would be horizontal at $5 because this firm is operating in a competitive labour market.
TABLE 13-4Refer to Table 13-4. If plotted on a graph, the marginal revenue product curve for the ʺnumber of hours workedʺ would be the same as
A) the firmʹs marginal product curve, and would be downward sloping and concave to the origin.
B) the firmʹs marginal product curve, and would be downward sloping and convex to the origin.
C) the firmʹs demand curve for hours worked, and would be downward sloping and linear.
D) the firmʹs demand curve for yo-yos, and would be downward sloping and linear.
E) the firmʹs marginal revenue curve, and would be horizontal at $5 because this firm is operating in a competitive labour market.
Question
The table below shows the total production for varying numbers of hours worked producing yo -yos. The firm sells its product and hires its workers in competitive markets. TABLE 13-4
Refer to Table 13-4. Which of the following statements best describes the situation of this firm when it is employing 12 hours of labour? The 12th hour of labour hired
A) adds $10 to revenue and costs $10 to hire, so this firm is maximizing its profit at 12 hours of labour.
B) adds $5 to revenue, but costs $10 to hire, so this firm should hire less labour.
C) adds $30 to revenue, but only costs $10 to hire, so this firm should hire more labour.
D) adds $8 to revenue, but costs $10 to hire, so this firm should hire less labour.
E) adds $40 to revenue, but only costs $10 to hire, so this firm should hire more labour.
TABLE 13-4Refer to Table 13-4. Which of the following statements best describes the situation of this firm when it is employing 12 hours of labour? The 12th hour of labour hired
A) adds $10 to revenue and costs $10 to hire, so this firm is maximizing its profit at 12 hours of labour.
B) adds $5 to revenue, but costs $10 to hire, so this firm should hire less labour.
C) adds $30 to revenue, but only costs $10 to hire, so this firm should hire more labour.
D) adds $8 to revenue, but costs $10 to hire, so this firm should hire less labour.
E) adds $40 to revenue, but only costs $10 to hire, so this firm should hire more labour.
Question
Question
The table below shows the total production for varying numbers of hours worked producing yo -yos. The firm sells its product and hires its workers in competitive markets. TABLE 13-4
Refer to Table 13-4. If the market price of yo-yos drops to $2.50, how many worker-hours should this profit-maximizing firm hire?
A) 11
B) 12
C) 13
D) 14
E) 15
TABLE 13-4Refer to Table 13-4. If the market price of yo-yos drops to $2.50, how many worker-hours should this profit-maximizing firm hire?
A) 11
B) 12
C) 13
D) 14
E) 15
Question
Question
The table below shows the total production for varying numbers of hours worked producing yo -yos. The firm sells its product and hires its workers in competitive markets. TABLE 13-4
Refer to Table 13-4. How many worker-hours should this profit-maximizing firm hire?
A) 11
B) 12
C) 13
D) 14
E) 15
TABLE 13-4Refer to Table 13-4. How many worker-hours should this profit-maximizing firm hire?
A) 11
B) 12
C) 13
D) 14
E) 15
Question
The diagram below shows the MRP curve for a firm producing copper plumbing pipe. The factor of production being considered here is hours of labour.
FIGURE 13-1
Refer to Figure 13-1. Suppose this firm initially has the marginal revenue product curve MRP1. One reason that the curve could shift to MRP3 is
A) an increase in demand for the firmʹs output, copper plumbing pipe.
B) a decrease in the market price of copper plumbing pipe.
C) a decrease in the supply of labour.
D) an increase in the wage rate.
E) an increase in the marginal product of labour.
FIGURE 13-1Refer to Figure 13-1. Suppose this firm initially has the marginal revenue product curve MRP1. One reason that the curve could shift to MRP3 is
A) an increase in demand for the firmʹs output, copper plumbing pipe.
B) a decrease in the market price of copper plumbing pipe.
C) a decrease in the supply of labour.
D) an increase in the wage rate.
E) an increase in the marginal product of labour.
Question
The diagram below shows the MRP curve for a firm producing copper plumbing pipe. The factor of production being considered here is hours of labour.
FIGURE 13-1
Refer to Figure 13-1. Suppose this firm has the marginal revenue product curve MRP1. At a wage rate of $12, the profit-maximizing firm will hire units of labour.
A) 100
B) 120
C) 140
D) 160
E) 180
FIGURE 13-1Refer to Figure 13-1. Suppose this firm has the marginal revenue product curve MRP1. At a wage rate of $12, the profit-maximizing firm will hire units of labour.
A) 100
B) 120
C) 140
D) 160
E) 180
Question
Question
Question
The diagram below shows the MRP curve for a firm producing copper plumbing pipe. The factor of production being considered here is hours of labour.
FIGURE 13-1
Refer to Figure 13-1. Suppose this firm initially has the marginal revenue product curve MRP1. One reason that the curve could shift to MRP2 is
A) a decrease in demand for the firmʹs output, copper plumbing pipe.
B) an increase in the supply of labour.
C) a decrease in the wage rate.
D) a decrease in the market price of copper plumbing pipe.
E) an improvement in workersʹ human capital.
FIGURE 13-1Refer to Figure 13-1. Suppose this firm initially has the marginal revenue product curve MRP1. One reason that the curve could shift to MRP2 is
A) a decrease in demand for the firmʹs output, copper plumbing pipe.
B) an increase in the supply of labour.
C) a decrease in the wage rate.
D) a decrease in the market price of copper plumbing pipe.
E) an improvement in workersʹ human capital.
Question
Question
Question
The demand and supply curves shown below apply to a competitive market for a factor used in the production of widgets.
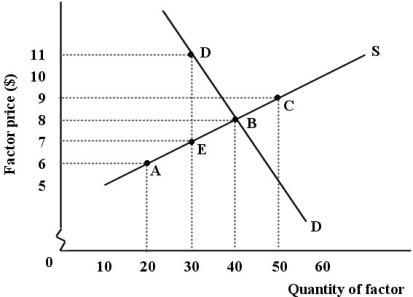 FIGURE 13-2
Refer to Figure 13-2. This factor market is in equilibrium at point B. What is the marginal revenue product of the 40th unit of the factor employed?
A) $8 multiplied by the price of the product
B) $320
C) $8
D) the marginal product of the 40th unit employed multiplied by the wage
E) $8 multiplied by the marginal revenue of the 40th unit employed
FIGURE 13-2Refer to Figure 13-2. This factor market is in equilibrium at point B. What is the marginal revenue product of the 40th unit of the factor employed?
A) $8 multiplied by the price of the product
B) $320
C) $8
D) the marginal product of the 40th unit employed multiplied by the wage
E) $8 multiplied by the marginal revenue of the 40th unit employed
Question
Question
The demand and supply curves shown below apply to a competitive market for a factor used in the production of widgets.
FIGURE 13-2
Consider a firmʹs demand for a factor of production. A perfectly competitive firm will continue to increase production until the marginal cost of the variable factor is
A) greater than the marginal revenue of the firmʹs output.
B) less than the marginal revenue of the firmʹs output.
C) equal to zero.
D) equal to the marginal revenue product of the factor.
E) equal to the marginal revenue of the firmʹs output.
FIGURE 13-2Consider a firmʹs demand for a factor of production. A perfectly competitive firm will continue to increase production until the marginal cost of the variable factor is
A) greater than the marginal revenue of the firmʹs output.
B) less than the marginal revenue of the firmʹs output.
C) equal to zero.
D) equal to the marginal revenue product of the factor.
E) equal to the marginal revenue of the firmʹs output.
Question
The diagram below shows the MRP curve for a firm producing copper plumbing pipe. The factor of production being considered here is hours of labour.
FIGURE 13-1
Refer to Figure 13-1. Suppose this firm is facing MRP1, a wage rate of $16 per hour and is employing 100 units of labour. At this level of employment,
A) the last unit of labour is adding less to the firmʹs cost than it is adding to the firmʹs revenue, so it should increase the use of labour.
B) the last unit of labour contributes as much to the firmʹs costs as to the firmʹs revenues and so the firm should not change its use of labour.
C) the last unit of labour is adding more to the firmʹs cost than it is adding to the firmʹs revenue, so it should reduce the use of labour.
D) the firm has shifted the MRP curve to MRP2.
E) the firm has shifted the MRP curve to MRP3.
FIGURE 13-1Refer to Figure 13-1. Suppose this firm is facing MRP1, a wage rate of $16 per hour and is employing 100 units of labour. At this level of employment,
A) the last unit of labour is adding less to the firmʹs cost than it is adding to the firmʹs revenue, so it should increase the use of labour.
B) the last unit of labour contributes as much to the firmʹs costs as to the firmʹs revenues and so the firm should not change its use of labour.
C) the last unit of labour is adding more to the firmʹs cost than it is adding to the firmʹs revenue, so it should reduce the use of labour.
D) the firm has shifted the MRP curve to MRP2.
E) the firm has shifted the MRP curve to MRP3.
Question
Question
Question
The diagram below shows the MRP curve for a firm producing copper plumbing pipe. The factor of production being considered here is hours of labour.
FIGURE 13-1
Refer to Figure 13-1. Suppose this firm is facing MRP1, a wage rate of $12 per hour and is employing 150 units of labour. At this level of employment,
A) the last unit of labour is adding less to the firmʹs cost than it is adding to the firmʹs revenue, so it should increase the use of labour.
B) the last unit of labour contributes as much to the firmʹs costs as to the firmʹs revenues and so the firm should not change its use of labour.
C) the last unit of labour is adding more to the firmʹs cost than it is adding to the firmʹs revenue, so it should reduce the use of labour.
D) the firm has shifted the MRP curve to MRP2.
E) the firm has shifted the MRP curve to MRP3.
FIGURE 13-1Refer to Figure 13-1. Suppose this firm is facing MRP1, a wage rate of $12 per hour and is employing 150 units of labour. At this level of employment,
A) the last unit of labour is adding less to the firmʹs cost than it is adding to the firmʹs revenue, so it should increase the use of labour.
B) the last unit of labour contributes as much to the firmʹs costs as to the firmʹs revenues and so the firm should not change its use of labour.
C) the last unit of labour is adding more to the firmʹs cost than it is adding to the firmʹs revenue, so it should reduce the use of labour.
D) the firm has shifted the MRP curve to MRP2.
E) the firm has shifted the MRP curve to MRP3.
Question
Question
The demand and supply curves shown below apply to a competitive market for a factor used in the production of widgets.
FIGURE 13-2
Other things being equal, if it becomes more difficult to substitute capital for labour in the production of cell phones, the demand curve for labour in that industry
A) will shift parallel to the left.
B) will shift parallel to the right.
C) will remain unchanged.
D) will become more elastic.
E) will become more inelastic.
FIGURE 13-2Other things being equal, if it becomes more difficult to substitute capital for labour in the production of cell phones, the demand curve for labour in that industry
A) will shift parallel to the left.
B) will shift parallel to the right.
C) will remain unchanged.
D) will become more elastic.
E) will become more inelastic.
Question
Question
Consider the following production and cost schedule for a firm. The first column shows the number of units of a variable factor of production employed by the firm. 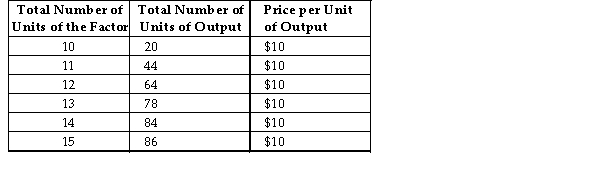 TABLE 13-1
Refer to Table 13-1. In order to determine this firmʹs profit-maximizing number of units of the variable factor of production, what necessary information is missing from the table?
A) the price per unit of the factor
B) the per unit price of the output
C) the marginal product of the factor
D) the marginal revenue product of the factor
E) the total output for the firm
TABLE 13-1Refer to Table 13-1. In order to determine this firmʹs profit-maximizing number of units of the variable factor of production, what necessary information is missing from the table?
A) the price per unit of the factor
B) the per unit price of the output
C) the marginal product of the factor
D) the marginal revenue product of the factor
E) the total output for the firm
Question
Question
Consider the following production and cost schedule for a firm. The first column shows the number of units of a variable factor of production employed by the firm. TABLE 13-1
Consider a perfectly competitive labour market for video-game designers. Which of the following will shift the demand curve for these workers to the right?
1) an increase in the equilibrium wage rate for video-game designers;
2) a decrease in the market price of video games;
3) new software that improves the design process.
A) 1 only
B) 2 only
C) 3 only
D) 1 and 2
E) 2 and 3
TABLE 13-1Consider a perfectly competitive labour market for video-game designers. Which of the following will shift the demand curve for these workers to the right?
1) an increase in the equilibrium wage rate for video-game designers;
2) a decrease in the market price of video games;
3) new software that improves the design process.
A) 1 only
B) 2 only
C) 3 only
D) 1 and 2
E) 2 and 3
Question
Consider the following production and cost schedule for a firm. The first column shows the number of units of a variable factor of production employed by the firm. TABLE 13-1
Refer to Table 13-1. How many units of this factor of production would the profit-maximizing firm hire if the price of each unit of the factor was $140?
A) 11
B) 12
C) 13
D) 14
E) It is not possible to determine with the data given.
TABLE 13-1Refer to Table 13-1. How many units of this factor of production would the profit-maximizing firm hire if the price of each unit of the factor was $140?
A) 11
B) 12
C) 13
D) 14
E) It is not possible to determine with the data given.
Question
The demand and supply curves shown below apply to a competitive market for a factor used in the production of widgets.
FIGURE 13-2
Refer to Figure 13-2. If the supply and demand curves for the factor are as shown in the diagram, but the wage being paid is $9, and the market is at point C,
A) the wage is higher than the factorʹs marginal revenue product, and firms will reduce the amount of the factor employed.
B) the wage is higher than the factorʹs marginal product, and firms will reduce the amount of the factor employed.
C) the marginal revenue product is not equal to the marginal cost of the factor and firms will increase the amount of the factor employed.
D) the demand curve will shift to the right until equilibrium factor price and quantity are re -established.
E) the demand curve will shift to the left until equilibrium factor price and quantity are re-established.
FIGURE 13-2Refer to Figure 13-2. If the supply and demand curves for the factor are as shown in the diagram, but the wage being paid is $9, and the market is at point C,
A) the wage is higher than the factorʹs marginal revenue product, and firms will reduce the amount of the factor employed.
B) the wage is higher than the factorʹs marginal product, and firms will reduce the amount of the factor employed.
C) the marginal revenue product is not equal to the marginal cost of the factor and firms will increase the amount of the factor employed.
D) the demand curve will shift to the right until equilibrium factor price and quantity are re -established.
E) the demand curve will shift to the left until equilibrium factor price and quantity are re-established.
Question
The demand and supply curves shown below apply to a competitive market for a factor used in the production of widgets.
FIGURE 13-2
Consider a firmʹs demand for a factor of production. A monopolist will continue to increase production until the marginal cost of the variable factor is
A) greater than the marginal revenue of the firmʹs output.
B) less than the marginal revenue of the firmʹs output.
C) equal to zero.
D) equal to the marginal revenue product of the factor.
E) equal to the marginal revenue of the firmʹs output.
FIGURE 13-2Consider a firmʹs demand for a factor of production. A monopolist will continue to increase production until the marginal cost of the variable factor is
A) greater than the marginal revenue of the firmʹs output.
B) less than the marginal revenue of the firmʹs output.
C) equal to zero.
D) equal to the marginal revenue product of the factor.
E) equal to the marginal revenue of the firmʹs output.
Question
Consider the following production and cost schedule for a firm. The first column shows the number of units of a variable factor of production employed by the firm. TABLE 13-1
Refer to Table 13-1. How many units of this factor of production would the profit-maximizing firm hire if the price of each unit of the factor was $30?
A) 12
B) 13
C) 14
D) 15
E) It is not possible to determine with the data given.
TABLE 13-1Refer to Table 13-1. How many units of this factor of production would the profit-maximizing firm hire if the price of each unit of the factor was $30?
A) 12
B) 13
C) 14
D) 15
E) It is not possible to determine with the data given.
Question
Consider the following production and cost schedule for a firm. The first column shows the number of units of a variable factor of production employed by the firm. TABLE 13-1
Refer to Table 13-1. How many units of this factor of production would the profit-maximizing firm hire if the price of each unit of the factor was $200?
A) 10
B) 11
C) 12
D) 13
E) It is not possible to determine with the data given.
TABLE 13-1Refer to Table 13-1. How many units of this factor of production would the profit-maximizing firm hire if the price of each unit of the factor was $200?
A) 10
B) 11
C) 12
D) 13
E) It is not possible to determine with the data given.
Question
The diagram below shows the MRP curve for a firm producing copper plumbing pipe. The factor of production being considered here is hours of labour.
FIGURE 13-1
Refer to Figure 13-1. Suppose this profit-maximizing firm is facing MRP1 and a wage rate of $12 per hour. Now suppose there is, simultaneously, an increase in demand for copper plumbing pipe such that MRP shifts to MRP2), and an increase in the wage rate to $16 per hour. The firm should
A) employ 20 more units of labour.
B) employ 40 more units of labour.
C) employ the same number of units of labour.
D) employ 40 fewer units of labour
E) employ 20 fewer units of labour.
FIGURE 13-1Refer to Figure 13-1. Suppose this profit-maximizing firm is facing MRP1 and a wage rate of $12 per hour. Now suppose there is, simultaneously, an increase in demand for copper plumbing pipe such that MRP shifts to MRP2), and an increase in the wage rate to $16 per hour. The firm should
A) employ 20 more units of labour.
B) employ 40 more units of labour.
C) employ the same number of units of labour.
D) employ 40 fewer units of labour
E) employ 20 fewer units of labour.

Unlock Deck
Sign up to unlock the cards in this deck!
Unlock Deck
Unlock Deck
1/124
Play
Full screen (f)
Deck 13: How Factor Markets Work
1
Consider labour hired for $18 per hour. If the last hour of labour hired produces 8 units of output which sells for $10 per unit, labour should be hired in this situation since the wage is MRP.
A) more; greater than
B) more; less than
C) less; greater than
D) less; less than
E) no; equal to
A) more; greater than
B) more; less than
C) less; greater than
D) less; less than
E) no; equal to
B
2
Consider labour that is hired for $18 per hour. If the last hour of labour hired produces 8 units of output which sells for $10 per unit, that labour-hour adds to the firmʹs profit and so labour should be hired.
A) $80; more
B) -$80; less
C) $62; less
D) $62; more
E) $0; no
A) $80; more
B) -$80; less
C) $62; less
D) $62; more
E) $0; no
D
3
Consider the following production and cost schedule for a firm. The first column shows the number of units of a variable factor of production employed by the firm. TABLE 13-1
Refer to Table 13-1. The marginal product of the 12th unit of the factor of production is
A) 4.
B) 14.
C) 20.
D) 44.
E) 64.
TABLE 13-1Refer to Table 13-1. The marginal product of the 12th unit of the factor of production is
A) 4.
B) 14.
C) 20.
D) 44.
E) 64.
C
4
Consider a small firm that is producing winter jackets. It can lease an additional sewing machine for one month for $2400. With this additional machine, the firm can produce an additional 4 jackets during that time period that it sells for $550 each. Hiring the marginal machine adds to the firmʹs profit and so it should the machine.
A) -$2400; not lease
B) -$200; not lease
C) $0; be indifferent as to whether to lease
D) $200; lease
E) $2400; lease
A) -$2400; not lease
B) -$200; not lease
C) $0; be indifferent as to whether to lease
D) $200; lease
E) $2400; lease
Unlock Deck
Unlock for access to all 124 flashcards in this deck.
Unlock Deck
k this deck
5
Suppose the last unit of a factor of production employed has a marginal product of 12. The factorʹs price is $8, and the productʹs competitive market price is $6. This factorʹs marginal revenue product is
A) $6.
B) $36.
C) $48.
D) $72.
E) $96.
A) $6.
B) $36.
C) $48.
D) $72.
E) $96.
Unlock Deck
Unlock for access to all 124 flashcards in this deck.
Unlock Deck
k this deck
6
Consider the following production and cost schedule for a firm. The first column shows the number of units of a variable factor of production employed by the firm. TABLE 13-1
Refer to Table 13-1. The total revenue of the output produced by 12 units of the factor is
A) $120.
B) $520.
C) $640.
D) $768.
E) $1440.
TABLE 13-1Refer to Table 13-1. The total revenue of the output produced by 12 units of the factor is
A) $120.
B) $520.
C) $640.
D) $768.
E) $1440.
Unlock Deck
Unlock for access to all 124 flashcards in this deck.
Unlock Deck
k this deck
7
A condition for the profit-maximizing use of any factor of production is
Where MP = marginal product, w = the price of a factor of production, p = price of one unit of the firmʹs output, MR = marginal revenue, MC = marginal cost, MRP = marginal revenue product):
A) MRP = MP × p
B) MR = MRP P
C) MC = MR × w
D) w = MP × p
E) MRP = MR × MC
Where MP = marginal product, w = the price of a factor of production, p = price of one unit of the firmʹs output, MR = marginal revenue, MC = marginal cost, MRP = marginal revenue product):
A) MRP = MP × p
B) MR = MRP P
C) MC = MR × w
D) w = MP × p
E) MRP = MR × MC
Unlock Deck
Unlock for access to all 124 flashcards in this deck.
Unlock Deck
k this deck
8
Consider labour that is hired for $18 per hour. If the last hour hired produces 8 units of output which sells for
$2 per unit, that labour-hour adds to the firmʹs profit and so labour should be hired.
A) -$128; more
B) -$2; less
C) $16; less
D) $16; more
E) $0; no
$2 per unit, that labour-hour adds to the firmʹs profit and so labour should be hired.
A) -$128; more
B) -$2; less
C) $16; less
D) $16; more
E) $0; no
Unlock Deck
Unlock for access to all 124 flashcards in this deck.
Unlock Deck
k this deck
9
Consider the following production and cost schedule for a firm. The first column shows the number of units of a variable factor of production employed by the firm. TABLE 13-1
Refer to Table 13-1. The marginal product of the 15th unit of the factor of production is
A) -2.
B) 0.
C) 2.
D) 82.
E) 84.
TABLE 13-1Refer to Table 13-1. The marginal product of the 15th unit of the factor of production is
A) -2.
B) 0.
C) 2.
D) 82.
E) 84.
Unlock Deck
Unlock for access to all 124 flashcards in this deck.
Unlock Deck
k this deck
10
Consider the following production and cost schedule for a firm. The first column shows the number of units of a variable factor of production employed by the firm. TABLE 13-1
Refer to Table 13-1. The total revenue of the output produced by 15 units of the factor is
A) $860.
B) $150.
C) $640.
D) $780.
E) $1440.
TABLE 13-1Refer to Table 13-1. The total revenue of the output produced by 15 units of the factor is
A) $860.
B) $150.
C) $640.
D) $780.
E) $1440.
Unlock Deck
Unlock for access to all 124 flashcards in this deck.
Unlock Deck
k this deck
11
Consider labour that is hired for $18 per hour. If the last hour hired produces 8 units of output which sells for
$2 per unit, labour should be hired in this situation since the wage is MRP.
A) more; greater than
B) more; less than
C) less; greater than
D) less; less than
E) no; equal to
$2 per unit, labour should be hired in this situation since the wage is MRP.
A) more; greater than
B) more; less than
C) less; greater than
D) less; less than
E) no; equal to
Unlock Deck
Unlock for access to all 124 flashcards in this deck.
Unlock Deck
k this deck
12
Consider a small firm that is producing winter jackets. It can lease an additional sewing machine for one month for $1200. With this additional machine, the firm can produce an additional 7 jackets during that time period that it sells for $250 each. Hiring the marginal machine adds to the firmʹs profit and so it should the machine.
A) -$1200; not lease
B) $0; be indifferent as to whether to lease
C) $1200; lease
D) $550; lease
E) $1750; lease
A) -$1200; not lease
B) $0; be indifferent as to whether to lease
C) $1200; lease
D) $550; lease
E) $1750; lease
Unlock Deck
Unlock for access to all 124 flashcards in this deck.
Unlock Deck
k this deck
13
For any firm in any market structure, a factorʹs marginal revenue product is
A) the average product of the factor multiplied by the price of the output.
B) the change in revenue caused by the sale of the product contributed by an additional unit of input.
C) the change in revenue caused by the sale of an additional unit of output.
D) the increase in output resulting from the use of an additional unit of the factor multiplied by the cost of that factor.
E) marginal revenue multiplied by total product.
Unlock Deck
Unlock for access to all 124 flashcards in this deck.
Unlock Deck
k this deck
14
Consider the following production and cost schedule for a firm. The first column shows the number of units of a variable factor of production employed by the firm. TABLE 13-1
Refer to Table 13-1. The marginal revenue product of the 15th unit of the factor is
A) -$20.
B) $20.
C) $60.
D) $150.
E) $820.
TABLE 13-1Refer to Table 13-1. The marginal revenue product of the 15th unit of the factor is
A) -$20.
B) $20.
C) $60.
D) $150.
E) $820.
Unlock Deck
Unlock for access to all 124 flashcards in this deck.
Unlock Deck
k this deck
15
Consider the following production and cost schedule for a firm. The first column shows the number of units of a variable factor of production employed by the firm. TABLE 13-1
Refer to Table 13-1. The marginal revenue product of the 14th unit of the factor is
A) -$60.
B) $60.
C) $140.
D) $700.
E) $840.
TABLE 13-1Refer to Table 13-1. The marginal revenue product of the 14th unit of the factor is
A) -$60.
B) $60.
C) $140.
D) $700.
E) $840.
Unlock Deck
Unlock for access to all 124 flashcards in this deck.
Unlock Deck
k this deck
16
Consider labour hired for $1000 per week. If the last week of labour hired produces 0.25 units of output which sells for $5000 per unit, labour should be hired in this situation since the wage is MRP.
A) more; greater than
B) more; less than
C) less; greater than
D) less; less than
E) no; equal to
A) more; greater than
B) more; less than
C) less; greater than
D) less; less than
E) no; equal to
Unlock Deck
Unlock for access to all 124 flashcards in this deck.
Unlock Deck
k this deck
17
Consider the following production and cost schedule for a firm. The first column shows the number of units of a variable factor of production employed by the firm. TABLE 13-1
Refer to Table 13-1. Diminishing marginal returns are present for which units of the factor of production?
A) 10th unit only
B) 11th unit only
C) 12th unit only
D) 13th unit only
E) all units shown in the table
TABLE 13-1Refer to Table 13-1. Diminishing marginal returns are present for which units of the factor of production?
A) 10th unit only
B) 11th unit only
C) 12th unit only
D) 13th unit only
E) all units shown in the table
Unlock Deck
Unlock for access to all 124 flashcards in this deck.
Unlock Deck
k this deck
18
Consider labour that is hired for $18 per hour. If the last hour of labour hired produces 8 units of output which sells for $10 per unit, that labour-hourʹs marginal revenue product is
A) $1.20.
B) $4.44.
C) $64.
D) $80.
E) $144.
A) $1.20.
B) $4.44.
C) $64.
D) $80.
E) $144.
Unlock Deck
Unlock for access to all 124 flashcards in this deck.
Unlock Deck
k this deck
19
Consider a small firm that is producing winter jackets. It can lease an additional sewing machine for one month for $750. With this additional machine, the firm can produce an additional 6 jackets during that time period that it sells for $125 each. Hiring the marginal machine adds to the firmʹs profit and so it should the machine.
A) -$750; not lease
B) -$750; lease
C) $0; be indifferent as to whether to lease
D) $750; not lease
E) $750; lease
A) -$750; not lease
B) -$750; lease
C) $0; be indifferent as to whether to lease
D) $750; not lease
E) $750; lease
Unlock Deck
Unlock for access to all 124 flashcards in this deck.
Unlock Deck
k this deck
20
The marginal revenue product of labour is the change in the value of the firmʹs output resulting from
A) a change in the productʹs price.
B) an increase in the marginal physical product of labour.
C) a change in the wage rate paid to labour.
D) producing one more unit of output.
E) hiring one more unit of labour input.
A) a change in the productʹs price.
B) an increase in the marginal physical product of labour.
C) a change in the wage rate paid to labour.
D) producing one more unit of output.
E) hiring one more unit of labour input.
Unlock Deck
Unlock for access to all 124 flashcards in this deck.
Unlock Deck
k this deck
21
Profit-maximizing firms increase production up to the point at which the last unit of the variable factor employed adds
A) nothing to marginal cost.
B) nothing to marginal revenue.
C) positive economic profits.
D) just as much to revenue as to profit.
E) just as much to revenue as to cost.
A) nothing to marginal cost.
B) nothing to marginal revenue.
C) positive economic profits.
D) just as much to revenue as to profit.
E) just as much to revenue as to cost.
Unlock Deck
Unlock for access to all 124 flashcards in this deck.
Unlock Deck
k this deck
22
Consider the following production and cost schedule for a firm. The first column shows the number of units of a variable factor of production employed by the firm. TABLE 13-1
Refer to Table 13-1. How many units of this factor of production would the profit-maximizing firm choose to hire?
A) 11
B) 12
C) 13
D) 14
E) It is not possible to determine with the data provided.
TABLE 13-1Refer to Table 13-1. How many units of this factor of production would the profit-maximizing firm choose to hire?
A) 11
B) 12
C) 13
D) 14
E) It is not possible to determine with the data provided.
Unlock Deck
Unlock for access to all 124 flashcards in this deck.
Unlock Deck
k this deck
23
Consider the following production and cost schedule for a firm. The first column shows the number of units of a variable factor of production employed by the firm. TABLE 13-3
Refer to Table 13-3. The marginal product of the 6th unit of the factor of production is
A) -2.
B) 2.
C) 4.
D) 8.
E) 32.
TABLE 13-3Refer to Table 13-3. The marginal product of the 6th unit of the factor of production is
A) -2.
B) 2.
C) 4.
D) 8.
E) 32.
Unlock Deck
Unlock for access to all 124 flashcards in this deck.
Unlock Deck
k this deck
24
Consider the following table for a firm. The first column shows the number of units of a variable factor of production employed by the firm. TABLE 13-2
Refer to Table 13-2. This firm begins to experience diminishing marginal productivity when it hires the
Unit of the factor.
A) 3rd
B) 4th
C) 5th
D) 6th
E) 7th
TABLE 13-2Refer to Table 13-2. This firm begins to experience diminishing marginal productivity when it hires the
Unit of the factor.
A) 3rd
B) 4th
C) 5th
D) 6th
E) 7th
Unlock Deck
Unlock for access to all 124 flashcards in this deck.
Unlock Deck
k this deck
25
Consider the following production and cost schedule for a firm. The first column shows the number of units of a variable factor of production employed by the firm. TABLE 13-3
Refer to Table 13-3. The increase in total revenue generated by hiring the 5th unit of the factor of production is
A) -$11.00.
B) -$2.00.
C) $2.00.
D) $7.50.
E) $11.00.
TABLE 13-3Refer to Table 13-3. The increase in total revenue generated by hiring the 5th unit of the factor of production is
A) -$11.00.
B) -$2.00.
C) $2.00.
D) $7.50.
E) $11.00.
Unlock Deck
Unlock for access to all 124 flashcards in this deck.
Unlock Deck
k this deck
26
Consider the following table for a firm. The first column shows the number of units of a variable factor of production employed by the firm. TABLE 13-2
Refer to Table 13-2. Suppose the firm is a perfect competitor and faces a given price of the product equal to $2 per unit. The marginal revenue product of the 5th unit of the factor is
A) $128.
B) $148.
C) $20.
D) $40.
E) $2.
TABLE 13-2Refer to Table 13-2. Suppose the firm is a perfect competitor and faces a given price of the product equal to $2 per unit. The marginal revenue product of the 5th unit of the factor is
A) $128.
B) $148.
C) $20.
D) $40.
E) $2.
Unlock Deck
Unlock for access to all 124 flashcards in this deck.
Unlock Deck
k this deck
27
Consider the following production and cost schedule for a firm. The first column shows the number of units of a variable factor of production employed by the firm. TABLE 13-3
Refer to Table 13-3. The marginal product of the 4th unit of the factor of production is
A) 4.
B) 6.
C) 8.
D) 26.
E) 30.
TABLE 13-3Refer to Table 13-3. The marginal product of the 4th unit of the factor of production is
A) 4.
B) 6.
C) 8.
D) 26.
E) 30.
Unlock Deck
Unlock for access to all 124 flashcards in this deck.
Unlock Deck
k this deck
28
The table below shows the total production for varying numbers of hours worked producing yo -yos. The firm sells its product and hires its workers in competitive markets. TABLE 13-4
Refer to Table 13-4. What is the marginal cost of the variable factor employed by this firm?
A) $0
B) $5
C) $10
D) $20
E) $30
TABLE 13-4Refer to Table 13-4. What is the marginal cost of the variable factor employed by this firm?
A) $0
B) $5
C) $10
D) $20
E) $30
Unlock Deck
Unlock for access to all 124 flashcards in this deck.
Unlock Deck
k this deck
29
The shape of the marginal revenue product curve for a perfectly competitive firm would be its marginal product curve because .
A) the same as; MR is constant as output increases
B) steeper than; MR decreases as output increases
C) steeper than; its productʹs price increases as output increases
D) flatter than; its productʹs price decreases as output increases
E) flatter than; it must pay a higher wage to the variable factor as output increases
Unlock Deck
Unlock for access to all 124 flashcards in this deck.
Unlock Deck
k this deck
30
Consider the following table for a firm. The first column shows the number of units of a variable factor of production employed by the firm. TABLE 13-2
Refer to Table 13-2. Suppose this firm is a perfect competitor and faces a given price of the product equal to $10 per unit. The marginal revenue product of the 3rd unit of the factor is
A) $30.
B) $100.
C) $110.
D) $1000.
E) $1100.
TABLE 13-2Refer to Table 13-2. Suppose this firm is a perfect competitor and faces a given price of the product equal to $10 per unit. The marginal revenue product of the 3rd unit of the factor is
A) $30.
B) $100.
C) $110.
D) $1000.
E) $1100.
Unlock Deck
Unlock for access to all 124 flashcards in this deck.
Unlock Deck
k this deck
31
The marginal revenue product curve for a monopolist would be its marginal product curve because
)
A) steeper than; its MR decreases as output increases
B) steeper than; its productʹs price increases as output increases
C) flatter than; it must pay a higher wage to labour
D) flatter than; its productʹs price decreases as output increases
E) the same as; the MRP curve always has the same shape as the MP curve
Unlock Deck
Unlock for access to all 124 flashcards in this deck.
Unlock Deck
k this deck
32
If a firm is a perfect competitor in its product market, the marginal product of a factor multiplied by the productʹs price equals
A) marginal cost.
B) marginal profit.
C) total revenue.
D) marginal revenue.
E) marginal revenue product.
A) marginal cost.
B) marginal profit.
C) total revenue.
D) marginal revenue.
E) marginal revenue product.
Unlock Deck
Unlock for access to all 124 flashcards in this deck.
Unlock Deck
k this deck
33
Consider the following production and cost schedule for a firm. The first column shows the number of units of a variable factor of production employed by the firm. TABLE 13-3
Refer to Table 13-3. A profit-maximizing firm would never hire more than the unit of this factor of production.
A) 3rd
B) 4th
C) 5th
D) 6th
E) 7th
TABLE 13-3Refer to Table 13-3. A profit-maximizing firm would never hire more than the unit of this factor of production.
A) 3rd
B) 4th
C) 5th
D) 6th
E) 7th
Unlock Deck
Unlock for access to all 124 flashcards in this deck.
Unlock Deck
k this deck
34
The table below shows the total production for varying numbers of hours worked producing yo -yos. The firm sells its product and hires its workers in competitive markets. TABLE 13-4
Refer to Table 13-4. What is the MRP for the 13th hour worked?
A) $78
B) $84
C) $5
D) $30
E) $10
TABLE 13-4Refer to Table 13-4. What is the MRP for the 13th hour worked?
A) $78
B) $84
C) $5
D) $30
E) $10
Unlock Deck
Unlock for access to all 124 flashcards in this deck.
Unlock Deck
k this deck
35
Consider the following table for a firm. The first column shows the number of units of a variable factor of production employed by the firm. TABLE 13-2
Refer to Table 13-2. Suppose this firm is a perfect competitor and faces a given price of the product equal to $15 per unit. The marginal revenue product of the 5th unit of the factor is
A) $30.
B) $100.
C) $75.
D) $300.
E) $2220.
TABLE 13-2Refer to Table 13-2. Suppose this firm is a perfect competitor and faces a given price of the product equal to $15 per unit. The marginal revenue product of the 5th unit of the factor is
A) $30.
B) $100.
C) $75.
D) $300.
E) $2220.
Unlock Deck
Unlock for access to all 124 flashcards in this deck.
Unlock Deck
k this deck
36
Consider the following table for a firm. The first column shows the number of units of a variable factor of production employed by the firm. TABLE 13-2
Refer to Table 13-2. The marginal product of the 7th unit of the factor is
A) -8.
B) 0.
C) 8.
D) 162.
E) 170.
TABLE 13-2Refer to Table 13-2. The marginal product of the 7th unit of the factor is
A) -8.
B) 0.
C) 8.
D) 162.
E) 170.
Unlock Deck
Unlock for access to all 124 flashcards in this deck.
Unlock Deck
k this deck
37
Consider the following production and cost schedule for a firm. The first column shows the number of units of a variable factor of production employed by the firm. TABLE 13-3
Refer to Table 13-3. The total revenue obtained if the 7th unit of the factor of production is hired is
A) $160.
B) $180.
C) $192.
D) $202.
E) $210.
TABLE 13-3Refer to Table 13-3. The total revenue obtained if the 7th unit of the factor of production is hired is
A) $160.
B) $180.
C) $192.
D) $202.
E) $210.
Unlock Deck
Unlock for access to all 124 flashcards in this deck.
Unlock Deck
k this deck
38
Consider the following production and cost schedule for a firm. The first column shows the number of units of a variable factor of production employed by the firm. TABLE 13-3
Refer to Table 13-3. The total revenue obtained if the 5th unit of the factor of production is hired is
A) $160.
B) $180.
C) $192.
D) $202.
E) $210.
TABLE 13-3Refer to Table 13-3. The total revenue obtained if the 5th unit of the factor of production is hired is
A) $160.
B) $180.
C) $192.
D) $202.
E) $210.
Unlock Deck
Unlock for access to all 124 flashcards in this deck.
Unlock Deck
k this deck
39
Which of the following is the best definition of the marginal revenue product MRP) of a factor of production?
A) the average product of the factor multiplied by the price of the output
B) the change in revenue generated by the sale of the product produced by an additional unit of input
C) the change in revenue caused by the sale of an additional unit of output
D) the increase in output resulting from the use of an additional unit of the factor multiplied by the cost of that factor
E) marginal revenue multiplied by total product
Unlock Deck
Unlock for access to all 124 flashcards in this deck.
Unlock Deck
k this deck
40
Consider the following production and cost schedule for a firm. The first column shows the number of units of a variable factor of production employed by the firm. TABLE 13-3
Refer to Table 13-3. The rise in total revenue generated by hiring the 4th unit of the factor of production is
A) -$11.00.
B) $2.00.
C) $3.67.
D) $7.50.
E) $28.00.
TABLE 13-3Refer to Table 13-3. The rise in total revenue generated by hiring the 4th unit of the factor of production is
A) -$11.00.
B) $2.00.
C) $3.67.
D) $7.50.
E) $28.00.
Unlock Deck
Unlock for access to all 124 flashcards in this deck.
Unlock Deck
k this deck
41
The diagram below shows the MRP curve for a firm producing copper plumbing pipe. The factor of production being considered here is hours of labour.
FIGURE 13-1
Refer to Figure 13-1. Assume that the firm is a perfect competitor and the price of the firmʹs output is fixed. We know that the firmʹs MRP curve is
A) the same shape as the firmʹs marginal product curve for labour.
B) the same shape as the firmʹs marginal revenue curve.
C) horizontal, if the firm is perfectly competitive.
D) steeper than the firmʹs marginal product curve for labour.
E) flatter than the firmʹs marginal product curve for labour.
FIGURE 13-1Refer to Figure 13-1. Assume that the firm is a perfect competitor and the price of the firmʹs output is fixed. We know that the firmʹs MRP curve is
A) the same shape as the firmʹs marginal product curve for labour.
B) the same shape as the firmʹs marginal revenue curve.
C) horizontal, if the firm is perfectly competitive.
D) steeper than the firmʹs marginal product curve for labour.
E) flatter than the firmʹs marginal product curve for labour.
Unlock Deck
Unlock for access to all 124 flashcards in this deck.
Unlock Deck
k this deck
42
A demand for a factor of production is said to be ʺderivedʺ because the factorʹs demand depends
A) entirely on the cost of the factor.
B) entirely on corporate advertising.
C) heavily on government policy.
D) heavily on public choice.
E) on the demand for the good or services it helps to make.
A) entirely on the cost of the factor.
B) entirely on corporate advertising.
C) heavily on government policy.
D) heavily on public choice.
E) on the demand for the good or services it helps to make.
Unlock Deck
Unlock for access to all 124 flashcards in this deck.
Unlock Deck
k this deck
43
The diagram below shows the MRP curve for a firm producing copper plumbing pipe. The factor of production being considered here is hours of labour.
FIGURE 13-1
Refer to Figure 13-1. This firmʹs MRP curve is the firmʹs
A) derived demand for copper plumbing pipe.
B) demand curve for labour.
C) market demand curve for copper plumbing pipe.
D) marginal product of labour curve.
E) total product curve for labour.
FIGURE 13-1Refer to Figure 13-1. This firmʹs MRP curve is the firmʹs
A) derived demand for copper plumbing pipe.
B) demand curve for labour.
C) market demand curve for copper plumbing pipe.
D) marginal product of labour curve.
E) total product curve for labour.
Unlock Deck
Unlock for access to all 124 flashcards in this deck.
Unlock Deck
k this deck
44
The demand for a factor will be more elastic if
A) there is little substitutability between factors.
B) it is easier to substitute between this factor and others.
C) that factor determines a small percentage of total cost.
D) the demand for the good being produced is inelastic.
E) the supply of the factor is elastic.
A) there is little substitutability between factors.
B) it is easier to substitute between this factor and others.
C) that factor determines a small percentage of total cost.
D) the demand for the good being produced is inelastic.
E) the supply of the factor is elastic.
Unlock Deck
Unlock for access to all 124 flashcards in this deck.
Unlock Deck
k this deck
45
The table below shows the total production for varying numbers of hours worked producing yo -yos. The firm sells its product and hires its workers in competitive markets. TABLE 13-4
Refer to Table 13-4. Which of the following statements best describes the situation of this firm when it is employing 15 hours of labour? The 15th hour of labour hired
A) adds $5 to revenue, but costs $10 to hire, so this firm should hire less labour.
B) adds $20 to revenue, but only costs $10 to hire, so this firm should hire more labour.
C) adds $10 to revenue and costs $10 to hire, so this firm is maximizing its profit at 15 hours of labour.
D) adds $50 to revenue, but only costs $10 to hire, so this firm should hire more labour.
E) adds $2 to revenue, but costs $10 to hire, so this firm should hire less labour.
TABLE 13-4Refer to Table 13-4. Which of the following statements best describes the situation of this firm when it is employing 15 hours of labour? The 15th hour of labour hired
A) adds $5 to revenue, but costs $10 to hire, so this firm should hire less labour.
B) adds $20 to revenue, but only costs $10 to hire, so this firm should hire more labour.
C) adds $10 to revenue and costs $10 to hire, so this firm is maximizing its profit at 15 hours of labour.
D) adds $50 to revenue, but only costs $10 to hire, so this firm should hire more labour.
E) adds $2 to revenue, but costs $10 to hire, so this firm should hire less labour.
Unlock Deck
Unlock for access to all 124 flashcards in this deck.
Unlock Deck
k this deck
46
The table below shows the total production for varying numbers of hours worked producing yo -yos. The firm sells its product and hires its workers in competitive markets. TABLE 13-4
Refer to Table 13-4. A profit-maximizing firm will continue to hire labour to produce yo-yos until they have equated
A) the price of yo-yos and the wage rate per hour.
B) the marginal product of an additional hour of labour and the price of the yo -yos.
C) the wage rate per hour and the value of the yo -yos produced by hiring one additional hour of labour.
D) the marginal revenue product of an additional hour of labour and the price of yo -yos.
E) the wage rate per hour and the marginal product of labour.
TABLE 13-4Refer to Table 13-4. A profit-maximizing firm will continue to hire labour to produce yo-yos until they have equated
A) the price of yo-yos and the wage rate per hour.
B) the marginal product of an additional hour of labour and the price of the yo -yos.
C) the wage rate per hour and the value of the yo -yos produced by hiring one additional hour of labour.
D) the marginal revenue product of an additional hour of labour and the price of yo -yos.
E) the wage rate per hour and the marginal product of labour.
Unlock Deck
Unlock for access to all 124 flashcards in this deck.
Unlock Deck
k this deck
47
Consider a firmʹs demand curve for labour. If a technological change makes it easier to substitute capital for labour, the demand curve for labour
A) shifts parallel to the right.
B) shifts parallel to the left.
C) becomes more inelastic.
D) becomes more elastic.
E) is not affected.
A) shifts parallel to the right.
B) shifts parallel to the left.
C) becomes more inelastic.
D) becomes more elastic.
E) is not affected.
Unlock Deck
Unlock for access to all 124 flashcards in this deck.
Unlock Deck
k this deck
48
Consider a firmʹs demand curve for labour. If a technological change makes it harder to substitute capital for labour, the demand curve for labour
A) shifts parallel to the right.
B) shifts parallel to the left.
C) becomes less elastic.
D) becomes more elastic.
E) is not affected.
A) shifts parallel to the right.
B) shifts parallel to the left.
C) becomes less elastic.
D) becomes more elastic.
E) is not affected.
Unlock Deck
Unlock for access to all 124 flashcards in this deck.
Unlock Deck
k this deck
49
The table below shows the total production for varying numbers of hours worked producing yo -yos. The firm sells its product and hires its workers in competitive markets. TABLE 13-4
Refer to Table 13-4. If plotted on a graph, the marginal revenue product curve for the ʺnumber of hours workedʺ would be the same as
A) the firmʹs marginal product curve, and would be downward sloping and concave to the origin.
B) the firmʹs marginal product curve, and would be downward sloping and convex to the origin.
C) the firmʹs demand curve for hours worked, and would be downward sloping and linear.
D) the firmʹs demand curve for yo-yos, and would be downward sloping and linear.
E) the firmʹs marginal revenue curve, and would be horizontal at $5 because this firm is operating in a competitive labour market.
TABLE 13-4Refer to Table 13-4. If plotted on a graph, the marginal revenue product curve for the ʺnumber of hours workedʺ would be the same as
A) the firmʹs marginal product curve, and would be downward sloping and concave to the origin.
B) the firmʹs marginal product curve, and would be downward sloping and convex to the origin.
C) the firmʹs demand curve for hours worked, and would be downward sloping and linear.
D) the firmʹs demand curve for yo-yos, and would be downward sloping and linear.
E) the firmʹs marginal revenue curve, and would be horizontal at $5 because this firm is operating in a competitive labour market.
Unlock Deck
Unlock for access to all 124 flashcards in this deck.
Unlock Deck
k this deck
50
The table below shows the total production for varying numbers of hours worked producing yo -yos. The firm sells its product and hires its workers in competitive markets. TABLE 13-4
Refer to Table 13-4. Which of the following statements best describes the situation of this firm when it is employing 12 hours of labour? The 12th hour of labour hired
A) adds $10 to revenue and costs $10 to hire, so this firm is maximizing its profit at 12 hours of labour.
B) adds $5 to revenue, but costs $10 to hire, so this firm should hire less labour.
C) adds $30 to revenue, but only costs $10 to hire, so this firm should hire more labour.
D) adds $8 to revenue, but costs $10 to hire, so this firm should hire less labour.
E) adds $40 to revenue, but only costs $10 to hire, so this firm should hire more labour.
TABLE 13-4Refer to Table 13-4. Which of the following statements best describes the situation of this firm when it is employing 12 hours of labour? The 12th hour of labour hired
A) adds $10 to revenue and costs $10 to hire, so this firm is maximizing its profit at 12 hours of labour.
B) adds $5 to revenue, but costs $10 to hire, so this firm should hire less labour.
C) adds $30 to revenue, but only costs $10 to hire, so this firm should hire more labour.
D) adds $8 to revenue, but costs $10 to hire, so this firm should hire less labour.
E) adds $40 to revenue, but only costs $10 to hire, so this firm should hire more labour.
Unlock Deck
Unlock for access to all 124 flashcards in this deck.
Unlock Deck
k this deck
51
Which of the following is the best example of a derived demand?
A) an increase in the wage for yoga instructors causes an increase in the demand for yoga classes
B) a decrease in the price of Pilates classes causes an increase in the demand for yoga classes
C) an increase in demand for yoga classes causes an increase in demand for yoga instructors
D) a decrease in the demand for yoga mats causes a decrease in demand for yoga classes
E) an increase in awareness about fitness causes an increase in demand for yoga classes
Unlock Deck
Unlock for access to all 124 flashcards in this deck.
Unlock Deck
k this deck
52
The table below shows the total production for varying numbers of hours worked producing yo -yos. The firm sells its product and hires its workers in competitive markets. TABLE 13-4
Refer to Table 13-4. If the market price of yo-yos drops to $2.50, how many worker-hours should this profit-maximizing firm hire?
A) 11
B) 12
C) 13
D) 14
E) 15
TABLE 13-4Refer to Table 13-4. If the market price of yo-yos drops to $2.50, how many worker-hours should this profit-maximizing firm hire?
A) 11
B) 12
C) 13
D) 14
E) 15
Unlock Deck
Unlock for access to all 124 flashcards in this deck.
Unlock Deck
k this deck
53
In a perfectly competitive labour market, a profit-maximizing firm will employ labour until the
A) MPP = MRP.
B) wage = MP.
C) MRP = the productʹs price.
D) wage = MRP.
E) wage = the productʹs price.
A) MPP = MRP.
B) wage = MP.
C) MRP = the productʹs price.
D) wage = MRP.
E) wage = the productʹs price.
Unlock Deck
Unlock for access to all 124 flashcards in this deck.
Unlock Deck
k this deck
54
The table below shows the total production for varying numbers of hours worked producing yo -yos. The firm sells its product and hires its workers in competitive markets. TABLE 13-4
Refer to Table 13-4. How many worker-hours should this profit-maximizing firm hire?
A) 11
B) 12
C) 13
D) 14
E) 15
TABLE 13-4Refer to Table 13-4. How many worker-hours should this profit-maximizing firm hire?
A) 11
B) 12
C) 13
D) 14
E) 15
Unlock Deck
Unlock for access to all 124 flashcards in this deck.
Unlock Deck
k this deck
55
The diagram below shows the MRP curve for a firm producing copper plumbing pipe. The factor of production being considered here is hours of labour.
FIGURE 13-1
Refer to Figure 13-1. Suppose this firm initially has the marginal revenue product curve MRP1. One reason that the curve could shift to MRP3 is
A) an increase in demand for the firmʹs output, copper plumbing pipe.
B) a decrease in the market price of copper plumbing pipe.
C) a decrease in the supply of labour.
D) an increase in the wage rate.
E) an increase in the marginal product of labour.
FIGURE 13-1Refer to Figure 13-1. Suppose this firm initially has the marginal revenue product curve MRP1. One reason that the curve could shift to MRP3 is
A) an increase in demand for the firmʹs output, copper plumbing pipe.
B) a decrease in the market price of copper plumbing pipe.
C) a decrease in the supply of labour.
D) an increase in the wage rate.
E) an increase in the marginal product of labour.
Unlock Deck
Unlock for access to all 124 flashcards in this deck.
Unlock Deck
k this deck
56
The diagram below shows the MRP curve for a firm producing copper plumbing pipe. The factor of production being considered here is hours of labour.
FIGURE 13-1
Refer to Figure 13-1. Suppose this firm has the marginal revenue product curve MRP1. At a wage rate of $12, the profit-maximizing firm will hire units of labour.
A) 100
B) 120
C) 140
D) 160
E) 180
FIGURE 13-1Refer to Figure 13-1. Suppose this firm has the marginal revenue product curve MRP1. At a wage rate of $12, the profit-maximizing firm will hire units of labour.
A) 100
B) 120
C) 140
D) 160
E) 180
Unlock Deck
Unlock for access to all 124 flashcards in this deck.
Unlock Deck
k this deck
57
Which of the following is the best example of a derived demand?
A) A decrease in interest rates increases the demand for housing.
B) An increase in the wage rate causes firms to substitute capital for labour.
C) An increase in demand for cars will increase the demand for auto workers.
D) A decrease in the price of internet connection will increase the demand for tablet computers.
E) An increase in the price of butter increases the demand for margarine.
Unlock Deck
Unlock for access to all 124 flashcards in this deck.
Unlock Deck
k this deck
58
In a competitive labour market, an increase in the demand for labour might be due to an increase in the
A) supply of labour.
B) wage rate.
C) supply of the product that labour produces.
D) demand for the product that labour produces.
E) supply of the other factors.
A) supply of labour.
B) wage rate.
C) supply of the product that labour produces.
D) demand for the product that labour produces.
E) supply of the other factors.
Unlock Deck
Unlock for access to all 124 flashcards in this deck.
Unlock Deck
k this deck
59
The diagram below shows the MRP curve for a firm producing copper plumbing pipe. The factor of production being considered here is hours of labour.
FIGURE 13-1
Refer to Figure 13-1. Suppose this firm initially has the marginal revenue product curve MRP1. One reason that the curve could shift to MRP2 is
A) a decrease in demand for the firmʹs output, copper plumbing pipe.
B) an increase in the supply of labour.
C) a decrease in the wage rate.
D) a decrease in the market price of copper plumbing pipe.
E) an improvement in workersʹ human capital.
FIGURE 13-1Refer to Figure 13-1. Suppose this firm initially has the marginal revenue product curve MRP1. One reason that the curve could shift to MRP2 is
A) a decrease in demand for the firmʹs output, copper plumbing pipe.
B) an increase in the supply of labour.
C) a decrease in the wage rate.
D) a decrease in the market price of copper plumbing pipe.
E) an improvement in workersʹ human capital.
Unlock Deck
Unlock for access to all 124 flashcards in this deck.
Unlock Deck
k this deck
60
The demand curve for a variable factor is always
A) that factorʹs marginal cost curve.
B) that factorʹs MRP curve.
C) that factorʹs MP curve.
D) steeper than that factorʹs MRP curve.
E) flatter than that factorʹs MRP curve.
A) that factorʹs marginal cost curve.
B) that factorʹs MRP curve.
C) that factorʹs MP curve.
D) steeper than that factorʹs MRP curve.
E) flatter than that factorʹs MRP curve.
Unlock Deck
Unlock for access to all 124 flashcards in this deck.
Unlock Deck
k this deck
61
The elasticity of supply of computer-game programmers will generally be greater if we are analyzing the amount supplied to
A) the whole economy in the short run.
B) the whole economy in the long run.
C) a particular industry in the short run.
D) a particular industry in the long run.
E) a specific firm.
A) the whole economy in the short run.
B) the whole economy in the long run.
C) a particular industry in the short run.
D) a particular industry in the long run.
E) a specific firm.
Unlock Deck
Unlock for access to all 124 flashcards in this deck.
Unlock Deck
k this deck
62
The demand and supply curves shown below apply to a competitive market for a factor used in the production of widgets.
FIGURE 13-2
Refer to Figure 13-2. This factor market is in equilibrium at point B. What is the marginal revenue product of the 40th unit of the factor employed?
A) $8 multiplied by the price of the product
B) $320
C) $8
D) the marginal product of the 40th unit employed multiplied by the wage
E) $8 multiplied by the marginal revenue of the 40th unit employed
FIGURE 13-2Refer to Figure 13-2. This factor market is in equilibrium at point B. What is the marginal revenue product of the 40th unit of the factor employed?
A) $8 multiplied by the price of the product
B) $320
C) $8
D) the marginal product of the 40th unit employed multiplied by the wage
E) $8 multiplied by the marginal revenue of the 40th unit employed
Unlock Deck
Unlock for access to all 124 flashcards in this deck.
Unlock Deck
k this deck
63
Which of the following statements concerning factor mobility is FALSE?
A) Land is a mobile resource in an economic sense, because it has many alternative uses.
B) Once it is in place, a factory designed and built for a specific purpose is highly mobile.
C) The allocation of labour tends to depend more on non -monetary considerations than does the allocation of either land or capital.
D) The elasticity of the supply of labour to any particular use is likely to be greater in the long run than in the short run.
E) Factor mobility is an important determinant of economic rent.
Unlock Deck
Unlock for access to all 124 flashcards in this deck.
Unlock Deck
k this deck
64
The demand and supply curves shown below apply to a competitive market for a factor used in the production of widgets.
FIGURE 13-2
Consider a firmʹs demand for a factor of production. A perfectly competitive firm will continue to increase production until the marginal cost of the variable factor is
A) greater than the marginal revenue of the firmʹs output.
B) less than the marginal revenue of the firmʹs output.
C) equal to zero.
D) equal to the marginal revenue product of the factor.
E) equal to the marginal revenue of the firmʹs output.
FIGURE 13-2Consider a firmʹs demand for a factor of production. A perfectly competitive firm will continue to increase production until the marginal cost of the variable factor is
A) greater than the marginal revenue of the firmʹs output.
B) less than the marginal revenue of the firmʹs output.
C) equal to zero.
D) equal to the marginal revenue product of the factor.
E) equal to the marginal revenue of the firmʹs output.
Unlock Deck
Unlock for access to all 124 flashcards in this deck.
Unlock Deck
k this deck
65
The diagram below shows the MRP curve for a firm producing copper plumbing pipe. The factor of production being considered here is hours of labour.
FIGURE 13-1
Refer to Figure 13-1. Suppose this firm is facing MRP1, a wage rate of $16 per hour and is employing 100 units of labour. At this level of employment,
A) the last unit of labour is adding less to the firmʹs cost than it is adding to the firmʹs revenue, so it should increase the use of labour.
B) the last unit of labour contributes as much to the firmʹs costs as to the firmʹs revenues and so the firm should not change its use of labour.
C) the last unit of labour is adding more to the firmʹs cost than it is adding to the firmʹs revenue, so it should reduce the use of labour.
D) the firm has shifted the MRP curve to MRP2.
E) the firm has shifted the MRP curve to MRP3.
FIGURE 13-1Refer to Figure 13-1. Suppose this firm is facing MRP1, a wage rate of $16 per hour and is employing 100 units of labour. At this level of employment,
A) the last unit of labour is adding less to the firmʹs cost than it is adding to the firmʹs revenue, so it should increase the use of labour.
B) the last unit of labour contributes as much to the firmʹs costs as to the firmʹs revenues and so the firm should not change its use of labour.
C) the last unit of labour is adding more to the firmʹs cost than it is adding to the firmʹs revenue, so it should reduce the use of labour.
D) the firm has shifted the MRP curve to MRP2.
E) the firm has shifted the MRP curve to MRP3.
Unlock Deck
Unlock for access to all 124 flashcards in this deck.
Unlock Deck
k this deck
66
Consider computer programmers as a factor of production. Their factor mobility is quite , and so to any specific firm the supply of this factor is quite .
A) low; inelastic
B) low; elastic
C) high; inelastic
D) high; elastic
A) low; inelastic
B) low; elastic
C) high; inelastic
D) high; elastic
Unlock Deck
Unlock for access to all 124 flashcards in this deck.
Unlock Deck
k this deck
67
If a given factor of production is highly mobile across alternative uses, the factorʹs supply is
A) highly price elastic.
B) highly price inelastic.
C) perfectly inelastic.
D) irrelevant to its earnings.
E) immobile at the industry level.
A) highly price elastic.
B) highly price inelastic.
C) perfectly inelastic.
D) irrelevant to its earnings.
E) immobile at the industry level.
Unlock Deck
Unlock for access to all 124 flashcards in this deck.
Unlock Deck
k this deck
68
The diagram below shows the MRP curve for a firm producing copper plumbing pipe. The factor of production being considered here is hours of labour.
FIGURE 13-1
Refer to Figure 13-1. Suppose this firm is facing MRP1, a wage rate of $12 per hour and is employing 150 units of labour. At this level of employment,
A) the last unit of labour is adding less to the firmʹs cost than it is adding to the firmʹs revenue, so it should increase the use of labour.
B) the last unit of labour contributes as much to the firmʹs costs as to the firmʹs revenues and so the firm should not change its use of labour.
C) the last unit of labour is adding more to the firmʹs cost than it is adding to the firmʹs revenue, so it should reduce the use of labour.
D) the firm has shifted the MRP curve to MRP2.
E) the firm has shifted the MRP curve to MRP3.
FIGURE 13-1Refer to Figure 13-1. Suppose this firm is facing MRP1, a wage rate of $12 per hour and is employing 150 units of labour. At this level of employment,
A) the last unit of labour is adding less to the firmʹs cost than it is adding to the firmʹs revenue, so it should increase the use of labour.
B) the last unit of labour contributes as much to the firmʹs costs as to the firmʹs revenues and so the firm should not change its use of labour.
C) the last unit of labour is adding more to the firmʹs cost than it is adding to the firmʹs revenue, so it should reduce the use of labour.
D) the firm has shifted the MRP curve to MRP2.
E) the firm has shifted the MRP curve to MRP3.
Unlock Deck
Unlock for access to all 124 flashcards in this deck.
Unlock Deck
k this deck
69
The aggregate quantity of labour supplied will generally rise when there is an increase in
1) immigration;
2) labour-force participation rates;
3) the retirement age.
A) 1 and 2
B) 1 and 3
C) 2 and 3
D) 1, 2, and 3
E) 1 only
1) immigration;
2) labour-force participation rates;
3) the retirement age.
A) 1 and 2
B) 1 and 3
C) 2 and 3
D) 1, 2, and 3
E) 1 only
Unlock Deck
Unlock for access to all 124 flashcards in this deck.
Unlock Deck
k this deck
70
The demand and supply curves shown below apply to a competitive market for a factor used in the production of widgets.
FIGURE 13-2
Other things being equal, if it becomes more difficult to substitute capital for labour in the production of cell phones, the demand curve for labour in that industry
A) will shift parallel to the left.
B) will shift parallel to the right.
C) will remain unchanged.
D) will become more elastic.
E) will become more inelastic.
FIGURE 13-2Other things being equal, if it becomes more difficult to substitute capital for labour in the production of cell phones, the demand curve for labour in that industry
A) will shift parallel to the left.
B) will shift parallel to the right.
C) will remain unchanged.
D) will become more elastic.
E) will become more inelastic.
Unlock Deck
Unlock for access to all 124 flashcards in this deck.
Unlock Deck
k this deck
71
If small changes in incentives can induce a factor to shift between alternative uses, we say that the factor is
A) efficient.
B) mobile.
C) inelastic.
D) declining.
E) flighty.
A) efficient.
B) mobile.
C) inelastic.
D) declining.
E) flighty.
Unlock Deck
Unlock for access to all 124 flashcards in this deck.
Unlock Deck
k this deck
72
Consider the following production and cost schedule for a firm. The first column shows the number of units of a variable factor of production employed by the firm. TABLE 13-1
Refer to Table 13-1. In order to determine this firmʹs profit-maximizing number of units of the variable factor of production, what necessary information is missing from the table?
A) the price per unit of the factor
B) the per unit price of the output
C) the marginal product of the factor
D) the marginal revenue product of the factor
E) the total output for the firm
TABLE 13-1Refer to Table 13-1. In order to determine this firmʹs profit-maximizing number of units of the variable factor of production, what necessary information is missing from the table?
A) the price per unit of the factor
B) the per unit price of the output
C) the marginal product of the factor
D) the marginal revenue product of the factor
E) the total output for the firm
Unlock Deck
Unlock for access to all 124 flashcards in this deck.
Unlock Deck
k this deck
73
Assume that the market for farmland in the fruit-growing region of southwestern Ontario is perfectly competitive. Which of the following will shift the demand curve for this land to the left?
1) a decrease in demand for Canadian-grown fruit;
2) a change in consumer preferences toward eating more fruit;
3) scientific reports that confirm a reduction in water supply to the region.
A) 1 and 2
B) 2 and 3
C) 1 and 3
D) 1 only
E) 3 only
1) a decrease in demand for Canadian-grown fruit;
2) a change in consumer preferences toward eating more fruit;
3) scientific reports that confirm a reduction in water supply to the region.
A) 1 and 2
B) 2 and 3
C) 1 and 3
D) 1 only
E) 3 only
Unlock Deck
Unlock for access to all 124 flashcards in this deck.
Unlock Deck
k this deck
74
Consider the following production and cost schedule for a firm. The first column shows the number of units of a variable factor of production employed by the firm. TABLE 13-1
Consider a perfectly competitive labour market for video-game designers. Which of the following will shift the demand curve for these workers to the right?
1) an increase in the equilibrium wage rate for video-game designers;
2) a decrease in the market price of video games;
3) new software that improves the design process.
A) 1 only
B) 2 only
C) 3 only
D) 1 and 2
E) 2 and 3
TABLE 13-1Consider a perfectly competitive labour market for video-game designers. Which of the following will shift the demand curve for these workers to the right?
1) an increase in the equilibrium wage rate for video-game designers;
2) a decrease in the market price of video games;
3) new software that improves the design process.
A) 1 only
B) 2 only
C) 3 only
D) 1 and 2
E) 2 and 3
Unlock Deck
Unlock for access to all 124 flashcards in this deck.
Unlock Deck
k this deck
75
Consider the following production and cost schedule for a firm. The first column shows the number of units of a variable factor of production employed by the firm. TABLE 13-1
Refer to Table 13-1. How many units of this factor of production would the profit-maximizing firm hire if the price of each unit of the factor was $140?
A) 11
B) 12
C) 13
D) 14
E) It is not possible to determine with the data given.
TABLE 13-1Refer to Table 13-1. How many units of this factor of production would the profit-maximizing firm hire if the price of each unit of the factor was $140?
A) 11
B) 12
C) 13
D) 14
E) It is not possible to determine with the data given.
Unlock Deck
Unlock for access to all 124 flashcards in this deck.
Unlock Deck
k this deck
76
The demand and supply curves shown below apply to a competitive market for a factor used in the production of widgets.
FIGURE 13-2
Refer to Figure 13-2. If the supply and demand curves for the factor are as shown in the diagram, but the wage being paid is $9, and the market is at point C,
A) the wage is higher than the factorʹs marginal revenue product, and firms will reduce the amount of the factor employed.
B) the wage is higher than the factorʹs marginal product, and firms will reduce the amount of the factor employed.
C) the marginal revenue product is not equal to the marginal cost of the factor and firms will increase the amount of the factor employed.
D) the demand curve will shift to the right until equilibrium factor price and quantity are re -established.
E) the demand curve will shift to the left until equilibrium factor price and quantity are re-established.
FIGURE 13-2Refer to Figure 13-2. If the supply and demand curves for the factor are as shown in the diagram, but the wage being paid is $9, and the market is at point C,
A) the wage is higher than the factorʹs marginal revenue product, and firms will reduce the amount of the factor employed.
B) the wage is higher than the factorʹs marginal product, and firms will reduce the amount of the factor employed.
C) the marginal revenue product is not equal to the marginal cost of the factor and firms will increase the amount of the factor employed.
D) the demand curve will shift to the right until equilibrium factor price and quantity are re -established.
E) the demand curve will shift to the left until equilibrium factor price and quantity are re-established.
Unlock Deck
Unlock for access to all 124 flashcards in this deck.
Unlock Deck
k this deck
77
The demand and supply curves shown below apply to a competitive market for a factor used in the production of widgets.
FIGURE 13-2
Consider a firmʹs demand for a factor of production. A monopolist will continue to increase production until the marginal cost of the variable factor is
A) greater than the marginal revenue of the firmʹs output.
B) less than the marginal revenue of the firmʹs output.
C) equal to zero.
D) equal to the marginal revenue product of the factor.
E) equal to the marginal revenue of the firmʹs output.
FIGURE 13-2Consider a firmʹs demand for a factor of production. A monopolist will continue to increase production until the marginal cost of the variable factor is
A) greater than the marginal revenue of the firmʹs output.
B) less than the marginal revenue of the firmʹs output.
C) equal to zero.
D) equal to the marginal revenue product of the factor.
E) equal to the marginal revenue of the firmʹs output.
Unlock Deck
Unlock for access to all 124 flashcards in this deck.
Unlock Deck
k this deck
78
Consider the following production and cost schedule for a firm. The first column shows the number of units of a variable factor of production employed by the firm. TABLE 13-1
Refer to Table 13-1. How many units of this factor of production would the profit-maximizing firm hire if the price of each unit of the factor was $30?
A) 12
B) 13
C) 14
D) 15
E) It is not possible to determine with the data given.
TABLE 13-1Refer to Table 13-1. How many units of this factor of production would the profit-maximizing firm hire if the price of each unit of the factor was $30?
A) 12
B) 13
C) 14
D) 15
E) It is not possible to determine with the data given.
Unlock Deck
Unlock for access to all 124 flashcards in this deck.
Unlock Deck
k this deck
79
Consider the following production and cost schedule for a firm. The first column shows the number of units of a variable factor of production employed by the firm. TABLE 13-1
Refer to Table 13-1. How many units of this factor of production would the profit-maximizing firm hire if the price of each unit of the factor was $200?
A) 10
B) 11
C) 12
D) 13
E) It is not possible to determine with the data given.
TABLE 13-1Refer to Table 13-1. How many units of this factor of production would the profit-maximizing firm hire if the price of each unit of the factor was $200?
A) 10
B) 11
C) 12
D) 13
E) It is not possible to determine with the data given.
Unlock Deck
Unlock for access to all 124 flashcards in this deck.
Unlock Deck
k this deck
80
The diagram below shows the MRP curve for a firm producing copper plumbing pipe. The factor of production being considered here is hours of labour.
FIGURE 13-1
Refer to Figure 13-1. Suppose this profit-maximizing firm is facing MRP1 and a wage rate of $12 per hour. Now suppose there is, simultaneously, an increase in demand for copper plumbing pipe such that MRP shifts to MRP2), and an increase in the wage rate to $16 per hour. The firm should
A) employ 20 more units of labour.
B) employ 40 more units of labour.
C) employ the same number of units of labour.
D) employ 40 fewer units of labour
E) employ 20 fewer units of labour.
FIGURE 13-1Refer to Figure 13-1. Suppose this profit-maximizing firm is facing MRP1 and a wage rate of $12 per hour. Now suppose there is, simultaneously, an increase in demand for copper plumbing pipe such that MRP shifts to MRP2), and an increase in the wage rate to $16 per hour. The firm should
A) employ 20 more units of labour.
B) employ 40 more units of labour.
C) employ the same number of units of labour.
D) employ 40 fewer units of labour
E) employ 20 fewer units of labour.
Unlock Deck
Unlock for access to all 124 flashcards in this deck.
Unlock Deck
k this deck
Unlock Deck
Unlock for access to all 124 flashcards in this deck.


