Deck 12: Economic Efficiency and Public Policy
Full screen (f)
Question
Question
Question
Question
Question
Question
Question
Question
Question
Question
Question
Question
Question
Question
Question
Consider three firms, A, B and C, all producing kilos of potatoes per year) in a perfectly competitive market. The diagrams below show marginal cost curves for each of the three firms.
 FIGURE 12-1
Refer to Figure 12-1. Suppose each of Firms A, B, and C are producing 500 kilos of potatoes. Is this industry productively efficient?
A) No, because the marginal cost curve for each firm has a different slope.
B) Yes, because output is equated for all firms.
C) No, because each firm could easily produce more than 500 kilos.
D) No, because marginal costs are not equated for all firms.
E) It is not possible to say whether this industry is productively efficient because we do not know the market price of the product.
FIGURE 12-1Refer to Figure 12-1. Suppose each of Firms A, B, and C are producing 500 kilos of potatoes. Is this industry productively efficient?
A) No, because the marginal cost curve for each firm has a different slope.
B) Yes, because output is equated for all firms.
C) No, because each firm could easily produce more than 500 kilos.
D) No, because marginal costs are not equated for all firms.
E) It is not possible to say whether this industry is productively efficient because we do not know the market price of the product.
Question
Question
Question
Question
Question
Question
Question
Question
Consider three firms, A, B and C, all producing kilos of potatoes per year) in a perfectly competitive market. The diagrams below show marginal cost curves for each of the three firms.
FIGURE 12-1
Refer to Figure 12-1. Suppose each of Firms A, B, and C are producing 500 kilos of potatoes. Is this industry allocatively efficient?
A) It is not possible to say whether this industry is allocatively efficient because we do not know the market price for kilos of potatoes.
B) It is not possible to say whether this industry is allocatively efficient because we do not know the average costs for each firm.
C) Yes, because output is equated for all firms.
D) No, since marginal costs are not equated for all firms, the industry is not productively efficient, and thus cannot be allocatively efficient.
E) No, because the marginal cost curve for each firm has a different slope.
FIGURE 12-1Refer to Figure 12-1. Suppose each of Firms A, B, and C are producing 500 kilos of potatoes. Is this industry allocatively efficient?
A) It is not possible to say whether this industry is allocatively efficient because we do not know the market price for kilos of potatoes.
B) It is not possible to say whether this industry is allocatively efficient because we do not know the average costs for each firm.
C) Yes, because output is equated for all firms.
D) No, since marginal costs are not equated for all firms, the industry is not productively efficient, and thus cannot be allocatively efficient.
E) No, because the marginal cost curve for each firm has a different slope.
Question
 FIGURE 12-3
When comparing a perfectly competitive firm and a single -price) monopolist, a major difference is that
A) the monopolist produces where MR = MC, but the perfect competitor does not.
B) the perfect competitor achieves productive efficiency, but the monopolist does not.
C) the perfect competitor produces where P = MC, but the monopolist does not.
D) the monopolist achieves allocative efficiency but the perfect competitor does not.
E) the perfect competitor minimizes its costs, but the monopolist does not.
Question
FIGURE 12-3Refer to Figure 12-3. If the diagram is depicting the market situation for a monopoly, the equilibrium price and quantity are
A) P1 and q1.
B) P1 and q2.
C) P2 and q1.
D) P2 and q2.
E) P3 and q1.
Question
Question
Consider three firms, A, B and C, all producing kilos of potatoes per year) in a perfectly competitive market. The diagrams below show marginal cost curves for each of the three firms.
FIGURE 12-1
Refer to Figure 12-1. Suppose each of Firms A, B and C are producing 500 kilos of potatoes. Keeping total output unchanged, what level of output should each firm be producing such that the industry is productively efficient?
A) Firm A: 200 kilos, Firm B: 500 kilos, Firm C: 800 kilos
B) Firm A: 700 kilos, Firm B: 800 kilos, Firm C: 0 kilos
C) Firm A: 500 kilos, Firm B: 800 kilos, Firm C: 200 kilos
D) Firm A: 500 kilos, Firm B: 500 kilos, Firm C: 500 kilos
E) Firm A: 500 kilos, Firm B: 200 kilos, Firm C: 200 kilos
FIGURE 12-1Refer to Figure 12-1. Suppose each of Firms A, B and C are producing 500 kilos of potatoes. Keeping total output unchanged, what level of output should each firm be producing such that the industry is productively efficient?
A) Firm A: 200 kilos, Firm B: 500 kilos, Firm C: 800 kilos
B) Firm A: 700 kilos, Firm B: 800 kilos, Firm C: 0 kilos
C) Firm A: 500 kilos, Firm B: 800 kilos, Firm C: 200 kilos
D) Firm A: 500 kilos, Firm B: 500 kilos, Firm C: 500 kilos
E) Firm A: 500 kilos, Firm B: 200 kilos, Firm C: 200 kilos
Question
The production possibilities boundary shows possible combinations of guns and butter that can be produced by a country. The lower diagram shows demand and supply for butter.
 FIGURE 12-2
Refer to Figure 12-2. Suppose demand and supply for butter are shown by D and S, respectively. And suppose the economy is at point b) on the production possibilities boundary, producing Q1 units of butter. We can say that this economy is efficient because .
A) allocatively; guns and butter are both produced to the point where the marginal cost to producers equals the marginal value to consumers
B) productively; the marginal cost of production across guns and butter is equated
C) allocatively; the price of guns is equal to the price of butter
D) productively; the economy is operating at a point inside the production possibilities boundary
E) allocatively; the economy is operating at a point on the production possibilities boundary
FIGURE 12-2Refer to Figure 12-2. Suppose demand and supply for butter are shown by D and S, respectively. And suppose the economy is at point b) on the production possibilities boundary, producing Q1 units of butter. We can say that this economy is efficient because .
A) allocatively; guns and butter are both produced to the point where the marginal cost to producers equals the marginal value to consumers
B) productively; the marginal cost of production across guns and butter is equated
C) allocatively; the price of guns is equal to the price of butter
D) productively; the economy is operating at a point inside the production possibilities boundary
E) allocatively; the economy is operating at a point on the production possibilities boundary
Question
Question
FIGURE 12-3Choose the statement that best compares the long -run equilibrium of a competitive industry with that in a monopolized industry with a single price).
A) Resources will be allocated efficiently in both the competitive and monopolized industries.
B) Allocative efficiency will be achieved in the competitive, but not the monopolized industry.
C) Allocative efficiency is not possible in either industry.
D) Allocative efficiency will be achieved in the monopolized, but not the competitive industry.
E) It is not possible to make this comparison because firms in a competitive industry operate only in the short run.
Question
Question
Question
Question
The production possibilities boundary shows possible combinations of guns and butter that can be produced by a country. The lower diagram shows demand and supply for butter.
FIGURE 12-2
Refer to Figure 12-2. Suppose demand and supply for butter are shown by D and S, respectively. And suppose the economy is at point a) on the production possibilities boundary. Is this output of guns and butter allocatively efficient?
A) No, because the marginal value to consumers of the butter produced is greater than the marginal cost to producers.
B) No, because the marginal cost to producers of the butter produced is more than the marginal value to consumers.
C) Yes, because all points on the production possibilities boundary are allocatively efficient.
D) Yes, because the marginal cost of producing the butter equals the marginal value of consuming the butter.
E) No, because the marginal costs for guns and butter are not equated.
FIGURE 12-2Refer to Figure 12-2. Suppose demand and supply for butter are shown by D and S, respectively. And suppose the economy is at point a) on the production possibilities boundary. Is this output of guns and butter allocatively efficient?
A) No, because the marginal value to consumers of the butter produced is greater than the marginal cost to producers.
B) No, because the marginal cost to producers of the butter produced is more than the marginal value to consumers.
C) Yes, because all points on the production possibilities boundary are allocatively efficient.
D) Yes, because the marginal cost of producing the butter equals the marginal value of consuming the butter.
E) No, because the marginal costs for guns and butter are not equated.
Question
The production possibilities boundary shows possible combinations of guns and butter that can be produced by a country. The lower diagram shows demand and supply for butter.
FIGURE 12-2
Refer to Figure 12-2. Suppose this economy is allocatively efficient at Q1 units of butter. Now suppose there is an increase in demand for butter from D to D1. After this shift in demand,
A) the supply curve will shift up to S1 and allocative efficiency will be maintained.
B) the marginal value to consumers of butter is less than the marginal cost to producers; the price of butter relative to the price of guns) rises; the economy moves to output Q 2 of butter and point c) on the PPB.
C) the marginal value to consumers of butter is greater than the marginal cost to producers; the price of butter relative to the price of guns) rises; the economy moves to output Q2 of butter and point c) on the PPB.
D) the increase in the price of butter relative to the price of guns) will cause the demand curve to shift back down to D and allocative efficiency will be maintained.
E) the price of guns relative to the price of butter) rises and the economy moves to point a) on the PPB.
FIGURE 12-2Refer to Figure 12-2. Suppose this economy is allocatively efficient at Q1 units of butter. Now suppose there is an increase in demand for butter from D to D1. After this shift in demand,
A) the supply curve will shift up to S1 and allocative efficiency will be maintained.
B) the marginal value to consumers of butter is less than the marginal cost to producers; the price of butter relative to the price of guns) rises; the economy moves to output Q 2 of butter and point c) on the PPB.
C) the marginal value to consumers of butter is greater than the marginal cost to producers; the price of butter relative to the price of guns) rises; the economy moves to output Q2 of butter and point c) on the PPB.
D) the increase in the price of butter relative to the price of guns) will cause the demand curve to shift back down to D and allocative efficiency will be maintained.
E) the price of guns relative to the price of butter) rises and the economy moves to point a) on the PPB.
Question
Question
FIGURE 12-3Refer to Figure 12-3. If the diagram is depicting a perfectly competitive industry, the equilibrium price and quantity is
A) P1 and q1.
B) P1 and q2.
C) P2 and q1.
D) P2 and q2.
E) P3 and q1.
Question
The production possibilities boundary shows possible combinations of guns and butter that can be produced by a country. The lower diagram shows demand and supply for butter.
FIGURE 12-2
Refer to Figure 12-2. Suppose demand and supply for butter are shown by D and S, respectively. And suppose the economy is at point a) on the production possibilities boundary. How can this economy move toward allocative efficiency?
A) expand the production possibilities boundary outward
B) increase the supply of guns
C) increase the demand for butter
D) produce less butter, more guns
E) produce more butter, fewer guns
FIGURE 12-2Refer to Figure 12-2. Suppose demand and supply for butter are shown by D and S, respectively. And suppose the economy is at point a) on the production possibilities boundary. How can this economy move toward allocative efficiency?
A) expand the production possibilities boundary outward
B) increase the supply of guns
C) increase the demand for butter
D) produce less butter, more guns
E) produce more butter, fewer guns
Question
Question
Consider three firms, A, B and C, all producing kilos of potatoes per year) in a perfectly competitive market. The diagrams below show marginal cost curves for each of the three firms.
FIGURE 12-1
Refer to Figure 12-1. Suppose each of Firms A, B, and C are producing 500 kilos of potatoes. Which of the following statements correctly describes the productive efficiency of this industry?
A) Productive efficiency would be achieved if Firm B produced all the output, since it has the lowest MC for the production of 500 kilos.
B) It is possible to reduce the total cost of the given output by reallocating production among the three firms.
C) The total output of 1500 kilos is the productively efficient output for this industry, so no reallocation is necessary.
D) It is not possible to say whether this industry is productively efficient because we do not know the market price of the product.
E) It is not possible to say whether this industry is productively efficient because we do not know the average costs for each firm.
FIGURE 12-1Refer to Figure 12-1. Suppose each of Firms A, B, and C are producing 500 kilos of potatoes. Which of the following statements correctly describes the productive efficiency of this industry?
A) Productive efficiency would be achieved if Firm B produced all the output, since it has the lowest MC for the production of 500 kilos.
B) It is possible to reduce the total cost of the given output by reallocating production among the three firms.
C) The total output of 1500 kilos is the productively efficient output for this industry, so no reallocation is necessary.
D) It is not possible to say whether this industry is productively efficient because we do not know the market price of the product.
E) It is not possible to say whether this industry is productively efficient because we do not know the average costs for each firm.
Question
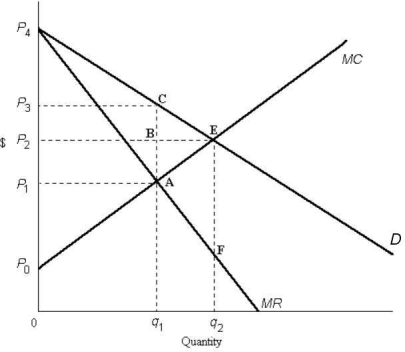 FIGURE 12-3
Refer to Figure 12-3. The area representing consumer surplus in a monopoly equilibrium is outlined by
A) ACE.
B) ABE.
C) 0P4Eq2.
D) P3P4C.
E) P2P4E.
Question
Question
Question
The diagram below shows supply, demand, and quantity exchanged of Monday matinee movie tickets. Assume it is a perfectly competitive market.
 FIGURE 12-4
Refer to Figure 12-4. Suppose a disequilibrium price of $7.50 per movie ticket is imposed on this market. The total economic surplus is now , which is than the total economic surplus generated at the allocatively efficient level of output.
A) $125; $250 less
B) $125; $125 less
C) $187.50; $62.50 less
D) $62.50; $125 less
E) $187.50; $187.50 less
FIGURE 12-4Refer to Figure 12-4. Suppose a disequilibrium price of $7.50 per movie ticket is imposed on this market. The total economic surplus is now , which is than the total economic surplus generated at the allocatively efficient level of output.
A) $125; $250 less
B) $125; $125 less
C) $187.50; $62.50 less
D) $62.50; $125 less
E) $187.50; $187.50 less
Question
The diagram below shows supply, demand, and quantity exchanged of Monday matinee movie tickets. Assume it is a perfectly competitive market.
FIGURE 12-4
Refer to Figure 12-4. Suppose a disequilibrium price of $7.50 per movie ticket is imposed in this market. The consumer surplus becomes and the producer surplus becomes .
A) $0; $62.50
B) $2.50; $7.50
C) $62.50; $125
D) $62.50; $250
E) $31.25; $156.25
FIGURE 12-4Refer to Figure 12-4. Suppose a disequilibrium price of $7.50 per movie ticket is imposed in this market. The consumer surplus becomes and the producer surplus becomes .
A) $0; $62.50
B) $2.50; $7.50
C) $62.50; $125
D) $62.50; $250
E) $31.25; $156.25
Question
The diagram below shows supply, demand, and quantity exchanged of Monday matinee movie tickets. Assume it is a perfectly competitive market.
FIGURE 12-4
Refer to Figure 12-4. If a disequilibrium price of $7.50 per movie ticket were imposed on this market, this market would not be allocatively efficient because
1) the sum of consumer and producer surplus would not be maximized;
2) the marginal benefit to consumers of the last movie consumed would be greater than the marginal cost to the seller;
3) the marginal cost to the seller of the last movie consumed would be more than the marginal benefit to consumers.
A) 1 only
B) 2 only
C) 3 only
D) 1 and 2
E) 2 and 3
FIGURE 12-4Refer to Figure 12-4. If a disequilibrium price of $7.50 per movie ticket were imposed on this market, this market would not be allocatively efficient because
1) the sum of consumer and producer surplus would not be maximized;
2) the marginal benefit to consumers of the last movie consumed would be greater than the marginal cost to the seller;
3) the marginal cost to the seller of the last movie consumed would be more than the marginal benefit to consumers.
A) 1 only
B) 2 only
C) 3 only
D) 1 and 2
E) 2 and 3
Question
The diagram below shows supply, demand, and quantity exchanged of Monday matinee movie tickets. Assume it is a perfectly competitive market.
FIGURE 12-4
Refer to Figure 12-4. What is the value of the consumer surplus generated in this market at the allocatively efficient level of output?
A) $0
B) $5
C) $10
D) $125
E) $250
FIGURE 12-4Refer to Figure 12-4. What is the value of the consumer surplus generated in this market at the allocatively efficient level of output?
A) $0
B) $5
C) $10
D) $125
E) $250
Question
FIGURE 12-3Refer to Figure 12-3. The area representing consumer surplus in a perfectly competitive equilibrium is outlined by
A) ACE.
B) ABE.
C) 0P4Eq2.
D) P3P4C.
E) P2P4E.
Question
FIGURE 12-3Refer to Figure 12-3. Comparing the monopoly equilibrium to the perfectly competitive equilibrium, the area representing the gain in producer surplus due to monopoly is outlined by
A) P1P3CA less ACE.
B) P2P3CB less ABE.
C) P0P3CA less ACE
D) P3P4 less ABE.
E) P2P4E.
Question
Question
FIGURE 12-3Refer to Figure 12-3. Comparing the perfectly competitive equilibrium to the monopoly equilibrium, the reduction in consumer surplus due to monopoly is outlined by
A) P2EP4.
B) P2ECP3.
C) BCE.
D) q1CEq2.
E) P2P3E.
Question
The diagram below shows supply, demand, and quantity exchanged of Monday matinee movie tickets. Assume it is a perfectly competitive market.
FIGURE 12-4
Refer to Figure 12-4. What is the total economic surplus generated in this market at the allocatively efficient level of output?
A) $5
B) $10
C) $125
D) $250
E) $500
FIGURE 12-4Refer to Figure 12-4. What is the total economic surplus generated in this market at the allocatively efficient level of output?
A) $5
B) $10
C) $125
D) $250
E) $500
Question
The diagram below shows supply, demand, and quantity exchanged of Monday matinee movie tickets. Assume it is a perfectly competitive market.
FIGURE 12-4
Refer to Figure 12-4. What is the value of the producer surplus generated in this market at the free-market equilibrium?
A) $0
B) $5
C) $10
D) $125
E) $250
FIGURE 12-4Refer to Figure 12-4. What is the value of the producer surplus generated in this market at the free-market equilibrium?
A) $0
B) $5
C) $10
D) $125
E) $250
Question
Question
Question
FIGURE 12-3Refer to Figure 12-3. Comparing the perfectly competitive equilibrium to the monopoly equilibrium, the deadweight loss of monopoly is given by
A) q1BEq2.
B) AP4E.
C) q1CEq2.
D) ACE.
E) P2P4E.
Question
The diagram below shows supply, demand, and quantity exchanged of Monday matinee movie tickets. Assume it is a perfectly competitive market.
FIGURE 12-4
Refer to Figure 12-4. What is the total revenue received by the sellers of this product at the allocatively efficient level of output?
A) $5
B) $125
C) $250
D) $375
E) $500
FIGURE 12-4Refer to Figure 12-4. What is the total revenue received by the sellers of this product at the allocatively efficient level of output?
A) $5
B) $125
C) $250
D) $375
E) $500
Question
Question
FIGURE 12-3Refer to Figure 12-3. Comparing the monopoly equilibrium to the perfectly competitive equilibrium, the area
P2P3CB represents
A) the dead-weight loss of monopoly.
B) a redistribution of income from consumers to the monopolist.
C) the net gain in the monopolistʹs profits.
D) the net loss in the monopolistʹs profits.
E) a redistribution of income from the monopolist to the consumer.
Question
FIGURE 12-3Refer to Figure 12-3. The area representing producer surplus at the monopoly equilibrium is outlined by
A) 0P0Aq1.
B) P0P2BA.
C) P0AP1.
D) P0P3CA.
E) 0P3Cq1.
Question
Question
The diagram below shows the demand and supply curves in a perfectly competitive market.
 FIGURE 12-5
Refer to Figure 12-5. If output in this market were Q3, and the price was still equal to its free-market level, the loss in producer surplus relative to the competitive equilibrium would be illustrated by area
A) 1.
B) 2.
C) 3.
D) 4.
E) 3 + 4.
FIGURE 12-5Refer to Figure 12-5. If output in this market were Q3, and the price was still equal to its free-market level, the loss in producer surplus relative to the competitive equilibrium would be illustrated by area
A) 1.
B) 2.
C) 3.
D) 4.
E) 3 + 4.
Question
The diagram below shows the demand and supply curves in a perfectly competitive market.
FIGURE 12-5
Refer to Figure 12-5. If output in this market were Q3, the loss in total economic surplus relative to the competitive equilibrium would be illustrated by area
A) 1.
B) 2.
C) 3.
D) 4.
E) 3 + 4.
FIGURE 12-5Refer to Figure 12-5. If output in this market were Q3, the loss in total economic surplus relative to the competitive equilibrium would be illustrated by area
A) 1.
B) 2.
C) 3.
D) 4.
E) 3 + 4.
Question
The diagram below shows the demand and supply curves in a perfectly competitive market.
FIGURE 12-5
Refer to Figure 12-5. At the free-market equilibrium, consumer surplus is represented by the area
A) P2P3E.
B) P1P2E.
C) P1P3E.
D) 1 + 2.
E) 1 + 2 + 3 + 4.
FIGURE 12-5Refer to Figure 12-5. At the free-market equilibrium, consumer surplus is represented by the area
A) P2P3E.
B) P1P2E.
C) P1P3E.
D) 1 + 2.
E) 1 + 2 + 3 + 4.
Question
Question
The diagram below shows the demand and supply curves in a perfectly competitive market.
FIGURE 12-5
Refer to Figure 12-5. In the free-market equilibrium, producer plus consumer surplus is maximized and is illustrated by the area
A) P3P2E.
B) P1P2E.
C) P1P3E.
D) 1 + 2.
E) 1 + 2 + 3 + 4.
FIGURE 12-5Refer to Figure 12-5. In the free-market equilibrium, producer plus consumer surplus is maximized and is illustrated by the area
A) P3P2E.
B) P1P2E.
C) P1P3E.
D) 1 + 2.
E) 1 + 2 + 3 + 4.
Question
Question
The diagram below shows the demand and supply curves in a perfectly competitive market.
FIGURE 12-5
Refer to Figure 12-5. If output in this market were Q1, but the price was still at its free-market level, the loss in consumer surplus relative to the competitive equilibrium would be illustrated by area
A) P3P2E.
B) P1P3E.
C) 1.
D) 2.
E) 1 + 2.
FIGURE 12-5Refer to Figure 12-5. If output in this market were Q1, but the price was still at its free-market level, the loss in consumer surplus relative to the competitive equilibrium would be illustrated by area
A) P3P2E.
B) P1P3E.
C) 1.
D) 2.
E) 1 + 2.
Question
Question
Question
Question
The diagram below shows the demand and supply curves in a perfectly competitive market.
FIGURE 12-5
Refer to Figure 12-5. If output in this market were Q1, and the price were still equal to its free-market level, the loss in producer surplus relative to the competitive equilibrium would be illustrated by area
A) P3P2E.
B) P1P3E.
C) 1.
D) 2.
E) 1 + 2.
FIGURE 12-5Refer to Figure 12-5. If output in this market were Q1, and the price were still equal to its free-market level, the loss in producer surplus relative to the competitive equilibrium would be illustrated by area
A) P3P2E.
B) P1P3E.
C) 1.
D) 2.
E) 1 + 2.
Question
The diagram below shows the demand and supply curves in a perfectly competitive market.
FIGURE 12-5
Refer to Figure 12-5. Allocative efficiency occurs
A) at output level Q3.
B) at output level Q1.
C) at price P1 and output Q3.
D) at price P2 and output Q2.
E) where the areas 1, 2, 3, and 4 are maximized.
FIGURE 12-5Refer to Figure 12-5. Allocative efficiency occurs
A) at output level Q3.
B) at output level Q1.
C) at price P1 and output Q3.
D) at price P2 and output Q2.
E) where the areas 1, 2, 3, and 4 are maximized.
Question
The diagram below shows the demand and supply curves in a perfectly competitive market.
FIGURE 12-5
Refer to Figure 12-5. If output in this market were Q1, the total loss in economic surplus relative to the competitive equilibrium would be illustrated by area
A) P1P3E.
B) 1.
C) 2.
D) 1 + 2.
E) 1 + 2 + 3 + 4.
FIGURE 12-5Refer to Figure 12-5. If output in this market were Q1, the total loss in economic surplus relative to the competitive equilibrium would be illustrated by area
A) P1P3E.
B) 1.
C) 2.
D) 1 + 2.
E) 1 + 2 + 3 + 4.
Question
The diagram below shows the demand and supply curves in a perfectly competitive market.
FIGURE 12-5
Refer to Figure 12-5. In the free-market equilibrium, producer surplus is shown by the area
A) P3P2E.
B) P1P2E.
C) P1P3E.
D) 1 +2.
E) 1 + 2 + 3 + 4.
FIGURE 12-5Refer to Figure 12-5. In the free-market equilibrium, producer surplus is shown by the area
A) P3P2E.
B) P1P2E.
C) P1P3E.
D) 1 +2.
E) 1 + 2 + 3 + 4.
Question
Question
Question
Question
The diagram below shows the demand and supply curves in a perfectly competitive market.
FIGURE 12-5
Refer to Figure 12-5. If output in this market were Q3, and the price were still P2, the loss in consumer surplus relative to the competitive equilibrium would be illustrated by area
A) 1.
B) 2.
C) 3.
D) 4.
E) 3 + 4.
FIGURE 12-5Refer to Figure 12-5. If output in this market were Q3, and the price were still P2, the loss in consumer surplus relative to the competitive equilibrium would be illustrated by area
A) 1.
B) 2.
C) 3.
D) 4.
E) 3 + 4.
Question

Unlock Deck
Sign up to unlock the cards in this deck!
Unlock Deck
Unlock Deck
1/123
Play
Full screen (f)
Deck 12: Economic Efficiency and Public Policy
1
If an economy is productively inefficient, it could improve its situation by
A) moving along its production possibilities boundary.
B) moving beyond its production possibilities boundary.
C) moving onto its production possibilities boundary.
D) acquiring more resources.
E) trading some of its resources.
A) moving along its production possibilities boundary.
B) moving beyond its production possibilities boundary.
C) moving onto its production possibilities boundary.
D) acquiring more resources.
E) trading some of its resources.
C
2
Allocative efficiency is actively sought
A) by profit-maximizing firms in all market structures.
B) only by perfectly-competitive firms.
C) only by profit-maximizing imperfectly-competitive firms.
D) by none of the firms in any market.
E) by all firms in all markets.
A) by profit-maximizing firms in all market structures.
B) only by perfectly-competitive firms.
C) only by profit-maximizing imperfectly-competitive firms.
D) by none of the firms in any market.
E) by all firms in all markets.
D
3
For an entire economy, allocative efficiency requires that
A) goods are allocated equitably across markets.
B) marginal cost equals price for all goods.
C) MRP is equated for all factors of production.
D) price equals average cost for all goods.
E) price is greater than marginal cost for all goods.
A) goods are allocated equitably across markets.
B) marginal cost equals price for all goods.
C) MRP is equated for all factors of production.
D) price equals average cost for all goods.
E) price is greater than marginal cost for all goods.
B
4
If all firms are profit maximizers, then the following is assured:
A) allocative efficiency.
B) each firm is productively efficient.
C) allocative and productive efficiency.
D) that the economy is operating inside the production possibilities boundary.
E) that firms attain the lowest possible average costs.
A) allocative efficiency.
B) each firm is productively efficient.
C) allocative and productive efficiency.
D) that the economy is operating inside the production possibilities boundary.
E) that firms attain the lowest possible average costs.
Unlock Deck
Unlock for access to all 123 flashcards in this deck.
Unlock Deck
k this deck
5
Allocative efficiency concerns
A) producing outputs at lowest possible cost.
B) the allocation of resources such that total economic surplus is maximized.
C) encouraging monopoly if it generates innovation.
D) discouraging all monopoly firms.
E) the equitable distribution of resources.
A) producing outputs at lowest possible cost.
B) the allocation of resources such that total economic surplus is maximized.
C) encouraging monopoly if it generates innovation.
D) discouraging all monopoly firms.
E) the equitable distribution of resources.
Unlock Deck
Unlock for access to all 123 flashcards in this deck.
Unlock Deck
k this deck
6
An economy will be allocatively efficient if
A) least-cost production techniques are employed by all firms.
B) the marginal costs of all firms in an industry are equal.
C) marginal cost equals price for all goods.
D) the economyʹs resources are fully employed.
E) imperfectly competitive markets are regulated.
A) least-cost production techniques are employed by all firms.
B) the marginal costs of all firms in an industry are equal.
C) marginal cost equals price for all goods.
D) the economyʹs resources are fully employed.
E) imperfectly competitive markets are regulated.
Unlock Deck
Unlock for access to all 123 flashcards in this deck.
Unlock Deck
k this deck
7
An economy will be allocatively efficient if
A) the economyʹs resources are fully employed.
B) all firms are breaking even.
C) the average cost of production is the lowest possible for all goods produced.
D) price equals marginal cost for all products.
E) the price equals average cost for all goods.
A) the economyʹs resources are fully employed.
B) all firms are breaking even.
C) the average cost of production is the lowest possible for all goods produced.
D) price equals marginal cost for all products.
E) the price equals average cost for all goods.
Unlock Deck
Unlock for access to all 123 flashcards in this deck.
Unlock Deck
k this deck
8
We can safely say that each point on a countryʹs production possibilities boundary PPB) is
A) allocatively efficient.
B) one at which P = MC for all goods.
C) productively efficient.
D) Pareto optimal.
E) not productively efficient.
A) allocatively efficient.
B) one at which P = MC for all goods.
C) productively efficient.
D) Pareto optimal.
E) not productively efficient.
Unlock Deck
Unlock for access to all 123 flashcards in this deck.
Unlock Deck
k this deck
9
Consider an industry with three profit-maximizing firms producing identical soccer jerseys. At their current levels of output, Firm A has a MC of $22, Firm B has a MC of $26, and Firm C has a MC of $27. Each firm is minimizing its costs for its given level of output. Which of the following statements is definitely true?
A) Each firm and the industry are productively efficient.
B) Each firm is productively efficient but the industry is not.
C) The industry is productively efficient but each firm is not.
D) Each firm is allocatively efficient but the industry is not.
E) Each firm and the industry are allocatively efficient.
Unlock Deck
Unlock for access to all 123 flashcards in this deck.
Unlock Deck
k this deck
10
Productive efficiency for an individual firm requires that
A) all resources be fully used.
B) MC = P for all goods.
C) the firm be on its LRAC curve.
D) the firm be allocatively efficient.
E) P = ATC for all goods.
A) all resources be fully used.
B) MC = P for all goods.
C) the firm be on its LRAC curve.
D) the firm be allocatively efficient.
E) P = ATC for all goods.
Unlock Deck
Unlock for access to all 123 flashcards in this deck.
Unlock Deck
k this deck
11
Consider two firms, A and B, that are producing the same product but with different average costs. Economists say this situation reflects a problem of
A) unemployed resources.
B) economic inefficiency.
C) productive inefficiency.
D) allocative inefficiency.
E) Not necessarily any of the above.
A) unemployed resources.
B) economic inefficiency.
C) productive inefficiency.
D) allocative inefficiency.
E) Not necessarily any of the above.
Unlock Deck
Unlock for access to all 123 flashcards in this deck.
Unlock Deck
k this deck
12
Productive efficiency at the level of the firm) is a goal that is sought
A) by profit-maximizing firms in all market structures.
B) only by perfectly competitive firms.
C) only by profit-maximizing imperfectly competitive firms.
D) by no firms in any market.
E) only by profit-maximizing firms in an oligopolistic market structure.
A) by profit-maximizing firms in all market structures.
B) only by perfectly competitive firms.
C) only by profit-maximizing imperfectly competitive firms.
D) by no firms in any market.
E) only by profit-maximizing firms in an oligopolistic market structure.
Unlock Deck
Unlock for access to all 123 flashcards in this deck.
Unlock Deck
k this deck
13
If the total output of some industry is allocated among its individual firms in such a way that the total cost of producing the industryʹs output is minimized, we know the industry has achieved
1) full employment of resources;
2) productive efficiency;
3) allocative efficiency.
A) 1 only
B) 2 only
C) 3 only
D) both 1 and 3
E) both 2 and 3
1) full employment of resources;
2) productive efficiency;
3) allocative efficiency.
A) 1 only
B) 2 only
C) 3 only
D) both 1 and 3
E) both 2 and 3
Unlock Deck
Unlock for access to all 123 flashcards in this deck.
Unlock Deck
k this deck
14
Consider two firms, A and B, that are producing the same product but with different marginal costs. In this case,
A) a reallocation of output between the firms can lower the industryʹs total cost.
B) neither firm is producing its output at the lowest attainable cost.
C) some resources must be unemployed.
D) each firm is being wasteful.
E) one firm is not maximizing profits.
A) a reallocation of output between the firms can lower the industryʹs total cost.
B) neither firm is producing its output at the lowest attainable cost.
C) some resources must be unemployed.
D) each firm is being wasteful.
E) one firm is not maximizing profits.
Unlock Deck
Unlock for access to all 123 flashcards in this deck.
Unlock Deck
k this deck
15
Consider three firms, A, B and C, all producing kilos of potatoes per year) in a perfectly competitive market. The diagrams below show marginal cost curves for each of the three firms.
FIGURE 12-1
Refer to Figure 12-1. Suppose each of Firms A, B, and C are producing 500 kilos of potatoes. Is this industry productively efficient?
A) No, because the marginal cost curve for each firm has a different slope.
B) Yes, because output is equated for all firms.
C) No, because each firm could easily produce more than 500 kilos.
D) No, because marginal costs are not equated for all firms.
E) It is not possible to say whether this industry is productively efficient because we do not know the market price of the product.
FIGURE 12-1Refer to Figure 12-1. Suppose each of Firms A, B, and C are producing 500 kilos of potatoes. Is this industry productively efficient?
A) No, because the marginal cost curve for each firm has a different slope.
B) Yes, because output is equated for all firms.
C) No, because each firm could easily produce more than 500 kilos.
D) No, because marginal costs are not equated for all firms.
E) It is not possible to say whether this industry is productively efficient because we do not know the market price of the product.
Unlock Deck
Unlock for access to all 123 flashcards in this deck.
Unlock Deck
k this deck
16
Consider a monopolistically competitive industry in long-run equilibrium. Will this industry be productively efficient?
A) Yes. Since the firms are in long-run equilibrium, they will all be producing at the minimum of their LRAC curves.
B) Yes. Since the firms are in long-run equilibrium, they will all be operating on their LRAC curves.
C) Yes. In long-run equilibrium, each firm is producing at an output level where price is equal to marginal cost.
D) No. Firms are selling their output at a level where price exceeds marginal cost and thus, by definition, cannot be productively efficient.
E) No. Since firms are selling differentiated products and there is no industry -wide price, we cannot conclude that marginal cost will be equated across all firms.
Unlock Deck
Unlock for access to all 123 flashcards in this deck.
Unlock Deck
k this deck
17
At the level of the industry, the condition for productive efficiency is that
A) goods are allocated equitably.
B) there are no idle resources in the industry.
C) MC = P for all goods.
D) MRP = P for all inputs.
E) MC is equal for all firms in the industry.
A) goods are allocated equitably.
B) there are no idle resources in the industry.
C) MC = P for all goods.
D) MRP = P for all inputs.
E) MC is equal for all firms in the industry.
Unlock Deck
Unlock for access to all 123 flashcards in this deck.
Unlock Deck
k this deck
18
Allocative efficiency is a property of the behaviour of
A) individual firms.
B) all firms in an industry.
C) perfectly-competitive firms.
D) monopolies.
E) the overall economy.
A) individual firms.
B) all firms in an industry.
C) perfectly-competitive firms.
D) monopolies.
E) the overall economy.
Unlock Deck
Unlock for access to all 123 flashcards in this deck.
Unlock Deck
k this deck
19
An economy in which there are no market failures and all industries are in a competitive long -run equilibrium is one where
1) allocative efficiency is achieved;
2) the economy is on the production possibilities boundary;
3) there is no incentive for firms to enter or leave industries.
A) 1 and 2
B) 2 and 3
C) 1 and 3
D) 1, 2, and 3
E) 2 only
1) allocative efficiency is achieved;
2) the economy is on the production possibilities boundary;
3) there is no incentive for firms to enter or leave industries.
A) 1 and 2
B) 2 and 3
C) 1 and 3
D) 1, 2, and 3
E) 2 only
Unlock Deck
Unlock for access to all 123 flashcards in this deck.
Unlock Deck
k this deck
20
All points on a countryʹs production possibilities boundary are
A) allocatively efficient.
B) points at which P = MC for all goods.
C) productively efficient.
D) Pareto optimal.
E) not productively efficient.
A) allocatively efficient.
B) points at which P = MC for all goods.
C) productively efficient.
D) Pareto optimal.
E) not productively efficient.
Unlock Deck
Unlock for access to all 123 flashcards in this deck.
Unlock Deck
k this deck
21
Monopoly is allocatively inefficient because
A) the price exceeds the marginal cost of the last unit produced.
B) the opportunity cost exceeds the marginal cost of the last unit produced.
C) the marginal cost exceeds the average cost for the last unit produced.
D) lower costs could be achieved.
E) the firm has no incentive to maximize profits.
Unlock Deck
Unlock for access to all 123 flashcards in this deck.
Unlock Deck
k this deck
22
An important defence of oligopoly as a market structure is that
A) it involves less allocative inefficiency than monopoly.
B) it results in lower prices than perfect competition.
C) it is the most efficient available alternative when the minimum efficient scale is large.
D) it generates less unused capacity than monopolistic competition.
E) it is more productively efficient than monopoly.
Unlock Deck
Unlock for access to all 123 flashcards in this deck.
Unlock Deck
k this deck
23
Consider three firms, A, B and C, all producing kilos of potatoes per year) in a perfectly competitive market. The diagrams below show marginal cost curves for each of the three firms.
FIGURE 12-1
Refer to Figure 12-1. Suppose each of Firms A, B, and C are producing 500 kilos of potatoes. Is this industry allocatively efficient?
A) It is not possible to say whether this industry is allocatively efficient because we do not know the market price for kilos of potatoes.
B) It is not possible to say whether this industry is allocatively efficient because we do not know the average costs for each firm.
C) Yes, because output is equated for all firms.
D) No, since marginal costs are not equated for all firms, the industry is not productively efficient, and thus cannot be allocatively efficient.
E) No, because the marginal cost curve for each firm has a different slope.
FIGURE 12-1Refer to Figure 12-1. Suppose each of Firms A, B, and C are producing 500 kilos of potatoes. Is this industry allocatively efficient?
A) It is not possible to say whether this industry is allocatively efficient because we do not know the market price for kilos of potatoes.
B) It is not possible to say whether this industry is allocatively efficient because we do not know the average costs for each firm.
C) Yes, because output is equated for all firms.
D) No, since marginal costs are not equated for all firms, the industry is not productively efficient, and thus cannot be allocatively efficient.
E) No, because the marginal cost curve for each firm has a different slope.
Unlock Deck
Unlock for access to all 123 flashcards in this deck.
Unlock Deck
k this deck
24
FIGURE 12-3When comparing a perfectly competitive firm and a single -price) monopolist, a major difference is that
A) the monopolist produces where MR = MC, but the perfect competitor does not.
B) the perfect competitor achieves productive efficiency, but the monopolist does not.
C) the perfect competitor produces where P = MC, but the monopolist does not.
D) the monopolist achieves allocative efficiency but the perfect competitor does not.
E) the perfect competitor minimizes its costs, but the monopolist does not.
Unlock Deck
Unlock for access to all 123 flashcards in this deck.
Unlock Deck
k this deck
25
FIGURE 12-3Refer to Figure 12-3. If the diagram is depicting the market situation for a monopoly, the equilibrium price and quantity are
A) P1 and q1.
B) P1 and q2.
C) P2 and q1.
D) P2 and q2.
E) P3 and q1.
Unlock Deck
Unlock for access to all 123 flashcards in this deck.
Unlock Deck
k this deck
26
The Canadian economy is achieving allocative efficiency if
A) price equals average cost in all industries.
B) there are no idle resources in the economy.
C) marginal product is equal for all factors of production.
D) marginal cost equals price in all industries.
E) marginal cost is equalized across industries.
A) price equals average cost in all industries.
B) there are no idle resources in the economy.
C) marginal product is equal for all factors of production.
D) marginal cost equals price in all industries.
E) marginal cost is equalized across industries.
Unlock Deck
Unlock for access to all 123 flashcards in this deck.
Unlock Deck
k this deck
27
Consider three firms, A, B and C, all producing kilos of potatoes per year) in a perfectly competitive market. The diagrams below show marginal cost curves for each of the three firms.
FIGURE 12-1
Refer to Figure 12-1. Suppose each of Firms A, B and C are producing 500 kilos of potatoes. Keeping total output unchanged, what level of output should each firm be producing such that the industry is productively efficient?
A) Firm A: 200 kilos, Firm B: 500 kilos, Firm C: 800 kilos
B) Firm A: 700 kilos, Firm B: 800 kilos, Firm C: 0 kilos
C) Firm A: 500 kilos, Firm B: 800 kilos, Firm C: 200 kilos
D) Firm A: 500 kilos, Firm B: 500 kilos, Firm C: 500 kilos
E) Firm A: 500 kilos, Firm B: 200 kilos, Firm C: 200 kilos
FIGURE 12-1Refer to Figure 12-1. Suppose each of Firms A, B and C are producing 500 kilos of potatoes. Keeping total output unchanged, what level of output should each firm be producing such that the industry is productively efficient?
A) Firm A: 200 kilos, Firm B: 500 kilos, Firm C: 800 kilos
B) Firm A: 700 kilos, Firm B: 800 kilos, Firm C: 0 kilos
C) Firm A: 500 kilos, Firm B: 800 kilos, Firm C: 200 kilos
D) Firm A: 500 kilos, Firm B: 500 kilos, Firm C: 500 kilos
E) Firm A: 500 kilos, Firm B: 200 kilos, Firm C: 200 kilos
Unlock Deck
Unlock for access to all 123 flashcards in this deck.
Unlock Deck
k this deck
28
The production possibilities boundary shows possible combinations of guns and butter that can be produced by a country. The lower diagram shows demand and supply for butter.
FIGURE 12-2
Refer to Figure 12-2. Suppose demand and supply for butter are shown by D and S, respectively. And suppose the economy is at point b) on the production possibilities boundary, producing Q1 units of butter. We can say that this economy is efficient because .
A) allocatively; guns and butter are both produced to the point where the marginal cost to producers equals the marginal value to consumers
B) productively; the marginal cost of production across guns and butter is equated
C) allocatively; the price of guns is equal to the price of butter
D) productively; the economy is operating at a point inside the production possibilities boundary
E) allocatively; the economy is operating at a point on the production possibilities boundary
FIGURE 12-2Refer to Figure 12-2. Suppose demand and supply for butter are shown by D and S, respectively. And suppose the economy is at point b) on the production possibilities boundary, producing Q1 units of butter. We can say that this economy is efficient because .
A) allocatively; guns and butter are both produced to the point where the marginal cost to producers equals the marginal value to consumers
B) productively; the marginal cost of production across guns and butter is equated
C) allocatively; the price of guns is equal to the price of butter
D) productively; the economy is operating at a point inside the production possibilities boundary
E) allocatively; the economy is operating at a point on the production possibilities boundary
Unlock Deck
Unlock for access to all 123 flashcards in this deck.
Unlock Deck
k this deck
29
In principle, a comparison of the long-run equilibrium of competitive and single-price) monopoly industries leads to the following conclusion:
A) both the competitive industry and the monopoly will allocate resources efficiently.
B) the competitive industry is consistent with allocative efficiency whereas the monopoly is not.
C) neither industry is capable of allocative efficiency.
D) the competitive industry will achieve productive efficiency but the monopoly will not.
E) both the competitive industry and the monopoly will allocate resources inefficiently.
Unlock Deck
Unlock for access to all 123 flashcards in this deck.
Unlock Deck
k this deck
30
FIGURE 12-3Choose the statement that best compares the long -run equilibrium of a competitive industry with that in a monopolized industry with a single price).
A) Resources will be allocated efficiently in both the competitive and monopolized industries.
B) Allocative efficiency will be achieved in the competitive, but not the monopolized industry.
C) Allocative efficiency is not possible in either industry.
D) Allocative efficiency will be achieved in the monopolized, but not the competitive industry.
E) It is not possible to make this comparison because firms in a competitive industry operate only in the short run.
Unlock Deck
Unlock for access to all 123 flashcards in this deck.
Unlock Deck
k this deck
31
Traditionally, economists have regarded monopoly as an undesirable market structure because
A) of its ability to minimize costs through large output.
B) it is allocatively inefficient.
C) of its wasteful innovation.
D) it is usually characterized by wastefully confrontational labour relations.
E) it allows producers to earn large profits.
A) of its ability to minimize costs through large output.
B) it is allocatively inefficient.
C) of its wasteful innovation.
D) it is usually characterized by wastefully confrontational labour relations.
E) it allows producers to earn large profits.
Unlock Deck
Unlock for access to all 123 flashcards in this deck.
Unlock Deck
k this deck
32
If a perfectly competitive industry was suddenly monopolized without any change in cost conditions,
A) both price and quantity produced would increase.
B) both price and quantity produced would decrease.
C) price would increase and quantity produced would decrease.
D) price would decrease and quantity produced would increase.
E) there would be no change in either price or quantity produced.
A) both price and quantity produced would increase.
B) both price and quantity produced would decrease.
C) price would increase and quantity produced would decrease.
D) price would decrease and quantity produced would increase.
E) there would be no change in either price or quantity produced.
Unlock Deck
Unlock for access to all 123 flashcards in this deck.
Unlock Deck
k this deck
33
In the absence of other market failures, allocative efficiency is achieved in a perfectly competitive industry because
A) firms do not need to maximize profits.
B) the industry produces a level of output such that the marginal cost of production is minimized.
C) the industry produces a level of output such that there are increasing returns to scale.
D) there are barriers to entry.
E) the industry produces a level of output such that the marginal cost to producers equals the marginal benefit to consumers.
Unlock Deck
Unlock for access to all 123 flashcards in this deck.
Unlock Deck
k this deck
34
The production possibilities boundary shows possible combinations of guns and butter that can be produced by a country. The lower diagram shows demand and supply for butter.
FIGURE 12-2
Refer to Figure 12-2. Suppose demand and supply for butter are shown by D and S, respectively. And suppose the economy is at point a) on the production possibilities boundary. Is this output of guns and butter allocatively efficient?
A) No, because the marginal value to consumers of the butter produced is greater than the marginal cost to producers.
B) No, because the marginal cost to producers of the butter produced is more than the marginal value to consumers.
C) Yes, because all points on the production possibilities boundary are allocatively efficient.
D) Yes, because the marginal cost of producing the butter equals the marginal value of consuming the butter.
E) No, because the marginal costs for guns and butter are not equated.
FIGURE 12-2Refer to Figure 12-2. Suppose demand and supply for butter are shown by D and S, respectively. And suppose the economy is at point a) on the production possibilities boundary. Is this output of guns and butter allocatively efficient?
A) No, because the marginal value to consumers of the butter produced is greater than the marginal cost to producers.
B) No, because the marginal cost to producers of the butter produced is more than the marginal value to consumers.
C) Yes, because all points on the production possibilities boundary are allocatively efficient.
D) Yes, because the marginal cost of producing the butter equals the marginal value of consuming the butter.
E) No, because the marginal costs for guns and butter are not equated.
Unlock Deck
Unlock for access to all 123 flashcards in this deck.
Unlock Deck
k this deck
35
The production possibilities boundary shows possible combinations of guns and butter that can be produced by a country. The lower diagram shows demand and supply for butter.
FIGURE 12-2
Refer to Figure 12-2. Suppose this economy is allocatively efficient at Q1 units of butter. Now suppose there is an increase in demand for butter from D to D1. After this shift in demand,
A) the supply curve will shift up to S1 and allocative efficiency will be maintained.
B) the marginal value to consumers of butter is less than the marginal cost to producers; the price of butter relative to the price of guns) rises; the economy moves to output Q 2 of butter and point c) on the PPB.
C) the marginal value to consumers of butter is greater than the marginal cost to producers; the price of butter relative to the price of guns) rises; the economy moves to output Q2 of butter and point c) on the PPB.
D) the increase in the price of butter relative to the price of guns) will cause the demand curve to shift back down to D and allocative efficiency will be maintained.
E) the price of guns relative to the price of butter) rises and the economy moves to point a) on the PPB.
FIGURE 12-2Refer to Figure 12-2. Suppose this economy is allocatively efficient at Q1 units of butter. Now suppose there is an increase in demand for butter from D to D1. After this shift in demand,
A) the supply curve will shift up to S1 and allocative efficiency will be maintained.
B) the marginal value to consumers of butter is less than the marginal cost to producers; the price of butter relative to the price of guns) rises; the economy moves to output Q 2 of butter and point c) on the PPB.
C) the marginal value to consumers of butter is greater than the marginal cost to producers; the price of butter relative to the price of guns) rises; the economy moves to output Q2 of butter and point c) on the PPB.
D) the increase in the price of butter relative to the price of guns) will cause the demand curve to shift back down to D and allocative efficiency will be maintained.
E) the price of guns relative to the price of butter) rises and the economy moves to point a) on the PPB.
Unlock Deck
Unlock for access to all 123 flashcards in this deck.
Unlock Deck
k this deck
36
Consider the efficiency of various market structures. In the absence of other market failures, allocative efficiency is achieved only under perfect competition because only this market structure results in
A) zero long-run profits.
B) P = MC.
C) complete freedom of entry and exit.
D) maximization of profits through competition.
E) productive efficiency.
A) zero long-run profits.
B) P = MC.
C) complete freedom of entry and exit.
D) maximization of profits through competition.
E) productive efficiency.
Unlock Deck
Unlock for access to all 123 flashcards in this deck.
Unlock Deck
k this deck
37
FIGURE 12-3Refer to Figure 12-3. If the diagram is depicting a perfectly competitive industry, the equilibrium price and quantity is
A) P1 and q1.
B) P1 and q2.
C) P2 and q1.
D) P2 and q2.
E) P3 and q1.
Unlock Deck
Unlock for access to all 123 flashcards in this deck.
Unlock Deck
k this deck
38
The production possibilities boundary shows possible combinations of guns and butter that can be produced by a country. The lower diagram shows demand and supply for butter.
FIGURE 12-2
Refer to Figure 12-2. Suppose demand and supply for butter are shown by D and S, respectively. And suppose the economy is at point a) on the production possibilities boundary. How can this economy move toward allocative efficiency?
A) expand the production possibilities boundary outward
B) increase the supply of guns
C) increase the demand for butter
D) produce less butter, more guns
E) produce more butter, fewer guns
FIGURE 12-2Refer to Figure 12-2. Suppose demand and supply for butter are shown by D and S, respectively. And suppose the economy is at point a) on the production possibilities boundary. How can this economy move toward allocative efficiency?
A) expand the production possibilities boundary outward
B) increase the supply of guns
C) increase the demand for butter
D) produce less butter, more guns
E) produce more butter, fewer guns
Unlock Deck
Unlock for access to all 123 flashcards in this deck.
Unlock Deck
k this deck
39
Consider the efficiency of various market structures and complete the following sentence. The larger the minimum efficient scale of firms, ceteris paribus, the
A) more likely we are to have a concentrated market and allocative inefficiency.
B) less the tendency toward monopoly inefficiency.
C) lower the advantages of large-scale production.
D) greater the number of firms comprising an industry.
E) more likely firms will display productive efficiency.
A) more likely we are to have a concentrated market and allocative inefficiency.
B) less the tendency toward monopoly inefficiency.
C) lower the advantages of large-scale production.
D) greater the number of firms comprising an industry.
E) more likely firms will display productive efficiency.
Unlock Deck
Unlock for access to all 123 flashcards in this deck.
Unlock Deck
k this deck
40
Consider three firms, A, B and C, all producing kilos of potatoes per year) in a perfectly competitive market. The diagrams below show marginal cost curves for each of the three firms.
FIGURE 12-1
Refer to Figure 12-1. Suppose each of Firms A, B, and C are producing 500 kilos of potatoes. Which of the following statements correctly describes the productive efficiency of this industry?
A) Productive efficiency would be achieved if Firm B produced all the output, since it has the lowest MC for the production of 500 kilos.
B) It is possible to reduce the total cost of the given output by reallocating production among the three firms.
C) The total output of 1500 kilos is the productively efficient output for this industry, so no reallocation is necessary.
D) It is not possible to say whether this industry is productively efficient because we do not know the market price of the product.
E) It is not possible to say whether this industry is productively efficient because we do not know the average costs for each firm.
FIGURE 12-1Refer to Figure 12-1. Suppose each of Firms A, B, and C are producing 500 kilos of potatoes. Which of the following statements correctly describes the productive efficiency of this industry?
A) Productive efficiency would be achieved if Firm B produced all the output, since it has the lowest MC for the production of 500 kilos.
B) It is possible to reduce the total cost of the given output by reallocating production among the three firms.
C) The total output of 1500 kilos is the productively efficient output for this industry, so no reallocation is necessary.
D) It is not possible to say whether this industry is productively efficient because we do not know the market price of the product.
E) It is not possible to say whether this industry is productively efficient because we do not know the average costs for each firm.
Unlock Deck
Unlock for access to all 123 flashcards in this deck.
Unlock Deck
k this deck
41
FIGURE 12-3Refer to Figure 12-3. The area representing consumer surplus in a monopoly equilibrium is outlined by
A) ACE.
B) ABE.
C) 0P4Eq2.
D) P3P4C.
E) P2P4E.
Unlock Deck
Unlock for access to all 123 flashcards in this deck.
Unlock Deck
k this deck
42
Which of the following is the result of a monopolistʹs pricing and output behaviour, as compared to a perfectly competitive outcome?
A) a reduction in producer surplus and increase in consumer surplus
B) an increase in both consumer and producer surplus
C) a reduction in both consumer and producer surplus
D) a reduction in the sum of consumer and producer surplus
E) an increase in the sum of consumer and producer surplus
A) a reduction in producer surplus and increase in consumer surplus
B) an increase in both consumer and producer surplus
C) a reduction in both consumer and producer surplus
D) a reduction in the sum of consumer and producer surplus
E) an increase in the sum of consumer and producer surplus
Unlock Deck
Unlock for access to all 123 flashcards in this deck.
Unlock Deck
k this deck
43
In general, the sum of consumer and producer surplus is maximized under the conditions of
A) perfect competition.
B) monopoly.
C) monopolistic competition.
D) oligopoly.
E) any market structure.
A) perfect competition.
B) monopoly.
C) monopolistic competition.
D) oligopoly.
E) any market structure.
Unlock Deck
Unlock for access to all 123 flashcards in this deck.
Unlock Deck
k this deck
44
The diagram below shows supply, demand, and quantity exchanged of Monday matinee movie tickets. Assume it is a perfectly competitive market.
FIGURE 12-4
Refer to Figure 12-4. Suppose a disequilibrium price of $7.50 per movie ticket is imposed on this market. The total economic surplus is now , which is than the total economic surplus generated at the allocatively efficient level of output.
A) $125; $250 less
B) $125; $125 less
C) $187.50; $62.50 less
D) $62.50; $125 less
E) $187.50; $187.50 less
FIGURE 12-4Refer to Figure 12-4. Suppose a disequilibrium price of $7.50 per movie ticket is imposed on this market. The total economic surplus is now , which is than the total economic surplus generated at the allocatively efficient level of output.
A) $125; $250 less
B) $125; $125 less
C) $187.50; $62.50 less
D) $62.50; $125 less
E) $187.50; $187.50 less
Unlock Deck
Unlock for access to all 123 flashcards in this deck.
Unlock Deck
k this deck
45
The diagram below shows supply, demand, and quantity exchanged of Monday matinee movie tickets. Assume it is a perfectly competitive market.
FIGURE 12-4
Refer to Figure 12-4. Suppose a disequilibrium price of $7.50 per movie ticket is imposed in this market. The consumer surplus becomes and the producer surplus becomes .
A) $0; $62.50
B) $2.50; $7.50
C) $62.50; $125
D) $62.50; $250
E) $31.25; $156.25
FIGURE 12-4Refer to Figure 12-4. Suppose a disequilibrium price of $7.50 per movie ticket is imposed in this market. The consumer surplus becomes and the producer surplus becomes .
A) $0; $62.50
B) $2.50; $7.50
C) $62.50; $125
D) $62.50; $250
E) $31.25; $156.25
Unlock Deck
Unlock for access to all 123 flashcards in this deck.
Unlock Deck
k this deck
46
The diagram below shows supply, demand, and quantity exchanged of Monday matinee movie tickets. Assume it is a perfectly competitive market.
FIGURE 12-4
Refer to Figure 12-4. If a disequilibrium price of $7.50 per movie ticket were imposed on this market, this market would not be allocatively efficient because
1) the sum of consumer and producer surplus would not be maximized;
2) the marginal benefit to consumers of the last movie consumed would be greater than the marginal cost to the seller;
3) the marginal cost to the seller of the last movie consumed would be more than the marginal benefit to consumers.
A) 1 only
B) 2 only
C) 3 only
D) 1 and 2
E) 2 and 3
FIGURE 12-4Refer to Figure 12-4. If a disequilibrium price of $7.50 per movie ticket were imposed on this market, this market would not be allocatively efficient because
1) the sum of consumer and producer surplus would not be maximized;
2) the marginal benefit to consumers of the last movie consumed would be greater than the marginal cost to the seller;
3) the marginal cost to the seller of the last movie consumed would be more than the marginal benefit to consumers.
A) 1 only
B) 2 only
C) 3 only
D) 1 and 2
E) 2 and 3
Unlock Deck
Unlock for access to all 123 flashcards in this deck.
Unlock Deck
k this deck
47
The diagram below shows supply, demand, and quantity exchanged of Monday matinee movie tickets. Assume it is a perfectly competitive market.
FIGURE 12-4
Refer to Figure 12-4. What is the value of the consumer surplus generated in this market at the allocatively efficient level of output?
A) $0
B) $5
C) $10
D) $125
E) $250
FIGURE 12-4Refer to Figure 12-4. What is the value of the consumer surplus generated in this market at the allocatively efficient level of output?
A) $0
B) $5
C) $10
D) $125
E) $250
Unlock Deck
Unlock for access to all 123 flashcards in this deck.
Unlock Deck
k this deck
48
FIGURE 12-3Refer to Figure 12-3. The area representing consumer surplus in a perfectly competitive equilibrium is outlined by
A) ACE.
B) ABE.
C) 0P4Eq2.
D) P3P4C.
E) P2P4E.
Unlock Deck
Unlock for access to all 123 flashcards in this deck.
Unlock Deck
k this deck
49
FIGURE 12-3Refer to Figure 12-3. Comparing the monopoly equilibrium to the perfectly competitive equilibrium, the area representing the gain in producer surplus due to monopoly is outlined by
A) P1P3CA less ACE.
B) P2P3CB less ABE.
C) P0P3CA less ACE
D) P3P4 less ABE.
E) P2P4E.
Unlock Deck
Unlock for access to all 123 flashcards in this deck.
Unlock Deck
k this deck
50
When comparing a monopoly equilibrium to a competitive market equilibrium, the consumer suffers two types of losses. They are
A) the deadweight loss due to the output that is produced beyond the competitive level, and the transfer of consumer surplus to the monopolist .
B) the loss of both consumer surplus and producer surplus.
C) a loss of consumer surplus due to the output that is not produced, and the transfer of consumer surplus to the monopolist.
D) the deadweight loss due to the output that is produced and the reduced incentive for innovation by the monopolist.
E) the deadweight loss due to the output that is not produced and the transfer of producer surplus to the monopolist.
Unlock Deck
Unlock for access to all 123 flashcards in this deck.
Unlock Deck
k this deck
51
FIGURE 12-3Refer to Figure 12-3. Comparing the perfectly competitive equilibrium to the monopoly equilibrium, the reduction in consumer surplus due to monopoly is outlined by
A) P2EP4.
B) P2ECP3.
C) BCE.
D) q1CEq2.
E) P2P3E.
Unlock Deck
Unlock for access to all 123 flashcards in this deck.
Unlock Deck
k this deck
52
The diagram below shows supply, demand, and quantity exchanged of Monday matinee movie tickets. Assume it is a perfectly competitive market.
FIGURE 12-4
Refer to Figure 12-4. What is the total economic surplus generated in this market at the allocatively efficient level of output?
A) $5
B) $10
C) $125
D) $250
E) $500
FIGURE 12-4Refer to Figure 12-4. What is the total economic surplus generated in this market at the allocatively efficient level of output?
A) $5
B) $10
C) $125
D) $250
E) $500
Unlock Deck
Unlock for access to all 123 flashcards in this deck.
Unlock Deck
k this deck
53
The diagram below shows supply, demand, and quantity exchanged of Monday matinee movie tickets. Assume it is a perfectly competitive market.
FIGURE 12-4
Refer to Figure 12-4. What is the value of the producer surplus generated in this market at the free-market equilibrium?
A) $0
B) $5
C) $10
D) $125
E) $250
FIGURE 12-4Refer to Figure 12-4. What is the value of the producer surplus generated in this market at the free-market equilibrium?
A) $0
B) $5
C) $10
D) $125
E) $250
Unlock Deck
Unlock for access to all 123 flashcards in this deck.
Unlock Deck
k this deck
54
The deadweight loss of monopoly is
A) its fixed cost.
B) any negative profit due to cyclical decreases in demand.
C) the loss of economic surplus due to the low monopoly output level.
D) the cost of maintaining effective barriers to entry.
E) the extra administrative costs of operating a large firm.
A) its fixed cost.
B) any negative profit due to cyclical decreases in demand.
C) the loss of economic surplus due to the low monopoly output level.
D) the cost of maintaining effective barriers to entry.
E) the extra administrative costs of operating a large firm.
Unlock Deck
Unlock for access to all 123 flashcards in this deck.
Unlock Deck
k this deck
55
Suppose we compare two monopolists with identical cost and demand conditions. Monopolist A charges a single price. Monopolist B engages in price discrimination, charging a different price for different units of the product. Which one of the following statements is correct?
A) B will produce less than A, resulting in a larger deadweight loss.
B) B will generally produce more than A, resulting in less deadweight loss.
C) A will produce less than B, resulting in smaller deadweight loss.
D) A will produce more than B, and there is no deadweight loss.
E) A and B will both produce the same amount.
Unlock Deck
Unlock for access to all 123 flashcards in this deck.
Unlock Deck
k this deck
56
FIGURE 12-3Refer to Figure 12-3. Comparing the perfectly competitive equilibrium to the monopoly equilibrium, the deadweight loss of monopoly is given by
A) q1BEq2.
B) AP4E.
C) q1CEq2.
D) ACE.
E) P2P4E.
Unlock Deck
Unlock for access to all 123 flashcards in this deck.
Unlock Deck
k this deck
57
The diagram below shows supply, demand, and quantity exchanged of Monday matinee movie tickets. Assume it is a perfectly competitive market.
FIGURE 12-4
Refer to Figure 12-4. What is the total revenue received by the sellers of this product at the allocatively efficient level of output?
A) $5
B) $125
C) $250
D) $375
E) $500
FIGURE 12-4Refer to Figure 12-4. What is the total revenue received by the sellers of this product at the allocatively efficient level of output?
A) $5
B) $125
C) $250
D) $375
E) $500
Unlock Deck
Unlock for access to all 123 flashcards in this deck.
Unlock Deck
k this deck
58
Allocative efficiency occurs when
A) producer surplus is maximized.
B) consumer surplus is maximized.
C) the sum of consumer and producer surplus is maximized.
D) the economy achieves the frontier of the production possibilities boundary.
E) deadweight loss is achieved.
A) producer surplus is maximized.
B) consumer surplus is maximized.
C) the sum of consumer and producer surplus is maximized.
D) the economy achieves the frontier of the production possibilities boundary.
E) deadweight loss is achieved.
Unlock Deck
Unlock for access to all 123 flashcards in this deck.
Unlock Deck
k this deck
59
FIGURE 12-3Refer to Figure 12-3. Comparing the monopoly equilibrium to the perfectly competitive equilibrium, the area
P2P3CB represents
A) the dead-weight loss of monopoly.
B) a redistribution of income from consumers to the monopolist.
C) the net gain in the monopolistʹs profits.
D) the net loss in the monopolistʹs profits.
E) a redistribution of income from the monopolist to the consumer.
Unlock Deck
Unlock for access to all 123 flashcards in this deck.
Unlock Deck
k this deck
60
FIGURE 12-3Refer to Figure 12-3. The area representing producer surplus at the monopoly equilibrium is outlined by
A) 0P0Aq1.
B) P0P2BA.
C) P0AP1.
D) P0P3CA.
E) 0P3Cq1.
Unlock Deck
Unlock for access to all 123 flashcards in this deck.
Unlock Deck
k this deck
61
Consider a natural monopoly that has declining LRAC over the entire range of the market demand curve. If it is regulated and required to charge a price that is equal to MC, the resulting level of output is
A) allocatively efficient, and profit is earned.
B) allocatively efficient, but the firm must be paid a subsidy or it will eventually go out of business.
C) less than the allocatively efficient level, and profit is zero.
D) less than the allocatively efficient level, but losses occur.
E) greater than the allocatively efficient level, but losses occur.
Unlock Deck
Unlock for access to all 123 flashcards in this deck.
Unlock Deck
k this deck
62
The diagram below shows the demand and supply curves in a perfectly competitive market.
FIGURE 12-5
Refer to Figure 12-5. If output in this market were Q3, and the price was still equal to its free-market level, the loss in producer surplus relative to the competitive equilibrium would be illustrated by area
A) 1.
B) 2.
C) 3.
D) 4.
E) 3 + 4.
FIGURE 12-5Refer to Figure 12-5. If output in this market were Q3, and the price was still equal to its free-market level, the loss in producer surplus relative to the competitive equilibrium would be illustrated by area
A) 1.
B) 2.
C) 3.
D) 4.
E) 3 + 4.
Unlock Deck
Unlock for access to all 123 flashcards in this deck.
Unlock Deck
k this deck
63
The diagram below shows the demand and supply curves in a perfectly competitive market.
FIGURE 12-5
Refer to Figure 12-5. If output in this market were Q3, the loss in total economic surplus relative to the competitive equilibrium would be illustrated by area
A) 1.
B) 2.
C) 3.
D) 4.
E) 3 + 4.
FIGURE 12-5Refer to Figure 12-5. If output in this market were Q3, the loss in total economic surplus relative to the competitive equilibrium would be illustrated by area
A) 1.
B) 2.
C) 3.
D) 4.
E) 3 + 4.
Unlock Deck
Unlock for access to all 123 flashcards in this deck.
Unlock Deck
k this deck
64
The diagram below shows the demand and supply curves in a perfectly competitive market.
FIGURE 12-5
Refer to Figure 12-5. At the free-market equilibrium, consumer surplus is represented by the area
A) P2P3E.
B) P1P2E.
C) P1P3E.
D) 1 + 2.
E) 1 + 2 + 3 + 4.
FIGURE 12-5Refer to Figure 12-5. At the free-market equilibrium, consumer surplus is represented by the area
A) P2P3E.
B) P1P2E.
C) P1P3E.
D) 1 + 2.
E) 1 + 2 + 3 + 4.
Unlock Deck
Unlock for access to all 123 flashcards in this deck.
Unlock Deck
k this deck
65
In general, which of the following statements guides policymakers with respect to a natural monopoly? The firm
A) should be broken up into a large number of competitive firms.
B) should be taken over by government and run as a crown corporation.
C) is the best way to produce a given product and should be left alone.
D) generally needs to be regulated in order to reduce allocative inefficiency.
E) will not achieve productive efficiency without regulation.
Unlock Deck
Unlock for access to all 123 flashcards in this deck.
Unlock Deck
k this deck
66
The diagram below shows the demand and supply curves in a perfectly competitive market.
FIGURE 12-5
Refer to Figure 12-5. In the free-market equilibrium, producer plus consumer surplus is maximized and is illustrated by the area
A) P3P2E.
B) P1P2E.
C) P1P3E.
D) 1 + 2.
E) 1 + 2 + 3 + 4.
FIGURE 12-5Refer to Figure 12-5. In the free-market equilibrium, producer plus consumer surplus is maximized and is illustrated by the area
A) P3P2E.
B) P1P2E.
C) P1P3E.
D) 1 + 2.
E) 1 + 2 + 3 + 4.
Unlock Deck
Unlock for access to all 123 flashcards in this deck.
Unlock Deck
k this deck
67
Which of the following is the definition of consumer surplus?
A) the difference between the value that consumers place on a good and the payment they make to buy the good, summed over the quantity consumed
B) the total value that consumers place on the quantity consumed of some good
C) the quantity consumed in excess of the allocatively efficient amount
D) the value that consumers place on the last unit consumed of a good
E) the marginal value that consumers place on the last unit consumed of a good
Unlock Deck
Unlock for access to all 123 flashcards in this deck.
Unlock Deck
k this deck
68
The diagram below shows the demand and supply curves in a perfectly competitive market.
FIGURE 12-5
Refer to Figure 12-5. If output in this market were Q1, but the price was still at its free-market level, the loss in consumer surplus relative to the competitive equilibrium would be illustrated by area
A) P3P2E.
B) P1P3E.
C) 1.
D) 2.
E) 1 + 2.
FIGURE 12-5Refer to Figure 12-5. If output in this market were Q1, but the price was still at its free-market level, the loss in consumer surplus relative to the competitive equilibrium would be illustrated by area
A) P3P2E.
B) P1P3E.
C) 1.
D) 2.
E) 1 + 2.
Unlock Deck
Unlock for access to all 123 flashcards in this deck.
Unlock Deck
k this deck
69
One method of regulating a natural monopoly is known as average -cost pricing. Using this method, the regulator requires that the price be set equal to
A) internal cost.
B) marginal cost.
C) average variable cost.
D) long-run average cost.
E) average fixed cost.
A) internal cost.
B) marginal cost.
C) average variable cost.
D) long-run average cost.
E) average fixed cost.
Unlock Deck
Unlock for access to all 123 flashcards in this deck.
Unlock Deck
k this deck
70
In which of the following situations would a natural monopoly exist?
A) a firm has a government charter to be the sole producer of some good
B) a firm is able to operate at the minimum point of its long-run average total cost curve
C) a firm produces a product essential to national security
D) only one firm is supplying a natural resource
E) one firm can most efficiently supply the entire market demand
Unlock Deck
Unlock for access to all 123 flashcards in this deck.
Unlock Deck
k this deck
71
Consider the case of a natural monopoly with falling long -run average costs. If regulation sets the price equal to marginal cost, then
A) the firm would operate at a loss and eventually go out of business.
B) shortages would result.
C) the demand curve would shift to the left.
D) the firm would earn economic profits.
E) the outcome would be allocatively inefficient.
A) the firm would operate at a loss and eventually go out of business.
B) shortages would result.
C) the demand curve would shift to the left.
D) the firm would earn economic profits.
E) the outcome would be allocatively inefficient.
Unlock Deck
Unlock for access to all 123 flashcards in this deck.
Unlock Deck
k this deck
72
The diagram below shows the demand and supply curves in a perfectly competitive market.
FIGURE 12-5
Refer to Figure 12-5. If output in this market were Q1, and the price were still equal to its free-market level, the loss in producer surplus relative to the competitive equilibrium would be illustrated by area
A) P3P2E.
B) P1P3E.
C) 1.
D) 2.
E) 1 + 2.
FIGURE 12-5Refer to Figure 12-5. If output in this market were Q1, and the price were still equal to its free-market level, the loss in producer surplus relative to the competitive equilibrium would be illustrated by area
A) P3P2E.
B) P1P3E.
C) 1.
D) 2.
E) 1 + 2.
Unlock Deck
Unlock for access to all 123 flashcards in this deck.
Unlock Deck
k this deck
73
The diagram below shows the demand and supply curves in a perfectly competitive market.
FIGURE 12-5
Refer to Figure 12-5. Allocative efficiency occurs
A) at output level Q3.
B) at output level Q1.
C) at price P1 and output Q3.
D) at price P2 and output Q2.
E) where the areas 1, 2, 3, and 4 are maximized.
FIGURE 12-5Refer to Figure 12-5. Allocative efficiency occurs
A) at output level Q3.
B) at output level Q1.
C) at price P1 and output Q3.
D) at price P2 and output Q2.
E) where the areas 1, 2, 3, and 4 are maximized.
Unlock Deck
Unlock for access to all 123 flashcards in this deck.
Unlock Deck
k this deck
74
The diagram below shows the demand and supply curves in a perfectly competitive market.
FIGURE 12-5
Refer to Figure 12-5. If output in this market were Q1, the total loss in economic surplus relative to the competitive equilibrium would be illustrated by area
A) P1P3E.
B) 1.
C) 2.
D) 1 + 2.
E) 1 + 2 + 3 + 4.
FIGURE 12-5Refer to Figure 12-5. If output in this market were Q1, the total loss in economic surplus relative to the competitive equilibrium would be illustrated by area
A) P1P3E.
B) 1.
C) 2.
D) 1 + 2.
E) 1 + 2 + 3 + 4.
Unlock Deck
Unlock for access to all 123 flashcards in this deck.
Unlock Deck
k this deck
75
The diagram below shows the demand and supply curves in a perfectly competitive market.
FIGURE 12-5
Refer to Figure 12-5. In the free-market equilibrium, producer surplus is shown by the area
A) P3P2E.
B) P1P2E.
C) P1P3E.
D) 1 +2.
E) 1 + 2 + 3 + 4.
FIGURE 12-5Refer to Figure 12-5. In the free-market equilibrium, producer surplus is shown by the area
A) P3P2E.
B) P1P2E.
C) P1P3E.
D) 1 +2.
E) 1 + 2 + 3 + 4.
Unlock Deck
Unlock for access to all 123 flashcards in this deck.
Unlock Deck
k this deck
76
Which of the following is the definition of producer surplus?
A) the total revenue received by the producer for a good minus the total cost of producing that good
B) the price of a good minus the marginal cost of producing it, summed over the quantity produced
C) the revenue received for a good, minus the cost of producing it
D) the price of a good minus the cost of producing it
E) quantity produced in excess of the allocatively efficient amount
Unlock Deck
Unlock for access to all 123 flashcards in this deck.
Unlock Deck
k this deck
77
Which of the following is an example of an industry that succeeds in formally restricting entry, thereby maintaining prices above competitive levels?
A) transport trucking
B) beef cattle ranching
C) window washing
D) dentistry
E) book publishing
A) transport trucking
B) beef cattle ranching
C) window washing
D) dentistry
E) book publishing
Unlock Deck
Unlock for access to all 123 flashcards in this deck.
Unlock Deck
k this deck
78
Choose the statement that best describes the dilemma facing the regulator of a natural monopoly.
A) Marginal-cost pricing leads to profit or losses; average-cost pricing results in allocative inefficiency.
B) Marginal-cost pricing will result in allocative inefficiency; average-cost pricing leads to profits or losses.
C) Marginal-cost pricing will result in productive and allocative inefficiency; average-cost pricing will not.
D) Both kinds of regulation have the same implications for allocative efficiency.
E) There is no dilemma.
Unlock Deck
Unlock for access to all 123 flashcards in this deck.
Unlock Deck
k this deck
79
The diagram below shows the demand and supply curves in a perfectly competitive market.
FIGURE 12-5
Refer to Figure 12-5. If output in this market were Q3, and the price were still P2, the loss in consumer surplus relative to the competitive equilibrium would be illustrated by area
A) 1.
B) 2.
C) 3.
D) 4.
E) 3 + 4.
FIGURE 12-5Refer to Figure 12-5. If output in this market were Q3, and the price were still P2, the loss in consumer surplus relative to the competitive equilibrium would be illustrated by area
A) 1.
B) 2.
C) 3.
D) 4.
E) 3 + 4.
Unlock Deck
Unlock for access to all 123 flashcards in this deck.
Unlock Deck
k this deck
80
Consider a public utility that is a natural monopoly with falling long-run average costs. If a regulatory agency ordered this firm to price all of its output at marginal cost, then the firm
A) would lose money unless it is subsidized.
B) could incur profits or losses depending on the position of the demand curve and the LRAC curve.
C) would earn profits since the demand curve is perfectly inelastic.
D) would incur losses since the demand curve is perfectly elastic.
E) would have to shut down.
Unlock Deck
Unlock for access to all 123 flashcards in this deck.
Unlock Deck
k this deck
Unlock Deck
Unlock for access to all 123 flashcards in this deck.


