Deck 11: Expenditure Multipliers
Full screen (f)
Question
Question
Use the figure below to answer the following questions.
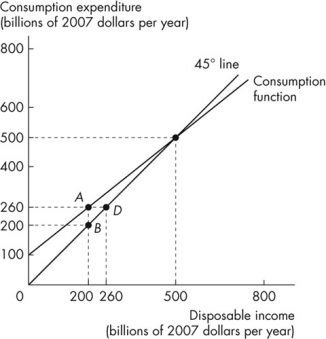 Figure 11.1.1
This figure describes the relationship between consumption expenditure and disposable income for an economy.
Refer to Figure 11.1.1.The marginal propensity to consume for this economy is
A)0.5.
B)0.2.
C)0.8.
D)1.
E)0.6.
Figure 11.1.1This figure describes the relationship between consumption expenditure and disposable income for an economy.
Refer to Figure 11.1.1.The marginal propensity to consume for this economy is
A)0.5.
B)0.2.
C)0.8.
D)1.
E)0.6.
Question
Use the figure below to answer the following questions.
Figure 11.1.1
This figure describes the relationship between consumption expenditure and disposable income for an economy.
Refer to Figure 11.1.1.When disposable income is $200 billion,
A)households are saving an amount equal to line segment AB.
B)households are dissaving an amount equal to line segment AB.
C)households are consuming less than $200 billion.
D)businesses are spending more than households because the consumption function lies above the 45° line.
E)saving is greater than consumption expenditure.
Figure 11.1.1This figure describes the relationship between consumption expenditure and disposable income for an economy.
Refer to Figure 11.1.1.When disposable income is $200 billion,
A)households are saving an amount equal to line segment AB.
B)households are dissaving an amount equal to line segment AB.
C)households are consuming less than $200 billion.
D)businesses are spending more than households because the consumption function lies above the 45° line.
E)saving is greater than consumption expenditure.
Question
Question
Question
Question
Use the figure below to answer the following questions.
Figure 11.1.1
This figure describes the relationship between consumption expenditure and disposable income for an economy.
Refer to Figure 11.1.1.When disposable income is equal to $200 billion, saving is
A)$60 billion.
B)$200 billion.
C)$150 billion.
D)zero.
E)- $60 billion.
Figure 11.1.1This figure describes the relationship between consumption expenditure and disposable income for an economy.
Refer to Figure 11.1.1.When disposable income is equal to $200 billion, saving is
A)$60 billion.
B)$200 billion.
C)$150 billion.
D)zero.
E)- $60 billion.
Question
Question
Question
Question
Question
Question
Use the figure below to answer the following questions.
Figure 11.1.1
This figure describes the relationship between consumption expenditure and disposable income for an economy.
Refer to Figure 11.1.1.When disposable income is $500 billion, saving is equal to
A)$20 billion.
B)consumption expenditure.
C)zero.
D)$40 billion.
E)disposable income.
Figure 11.1.1This figure describes the relationship between consumption expenditure and disposable income for an economy.
Refer to Figure 11.1.1.When disposable income is $500 billion, saving is equal to
A)$20 billion.
B)consumption expenditure.
C)zero.
D)$40 billion.
E)disposable income.
Question
Question
Question
Question
Question
Use the figure below to answer the following questions.
Figure 11.1.1
This figure describes the relationship between consumption expenditure and disposable income for an economy.
Refer to Figure 11.1.1.Consumption and disposable income are equal
A)when disposable income is greater than or equal to $500 billion.
B)when saving equals $40 billion and disposable income equals $540 billion.
C)when disposable income is $600 billion.
D)at all points along the consumption function.
E)when disposable income is $500 billion.
Figure 11.1.1This figure describes the relationship between consumption expenditure and disposable income for an economy.
Refer to Figure 11.1.1.Consumption and disposable income are equal
A)when disposable income is greater than or equal to $500 billion.
B)when saving equals $40 billion and disposable income equals $540 billion.
C)when disposable income is $600 billion.
D)at all points along the consumption function.
E)when disposable income is $500 billion.
Question
Question
Question
Use the table below to answer the following questions.
Table 11.1.1
The following table shows the relationship between consumption expenditure C) and disposable income YD) for a hypothetical economy.
Refer to Table 11.1.1.The marginal propensity to consume is
A)0.75.
B)increasing as YD increases.
C)equal to 1 when YD equals $600.
D)0.25.
E)1.33.
Table 11.1.1
The following table shows the relationship between consumption expenditure C) and disposable income YD) for a hypothetical economy.
Refer to Table 11.1.1.The marginal propensity to consume is
A)0.75.
B)increasing as YD increases.
C)equal to 1 when YD equals $600.
D)0.25.
E)1.33.
Question
Use the table below to answer the following questions.
Table 11.1.2

Refer to Table 11.1.2.Saving equals $100 when disposable income is
A)$575.
B)$525.
C)$625.
D)$475.
E)$550.
Table 11.1.2
Refer to Table 11.1.2.Saving equals $100 when disposable income is
A)$575.
B)$525.
C)$625.
D)$475.
E)$550.
Question
Use the table below to answer the following questions.
Table 11.1.3

In Table 11.1.3, at which of the following values of disposable income is there positive saving?
A)$200
B)all values over $300
C)$100
D)zero
E)all values under $300
Table 11.1.3
In Table 11.1.3, at which of the following values of disposable income is there positive saving?
A)$200
B)all values over $300
C)$100
D)zero
E)all values under $300
Question
Use the figure below to answer the following questions.
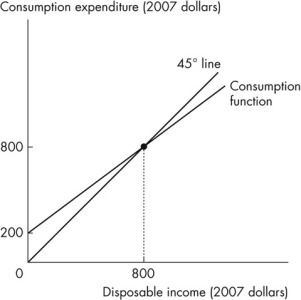 Figure 11.1.2
The slope of the consumption function is
A)zero.
B)equal to the slope of the 45° line.
C)less than the slope of the 45° line.
D)one.
E)greater than the slope of the 45° line.
Figure 11.1.2The slope of the consumption function is
A)zero.
B)equal to the slope of the 45° line.
C)less than the slope of the 45° line.
D)one.
E)greater than the slope of the 45° line.
Question
Question
Question
Use the table below to answer the following questions.
Table 11.1.3
Refer to Table 11.1.3.Autonomous consumption is equal to
A)$100.
B)$260.
C)$65.
D)$0.
E)$400.
Table 11.1.3
Refer to Table 11.1.3.Autonomous consumption is equal to
A)$100.
B)$260.
C)$65.
D)$0.
E)$400.
Question
Use the table below to answer the following questions.
Table 11.1.2
Refer to Table 11.1.2.What is the value of the marginal propensity to save?
A)0.27
B)0.25
C)0.67
D)1.33
E)0.33
Table 11.1.2
Refer to Table 11.1.2.What is the value of the marginal propensity to save?
A)0.27
B)0.25
C)0.67
D)1.33
E)0.33
Question
Use the figure below to answer the following questions.
Figure 11.1.2
Refer to Figure 11.1.2.Autonomous consumption is
A)zero.
B)$200.
C)$600.
D)- $200.
E)$800.
Figure 11.1.2Refer to Figure 11.1.2.Autonomous consumption is
A)zero.
B)$200.
C)$600.
D)- $200.
E)$800.
Question
Use the table below to answer the following questions.
Table 11.1.1
The following table shows the relationship between consumption expenditure C) and disposable income YD) for a hypothetical economy.
Refer to Table 11.1.1.Based on the information in the table, if YD is zero, then
A)consumption is zero.
B)saving is zero.
C)consumption is $100.
D)consumption is $150.
E)consumption is - $150.
Question
Question
Use the table below to answer the following questions.
Table 11.1.2
Refer to Table 11.1.2.When saving is zero, what is the level of disposable income?
A)$475
B)$625
C)$550
D)$325
E)$400
Table 11.1.2
Refer to Table 11.1.2.When saving is zero, what is the level of disposable income?
A)$475
B)$625
C)$550
D)$325
E)$400
Question
Use the table below to answer the following questions.
Table 11.1.1
The following table shows the relationship between consumption expenditure C) and disposable income YD) for a hypothetical economy.
Refer to Table 11.1.1.The marginal propensity to save is
A)0.75.
B)4.
C)equal to zero when YD equals $600.
D)0.25.
E)decreasing as YD increases.
Table 11.1.1
The following table shows the relationship between consumption expenditure C) and disposable income YD) for a hypothetical economy.
Refer to Table 11.1.1.The marginal propensity to save is
A)0.75.
B)4.
C)equal to zero when YD equals $600.
D)0.25.
E)decreasing as YD increases.
Question
Use the table below to answer the following questions.
Table 11.1.2
Refer to Table 11.1.2.What is the value of the marginal propensity to consume?
A)0.34
B)0.25
C)1.33
D)0.67
E)0.75
Table 11.1.2
Refer to Table 11.1.2.What is the value of the marginal propensity to consume?
A)0.34
B)0.25
C)1.33
D)0.67
E)0.75
Question
Use the table below to answer the following questions.
Table 11.1.3
Refer to Table 11.1.3.The marginal propensity to consume is
A)1.54.
B)0.35.
C)1.65.
D)1.15.
E)0.65.
Table 11.1.3
Refer to Table 11.1.3.The marginal propensity to consume is
A)1.54.
B)0.35.
C)1.65.
D)1.15.
E)0.65.
Question
Question
Use the table below to answer the following questions.
Table 11.1.1
The following table shows the relationship between consumption expenditure C) and disposable income YD) for a hypothetical economy.
Refer to Table 11.1.1.Using the information given in the table, saving is $125 when YD equals
A)$1,300.
B)$1,000.
C)$900.
D)$1,200.
E)$1,100.
Table 11.1.1
The following table shows the relationship between consumption expenditure C) and disposable income YD) for a hypothetical economy.
Refer to Table 11.1.1.Using the information given in the table, saving is $125 when YD equals
A)$1,300.
B)$1,000.
C)$900.
D)$1,200.
E)$1,100.
Question
Question
Use the table below to answer the following questions.
Table 11.1.1
The following table shows the relationship between consumption expenditure C) and disposable income YD) for a hypothetical economy.
Refer to Table 11.1.1.If YD is $400, then saving is
A)$100.
B)- $125.
C)- $50.
D)zero.
E)$50.
Table 11.1.1
The following table shows the relationship between consumption expenditure C) and disposable income YD) for a hypothetical economy.
Refer to Table 11.1.1.If YD is $400, then saving is
A)$100.
B)- $125.
C)- $50.
D)zero.
E)$50.
Question
Use the figure below to answer the following questions.
Figure 11.1.2
Refer to Figure 11.1.2.The marginal propensity to consume is
A)0.75.
B)0.2.
C)0.25.
D)0.8.
E)800.
Figure 11.1.2Refer to Figure 11.1.2.The marginal propensity to consume is
A)0.75.
B)0.2.
C)0.25.
D)0.8.
E)800.
Question
Question
Question
Question
Use the figure below to answer the following questions.
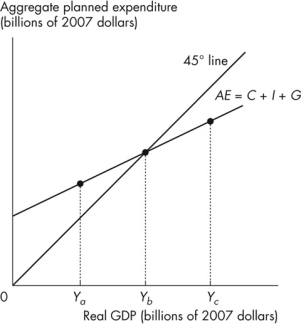 Figure 11.2.1
There are no exports or imports in this economy.
Refer to Figure 11.2.1.Equilibrium real GDP
A)is decreasing.
B)is equal to Yb.
C)is equal to Ya.
D)is equal to Yc.
E)can be any of Ya, Yb, or Yc depending on what is happening to inventories.
Figure 11.2.1There are no exports or imports in this economy.
Refer to Figure 11.2.1.Equilibrium real GDP
A)is decreasing.
B)is equal to Yb.
C)is equal to Ya.
D)is equal to Yc.
E)can be any of Ya, Yb, or Yc depending on what is happening to inventories.
Question
Use the figure below to answer the following questions.
Figure 11.2.1
There are no exports or imports in this economy.
Refer to Figure 11.2.1.When real GDP is equal to Yb, then aggregate planned expenditure is
A)less than real GDP, and real GDP decreases.
B)greater than real GDP, and real GDP increases.
C)equal to real GDP, and real GDP neither increases nor decreases.
D)greater than real GDP, and real GDP decreases.
E)less than real GDP, and real GDP increases.
Figure 11.2.1There are no exports or imports in this economy.
Refer to Figure 11.2.1.When real GDP is equal to Yb, then aggregate planned expenditure is
A)less than real GDP, and real GDP decreases.
B)greater than real GDP, and real GDP increases.
C)equal to real GDP, and real GDP neither increases nor decreases.
D)greater than real GDP, and real GDP decreases.
E)less than real GDP, and real GDP increases.
Question
Question
Use the figure below to answer the following questions.
Figure 11.2.1
There are no exports or imports in this economy.
Refer to Figure 11.2.1.When real GDP is equal to Yc, then
A)real GDP increases.
B)actual expenditure is less than planned expenditure.
C)actual expenditure is greater than planned expenditure.
D)planned expenditure is equal to actual expenditure.
E)the economy is in equilibrium.
Figure 11.2.1There are no exports or imports in this economy.
Refer to Figure 11.2.1.When real GDP is equal to Yc, then
A)real GDP increases.
B)actual expenditure is less than planned expenditure.
C)actual expenditure is greater than planned expenditure.
D)planned expenditure is equal to actual expenditure.
E)the economy is in equilibrium.
Question
Question
Question
Question
Question
Use the figure below to answer the following questions.
Figure 11.2.1
There are no exports or imports in this economy.
Refer to Figure 11.2.1.When real GDP is equal to Ya, then
A)the economy is in equilibrium.
B)real GDP decreases.
C)actual expenditure is greater than planned expenditure.
D)planned expenditure is equal to actual expenditure.
E)actual expenditure is less than planned expenditure.
Figure 11.2.1There are no exports or imports in this economy.
Refer to Figure 11.2.1.When real GDP is equal to Ya, then
A)the economy is in equilibrium.
B)real GDP decreases.
C)actual expenditure is greater than planned expenditure.
D)planned expenditure is equal to actual expenditure.
E)actual expenditure is less than planned expenditure.
Question
Question
Use the figure below to answer the following questions.
Figure 11.2.1
There are no exports or imports in this economy.
Refer to Figure 11.2.1.When real GDP is equal to Yb, then
A)real GDP increases.
B)real GDP decreases.
C)actual expenditure is less than planned expenditure.
D)actual expenditure is greater than planned expenditure.
E)planned expenditure is equal to actual expenditure.
Figure 11.2.1There are no exports or imports in this economy.
Refer to Figure 11.2.1.When real GDP is equal to Yb, then
A)real GDP increases.
B)real GDP decreases.
C)actual expenditure is less than planned expenditure.
D)actual expenditure is greater than planned expenditure.
E)planned expenditure is equal to actual expenditure.
Question
Question
Question
Question
Question
Question
Use the figure below to answer the following questions.
Figure 11.2.1
There are no exports or imports in this economy.
Refer to Figure 11.2.1.When real GDP is equal to Ya, then aggregate planned expenditure
A)exceeds real GDP, and real GDP increases.
B)exceeds real GDP, and real GDP decreases.
C)is less than real GDP, and real GDP decreases.
D)is equal to real GDP, and real GDP neither increases nor decreases.
E)is less than real GDP, and real GDP increases.
Figure 11.2.1There are no exports or imports in this economy.
Refer to Figure 11.2.1.When real GDP is equal to Ya, then aggregate planned expenditure
A)exceeds real GDP, and real GDP increases.
B)exceeds real GDP, and real GDP decreases.
C)is less than real GDP, and real GDP decreases.
D)is equal to real GDP, and real GDP neither increases nor decreases.
E)is less than real GDP, and real GDP increases.
Question
Question
Question
Use the figure below to answer the following questions.
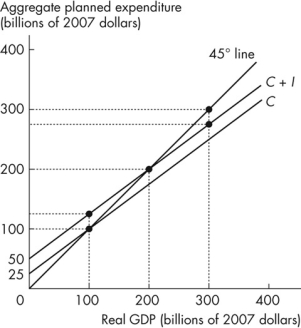 Figure 11.2.2
The economy depicted does not engage in international trade and has no government.Planned aggregate expenditure AE) is equal to the sum of consumption expenditure C) and investment I).
If there is an unplanned decrease in inventories, aggregate planned expenditure is
A)less than real GDP, and firms increase production.
B)greater than real GDP, and firms decrease production.
C)greater than real GDP, and firms increase production.
D)less than real GDP, and firms decrease production.
E)greater than real GDP, and firms increase investment.
Figure 11.2.2The economy depicted does not engage in international trade and has no government.Planned aggregate expenditure AE) is equal to the sum of consumption expenditure C) and investment I).
If there is an unplanned decrease in inventories, aggregate planned expenditure is
A)less than real GDP, and firms increase production.
B)greater than real GDP, and firms decrease production.
C)greater than real GDP, and firms increase production.
D)less than real GDP, and firms decrease production.
E)greater than real GDP, and firms increase investment.
Question
Question
Use the figure below to answer the following questions.
Figure 11.2.1
There are no exports or imports in this economy.
Refer to Figure 11.2.1.When real GDP is equal to Yc, then aggregate planned expenditure is
A)greater than real GDP, and real GDP decreases.
B)less than real GDP, and real GDP decreases.
C)equal to real GDP, and real GDP neither increases nor decreases.
D)less than real GDP, and real GDP increases.
E)greater than real GDP, and real GDP increases.
Figure 11.2.1There are no exports or imports in this economy.
Refer to Figure 11.2.1.When real GDP is equal to Yc, then aggregate planned expenditure is
A)greater than real GDP, and real GDP decreases.
B)less than real GDP, and real GDP decreases.
C)equal to real GDP, and real GDP neither increases nor decreases.
D)less than real GDP, and real GDP increases.
E)greater than real GDP, and real GDP increases.
Question
Use the figure below to answer the following questions.
Figure 11.2.2
The economy depicted does not engage in international trade and has no government.Planned aggregate expenditure AE) is equal to the sum of consumption expenditure C) and investment I).
Refer to Figure 11.2.2.Investment is
A)$100 billion.
B)$25 billion.
C)$75 billion.
D)$50 billion.
E)increasing as real GDP increases.
Figure 11.2.2The economy depicted does not engage in international trade and has no government.Planned aggregate expenditure AE) is equal to the sum of consumption expenditure C) and investment I).
Refer to Figure 11.2.2.Investment is
A)$100 billion.
B)$25 billion.
C)$75 billion.
D)$50 billion.
E)increasing as real GDP increases.
Question
Question
Use the figure below to answer the following questions.
Figure 11.2.2
The economy depicted does not engage in international trade and has no government.Planned aggregate expenditure AE) is equal to the sum of consumption expenditure C) and investment I).
Refer to Figure 11.2.2.When real GDP is $300 billion, real GDP
A)exceeds aggregate planned expenditure by $50 billion, and firms increase production.
B)is the same as aggregate planned expenditure, and firms do not change production.
C)is less than aggregate planned expenditure by $25 billion, and firms decrease production.
D)exceeds aggregate planned expenditure by $25 billion, and firms increase production.
E)exceeds aggregate planned expenditure by $25 billion, and firms decrease production.
Figure 11.2.2The economy depicted does not engage in international trade and has no government.Planned aggregate expenditure AE) is equal to the sum of consumption expenditure C) and investment I).
Refer to Figure 11.2.2.When real GDP is $300 billion, real GDP
A)exceeds aggregate planned expenditure by $50 billion, and firms increase production.
B)is the same as aggregate planned expenditure, and firms do not change production.
C)is less than aggregate planned expenditure by $25 billion, and firms decrease production.
D)exceeds aggregate planned expenditure by $25 billion, and firms increase production.
E)exceeds aggregate planned expenditure by $25 billion, and firms decrease production.
Question
Question
Question
Use the figure below to answer the following questions.
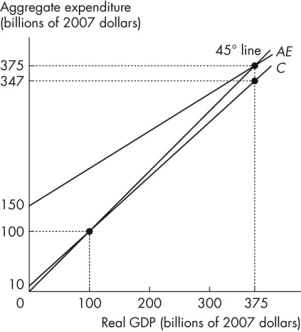 Figure 11.2.3
There are no taxes in this economy.
In Figure 11.2.3, the marginal propensity to consume, assuming no income taxes, is
A)1.0.
B)0.3.
C)0.9.
D)0.6.
E)0.93.
Figure 11.2.3There are no taxes in this economy.
In Figure 11.2.3, the marginal propensity to consume, assuming no income taxes, is
A)1.0.
B)0.3.
C)0.9.
D)0.6.
E)0.93.
Question
Question
Question
Use the figure below to answer the following questions.
Figure 11.2.2
The economy depicted does not engage in international trade and has no government.Planned aggregate expenditure AE) is equal to the sum of consumption expenditure C) and investment I).
Refer to Figure 11.2.2.When real GDP is $100 billion,
A)aggregate planned expenditure equals real GDP, and the economy is in equilibrium.
B)aggregate planned expenditure is greater than real GDP, and firms decrease production.
C)aggregate planned expenditure is less than real GDP, and firms increase production.
D)real GDP is less than aggregate planned expenditure, and firms increase production.
E)real GDP is greater than aggregate planned expenditure, and firms decrease production.
Figure 11.2.2The economy depicted does not engage in international trade and has no government.Planned aggregate expenditure AE) is equal to the sum of consumption expenditure C) and investment I).
Refer to Figure 11.2.2.When real GDP is $100 billion,
A)aggregate planned expenditure equals real GDP, and the economy is in equilibrium.
B)aggregate planned expenditure is greater than real GDP, and firms decrease production.
C)aggregate planned expenditure is less than real GDP, and firms increase production.
D)real GDP is less than aggregate planned expenditure, and firms increase production.
E)real GDP is greater than aggregate planned expenditure, and firms decrease production.
Question
Question
Question
Use the figure below to answer the following questions.
Figure 11.2.2
The economy depicted does not engage in international trade and has no government.Planned aggregate expenditure AE) is equal to the sum of consumption expenditure C) and investment I).
Refer to Figure 11.2.2.Equilibrium expenditure is
A)$100 billion.
B)$400 billion.
C)$200 billion.
D)$250 billion.
E)$300 billion.
Figure 11.2.2The economy depicted does not engage in international trade and has no government.Planned aggregate expenditure AE) is equal to the sum of consumption expenditure C) and investment I).
Refer to Figure 11.2.2.Equilibrium expenditure is
A)$100 billion.
B)$400 billion.
C)$200 billion.
D)$250 billion.
E)$300 billion.
Question
Use the figure below to answer the following questions.
Figure 11.2.3
There are no taxes in this economy.
In Figure 11.2.3, autonomous expenditure is
A)$375 billion.
B)$150 billion.
C)$347 billion.
D)$10 billion.
E)$100 billion.
Figure 11.2.3There are no taxes in this economy.
In Figure 11.2.3, autonomous expenditure is
A)$375 billion.
B)$150 billion.
C)$347 billion.
D)$10 billion.
E)$100 billion.
Question
Question

Unlock Deck
Sign up to unlock the cards in this deck!
Unlock Deck
Unlock Deck
1/166
Play
Full screen (f)
Deck 11: Expenditure Multipliers
1
When the consumption function lies below the 45° line, households
A)are dissaving.
B)spend all of any increase in disposable income.
C)consume more than their disposable income.
D)save all of any increase in disposable income.
E)are saving some portion of their disposable income.
A)are dissaving.
B)spend all of any increase in disposable income.
C)consume more than their disposable income.
D)save all of any increase in disposable income.
E)are saving some portion of their disposable income.
are saving some portion of their disposable income.
2
Use the figure below to answer the following questions.
Figure 11.1.1
This figure describes the relationship between consumption expenditure and disposable income for an economy.
Refer to Figure 11.1.1.The marginal propensity to consume for this economy is
A)0.5.
B)0.2.
C)0.8.
D)1.
E)0.6.
Figure 11.1.1This figure describes the relationship between consumption expenditure and disposable income for an economy.
Refer to Figure 11.1.1.The marginal propensity to consume for this economy is
A)0.5.
B)0.2.
C)0.8.
D)1.
E)0.6.
0.8.
3
Use the figure below to answer the following questions.
Figure 11.1.1
This figure describes the relationship between consumption expenditure and disposable income for an economy.
Refer to Figure 11.1.1.When disposable income is $200 billion,
A)households are saving an amount equal to line segment AB.
B)households are dissaving an amount equal to line segment AB.
C)households are consuming less than $200 billion.
D)businesses are spending more than households because the consumption function lies above the 45° line.
E)saving is greater than consumption expenditure.
Figure 11.1.1This figure describes the relationship between consumption expenditure and disposable income for an economy.
Refer to Figure 11.1.1.When disposable income is $200 billion,
A)households are saving an amount equal to line segment AB.
B)households are dissaving an amount equal to line segment AB.
C)households are consuming less than $200 billion.
D)businesses are spending more than households because the consumption function lies above the 45° line.
E)saving is greater than consumption expenditure.
households are dissaving an amount equal to line segment AB.
4
Dissaving occurs when a household
A)consumes more than it receives in disposable income.
B)borrows.
C)saves more than it spends.
D)spends more than it saves.
E)spends less than it receives in disposable income.
A)consumes more than it receives in disposable income.
B)borrows.
C)saves more than it spends.
D)spends more than it saves.
E)spends less than it receives in disposable income.
Unlock Deck
Unlock for access to all 166 flashcards in this deck.
Unlock Deck
k this deck
5
The marginal propensity to save is calculated as
A)saving divided by disposable income.
B)the change in saving divided by the change in consumption expenditure.
C)saving divided by the change in disposable income.
D)the change in saving divided by disposable income.
E)the change in saving divided by the change in disposable income.
A)saving divided by disposable income.
B)the change in saving divided by the change in consumption expenditure.
C)saving divided by the change in disposable income.
D)the change in saving divided by disposable income.
E)the change in saving divided by the change in disposable income.
Unlock Deck
Unlock for access to all 166 flashcards in this deck.
Unlock Deck
k this deck
6
Disposable income is
A)used for consumption only.
B)aggregate income minus taxes plus transfer payments.
C)aggregate income minus transfer payments.
D)aggregate income minus taxes.
E)aggregate income plus transfer payments.
A)used for consumption only.
B)aggregate income minus taxes plus transfer payments.
C)aggregate income minus transfer payments.
D)aggregate income minus taxes.
E)aggregate income plus transfer payments.
Unlock Deck
Unlock for access to all 166 flashcards in this deck.
Unlock Deck
k this deck
7
Use the figure below to answer the following questions.
Figure 11.1.1
This figure describes the relationship between consumption expenditure and disposable income for an economy.
Refer to Figure 11.1.1.When disposable income is equal to $200 billion, saving is
A)$60 billion.
B)$200 billion.
C)$150 billion.
D)zero.
E)- $60 billion.
Figure 11.1.1This figure describes the relationship between consumption expenditure and disposable income for an economy.
Refer to Figure 11.1.1.When disposable income is equal to $200 billion, saving is
A)$60 billion.
B)$200 billion.
C)$150 billion.
D)zero.
E)- $60 billion.
Unlock Deck
Unlock for access to all 166 flashcards in this deck.
Unlock Deck
k this deck
8
If the marginal propensity to consume is 0.85, what change in consumption expenditure would you expect if disposable income increases by $200 million?
A)$18 million
B)$170 million
C)$1,800 million
D)$180 million
E)$20 million
A)$18 million
B)$170 million
C)$1,800 million
D)$180 million
E)$20 million
Unlock Deck
Unlock for access to all 166 flashcards in this deck.
Unlock Deck
k this deck
9
The marginal propensity to consume is calculated as
A)consumption expenditure divided by total disposable income.
B)consumption expenditure divided by the change in disposable income.
C)the change in consumption expenditure divided by the change in disposable income.
D)the change in consumption expenditure divided by disposable income.
E)the change in consumption expenditure divided by saving.
Unlock Deck
Unlock for access to all 166 flashcards in this deck.
Unlock Deck
k this deck
10
The marginal propensity to consume is the
A)fraction of a change in disposable income that is spent on consumption.
B)fraction of the first dollar of disposable income received that is consumed.
C)fraction of the first dollar of disposable income received that is saved.
D)total amount of consumption divided by the total amount of disposable income.
E)fraction of the last dollar of disposable income received that is saved.
Unlock Deck
Unlock for access to all 166 flashcards in this deck.
Unlock Deck
k this deck
11
A household
A)consumes, saves, or pays taxes out of disposable income.
B)consumes or pays taxes out of disposable income.
C)consumes or saves out of disposable income.
D)only consumes out of disposable income.
E)saves more than it consumes.
A)consumes, saves, or pays taxes out of disposable income.
B)consumes or pays taxes out of disposable income.
C)consumes or saves out of disposable income.
D)only consumes out of disposable income.
E)saves more than it consumes.
Unlock Deck
Unlock for access to all 166 flashcards in this deck.
Unlock Deck
k this deck
12
If a household's disposable income increases from $12,000 to $22,000 and at the same time its consumption expenditure increases from $4,000 to $9,000, then
A)the marginal propensity to consume over this range is negative.
B)the slope of the consumption function is 0.5.
C)the slope of the consumption function is 0.6.
D)the household is dissaving.
E)the marginal propensity to save over this range is negative.
A)the marginal propensity to consume over this range is negative.
B)the slope of the consumption function is 0.5.
C)the slope of the consumption function is 0.6.
D)the household is dissaving.
E)the marginal propensity to save over this range is negative.
Unlock Deck
Unlock for access to all 166 flashcards in this deck.
Unlock Deck
k this deck
13
Use the figure below to answer the following questions.
Figure 11.1.1
This figure describes the relationship between consumption expenditure and disposable income for an economy.
Refer to Figure 11.1.1.When disposable income is $500 billion, saving is equal to
A)$20 billion.
B)consumption expenditure.
C)zero.
D)$40 billion.
E)disposable income.
Figure 11.1.1This figure describes the relationship between consumption expenditure and disposable income for an economy.
Refer to Figure 11.1.1.When disposable income is $500 billion, saving is equal to
A)$20 billion.
B)consumption expenditure.
C)zero.
D)$40 billion.
E)disposable income.
Unlock Deck
Unlock for access to all 166 flashcards in this deck.
Unlock Deck
k this deck
14
If the marginal propensity to save is 0.2, then
A)the marginal propensity to consume is 0.8.
B)the slope of the consumption function is 0.2.
C)the marginal propensity to consume is also 0.2.
D)the slope of the saving function is 0.8.
E)the marginal propensity to consume is larger than 0.8.
A)the marginal propensity to consume is 0.8.
B)the slope of the consumption function is 0.2.
C)the marginal propensity to consume is also 0.2.
D)the slope of the saving function is 0.8.
E)the marginal propensity to consume is larger than 0.8.
Unlock Deck
Unlock for access to all 166 flashcards in this deck.
Unlock Deck
k this deck
15
The marginal propensity to save
A)is greater than 1 but less than 2.
B)equals 1 - MPC.
C)is greater than 1.
D)is between zero and 1/2.
E)is negative.
A)is greater than 1 but less than 2.
B)equals 1 - MPC.
C)is greater than 1.
D)is between zero and 1/2.
E)is negative.
Unlock Deck
Unlock for access to all 166 flashcards in this deck.
Unlock Deck
k this deck
16
If consumption is $8,000 when disposable income is $10,000, the marginal propensity to consume
A)is 0.75.
B)is 0.80.
C)is 1.25.
D)is 0.50.
E)cannot be determined from the information given.
A)is 0.75.
B)is 0.80.
C)is 1.25.
D)is 0.50.
E)cannot be determined from the information given.
Unlock Deck
Unlock for access to all 166 flashcards in this deck.
Unlock Deck
k this deck
17
The marginal propensity to consume
A)is greater than 1 but less than 2.
B)is negative if dissaving is present.
C)is greater than 1 if dissaving is present.
D)is between zero and 1.
E)is between 1/2 and 1.
A)is greater than 1 but less than 2.
B)is negative if dissaving is present.
C)is greater than 1 if dissaving is present.
D)is between zero and 1.
E)is between 1/2 and 1.
Unlock Deck
Unlock for access to all 166 flashcards in this deck.
Unlock Deck
k this deck
18
Use the figure below to answer the following questions.
Figure 11.1.1
This figure describes the relationship between consumption expenditure and disposable income for an economy.
Refer to Figure 11.1.1.Consumption and disposable income are equal
A)when disposable income is greater than or equal to $500 billion.
B)when saving equals $40 billion and disposable income equals $540 billion.
C)when disposable income is $600 billion.
D)at all points along the consumption function.
E)when disposable income is $500 billion.
Figure 11.1.1This figure describes the relationship between consumption expenditure and disposable income for an economy.
Refer to Figure 11.1.1.Consumption and disposable income are equal
A)when disposable income is greater than or equal to $500 billion.
B)when saving equals $40 billion and disposable income equals $540 billion.
C)when disposable income is $600 billion.
D)at all points along the consumption function.
E)when disposable income is $500 billion.
Unlock Deck
Unlock for access to all 166 flashcards in this deck.
Unlock Deck
k this deck
19
The sum of the marginal propensity to save and the marginal propensity to consume
A)always equals 0.
B)never equals 1.
C)is greater than zero but less than 1.
D)always equals 1.
E)sometimes equals 1.
A)always equals 0.
B)never equals 1.
C)is greater than zero but less than 1.
D)always equals 1.
E)sometimes equals 1.
Unlock Deck
Unlock for access to all 166 flashcards in this deck.
Unlock Deck
k this deck
20
If consumption expenditure for a household increases from $300 to $500 when disposable income increases from $200 to $500, the marginal propensity to consume is
A)equal to 1.
B)negative.
C)equal to 1.33.
D)equal to 0.67.
E)equal to 0.75.
A)equal to 1.
B)negative.
C)equal to 1.33.
D)equal to 0.67.
E)equal to 0.75.
Unlock Deck
Unlock for access to all 166 flashcards in this deck.
Unlock Deck
k this deck
21
Use the table below to answer the following questions.
Table 11.1.1
The following table shows the relationship between consumption expenditure C) and disposable income YD) for a hypothetical economy.
Refer to Table 11.1.1.The marginal propensity to consume is
A)0.75.
B)increasing as YD increases.
C)equal to 1 when YD equals $600.
D)0.25.
E)1.33.
Table 11.1.1
The following table shows the relationship between consumption expenditure C) and disposable income YD) for a hypothetical economy.
Refer to Table 11.1.1.The marginal propensity to consume is
A)0.75.
B)increasing as YD increases.
C)equal to 1 when YD equals $600.
D)0.25.
E)1.33.
Unlock Deck
Unlock for access to all 166 flashcards in this deck.
Unlock Deck
k this deck
22
Use the table below to answer the following questions.
Table 11.1.2
Refer to Table 11.1.2.Saving equals $100 when disposable income is
A)$575.
B)$525.
C)$625.
D)$475.
E)$550.
Table 11.1.2
Refer to Table 11.1.2.Saving equals $100 when disposable income is
A)$575.
B)$525.
C)$625.
D)$475.
E)$550.
Unlock Deck
Unlock for access to all 166 flashcards in this deck.
Unlock Deck
k this deck
23
Use the table below to answer the following questions.
Table 11.1.3
In Table 11.1.3, at which of the following values of disposable income is there positive saving?
A)$200
B)all values over $300
C)$100
D)zero
E)all values under $300
Table 11.1.3
In Table 11.1.3, at which of the following values of disposable income is there positive saving?
A)$200
B)all values over $300
C)$100
D)zero
E)all values under $300
Unlock Deck
Unlock for access to all 166 flashcards in this deck.
Unlock Deck
k this deck
24
Use the figure below to answer the following questions.
Figure 11.1.2
The slope of the consumption function is
A)zero.
B)equal to the slope of the 45° line.
C)less than the slope of the 45° line.
D)one.
E)greater than the slope of the 45° line.
Figure 11.1.2The slope of the consumption function is
A)zero.
B)equal to the slope of the 45° line.
C)less than the slope of the 45° line.
D)one.
E)greater than the slope of the 45° line.
Unlock Deck
Unlock for access to all 166 flashcards in this deck.
Unlock Deck
k this deck
25
The fraction of a change in disposable income spent on consumption is the
A)marginal tax rate.
B)marginal propensity to save.
C)marginal propensity to consume.
D)consumption function.
E)marginal propensity to dispose.
A)marginal tax rate.
B)marginal propensity to save.
C)marginal propensity to consume.
D)consumption function.
E)marginal propensity to dispose.
Unlock Deck
Unlock for access to all 166 flashcards in this deck.
Unlock Deck
k this deck
26
The consumption function shows the relationship between consumption expenditure and _______ , other things remaining the same.
A)disposable income
B)the price level
C)the interest rate
D)nominal income
E)saving
A)disposable income
B)the price level
C)the interest rate
D)nominal income
E)saving
Unlock Deck
Unlock for access to all 166 flashcards in this deck.
Unlock Deck
k this deck
27
Use the table below to answer the following questions.
Table 11.1.3
Refer to Table 11.1.3.Autonomous consumption is equal to
A)$100.
B)$260.
C)$65.
D)$0.
E)$400.
Table 11.1.3
Refer to Table 11.1.3.Autonomous consumption is equal to
A)$100.
B)$260.
C)$65.
D)$0.
E)$400.
Unlock Deck
Unlock for access to all 166 flashcards in this deck.
Unlock Deck
k this deck
28
Use the table below to answer the following questions.
Table 11.1.2
Refer to Table 11.1.2.What is the value of the marginal propensity to save?
A)0.27
B)0.25
C)0.67
D)1.33
E)0.33
Table 11.1.2
Refer to Table 11.1.2.What is the value of the marginal propensity to save?
A)0.27
B)0.25
C)0.67
D)1.33
E)0.33
Unlock Deck
Unlock for access to all 166 flashcards in this deck.
Unlock Deck
k this deck
29
Use the figure below to answer the following questions.
Figure 11.1.2
Refer to Figure 11.1.2.Autonomous consumption is
A)zero.
B)$200.
C)$600.
D)- $200.
E)$800.
Figure 11.1.2Refer to Figure 11.1.2.Autonomous consumption is
A)zero.
B)$200.
C)$600.
D)- $200.
E)$800.
Unlock Deck
Unlock for access to all 166 flashcards in this deck.
Unlock Deck
k this deck
30
Use the table below to answer the following questions.
Table 11.1.1
The following table shows the relationship between consumption expenditure C) and disposable income YD) for a hypothetical economy.
Refer to Table 11.1.1.Based on the information in the table, if YD is zero, then
A)consumption is zero.
B)saving is zero.
C)consumption is $100.
D)consumption is $150.
E)consumption is - $150.
Unlock Deck
Unlock for access to all 166 flashcards in this deck.
Unlock Deck
k this deck
31
The vertical distance between the consumption function and the 45° line measures
A)consumption.
B)saving or dissaving.
C)disposable income.
D)the marginal propensity to consume.
E)the marginal propensity to save.
A)consumption.
B)saving or dissaving.
C)disposable income.
D)the marginal propensity to consume.
E)the marginal propensity to save.
Unlock Deck
Unlock for access to all 166 flashcards in this deck.
Unlock Deck
k this deck
32
Use the table below to answer the following questions.
Table 11.1.2
Refer to Table 11.1.2.When saving is zero, what is the level of disposable income?
A)$475
B)$625
C)$550
D)$325
E)$400
Table 11.1.2
Refer to Table 11.1.2.When saving is zero, what is the level of disposable income?
A)$475
B)$625
C)$550
D)$325
E)$400
Unlock Deck
Unlock for access to all 166 flashcards in this deck.
Unlock Deck
k this deck
33
Use the table below to answer the following questions.
Table 11.1.1
The following table shows the relationship between consumption expenditure C) and disposable income YD) for a hypothetical economy.
Refer to Table 11.1.1.The marginal propensity to save is
A)0.75.
B)4.
C)equal to zero when YD equals $600.
D)0.25.
E)decreasing as YD increases.
Table 11.1.1
The following table shows the relationship between consumption expenditure C) and disposable income YD) for a hypothetical economy.
Refer to Table 11.1.1.The marginal propensity to save is
A)0.75.
B)4.
C)equal to zero when YD equals $600.
D)0.25.
E)decreasing as YD increases.
Unlock Deck
Unlock for access to all 166 flashcards in this deck.
Unlock Deck
k this deck
34
Use the table below to answer the following questions.
Table 11.1.2
Refer to Table 11.1.2.What is the value of the marginal propensity to consume?
A)0.34
B)0.25
C)1.33
D)0.67
E)0.75
Table 11.1.2
Refer to Table 11.1.2.What is the value of the marginal propensity to consume?
A)0.34
B)0.25
C)1.33
D)0.67
E)0.75
Unlock Deck
Unlock for access to all 166 flashcards in this deck.
Unlock Deck
k this deck
35
Use the table below to answer the following questions.
Table 11.1.3
Refer to Table 11.1.3.The marginal propensity to consume is
A)1.54.
B)0.35.
C)1.65.
D)1.15.
E)0.65.
Table 11.1.3
Refer to Table 11.1.3.The marginal propensity to consume is
A)1.54.
B)0.35.
C)1.65.
D)1.15.
E)0.65.
Unlock Deck
Unlock for access to all 166 flashcards in this deck.
Unlock Deck
k this deck
36
The saving function shows the relationship between saving and _______, other things remaining the same.
A)disposable income
B)the price level
C)the interest rate
D)consumption
E)nominal income
A)disposable income
B)the price level
C)the interest rate
D)consumption
E)nominal income
Unlock Deck
Unlock for access to all 166 flashcards in this deck.
Unlock Deck
k this deck
37
Use the table below to answer the following questions.
Table 11.1.1
The following table shows the relationship between consumption expenditure C) and disposable income YD) for a hypothetical economy.
Refer to Table 11.1.1.Using the information given in the table, saving is $125 when YD equals
A)$1,300.
B)$1,000.
C)$900.
D)$1,200.
E)$1,100.
Table 11.1.1
The following table shows the relationship between consumption expenditure C) and disposable income YD) for a hypothetical economy.
Refer to Table 11.1.1.Using the information given in the table, saving is $125 when YD equals
A)$1,300.
B)$1,000.
C)$900.
D)$1,200.
E)$1,100.
Unlock Deck
Unlock for access to all 166 flashcards in this deck.
Unlock Deck
k this deck
38
The fraction of a change in disposable income that is saved is the
A)marginal tax rate.
B)marginal propensity to dispose.
C)marginal propensity to save.
D)saving function.
E)marginal propensity to consume.
A)marginal tax rate.
B)marginal propensity to dispose.
C)marginal propensity to save.
D)saving function.
E)marginal propensity to consume.
Unlock Deck
Unlock for access to all 166 flashcards in this deck.
Unlock Deck
k this deck
39
Use the table below to answer the following questions.
Table 11.1.1
The following table shows the relationship between consumption expenditure C) and disposable income YD) for a hypothetical economy.
Refer to Table 11.1.1.If YD is $400, then saving is
A)$100.
B)- $125.
C)- $50.
D)zero.
E)$50.
Table 11.1.1
The following table shows the relationship between consumption expenditure C) and disposable income YD) for a hypothetical economy.
Refer to Table 11.1.1.If YD is $400, then saving is
A)$100.
B)- $125.
C)- $50.
D)zero.
E)$50.
Unlock Deck
Unlock for access to all 166 flashcards in this deck.
Unlock Deck
k this deck
40
Use the figure below to answer the following questions.
Figure 11.1.2
Refer to Figure 11.1.2.The marginal propensity to consume is
A)0.75.
B)0.2.
C)0.25.
D)0.8.
E)800.
Figure 11.1.2Refer to Figure 11.1.2.The marginal propensity to consume is
A)0.75.
B)0.2.
C)0.25.
D)0.8.
E)800.
Unlock Deck
Unlock for access to all 166 flashcards in this deck.
Unlock Deck
k this deck
41
The aggregate expenditure curve shows the relationship between aggregate planned expenditure and
A)the interest rate.
B)the price level.
C)real GDP.
D)consumption expenditure.
E)disposable income.
A)the interest rate.
B)the price level.
C)real GDP.
D)consumption expenditure.
E)disposable income.
Unlock Deck
Unlock for access to all 166 flashcards in this deck.
Unlock Deck
k this deck
42
If an economy's real GDP increases from $100 billion to $150 billion, and at the same time its imports increase from $40 billion to $50 billion, then the marginal propensity to import
A)is greater than 0.2 and less than 0.4.
B)decreases from 0.4 to 0.2.
C)is 0.4.
D)is 0.2.
E)is 0.36.
A)is greater than 0.2 and less than 0.4.
B)decreases from 0.4 to 0.2.
C)is 0.4.
D)is 0.2.
E)is 0.36.
Unlock Deck
Unlock for access to all 166 flashcards in this deck.
Unlock Deck
k this deck
43
Use the information below to answer the following questions.
Fact 11.1.1
In an economy, when disposable income increases from $400 billion to $500 billion, consumption expenditure increases from billion to $540 billion.
Consider Fact 11.1.1.The marginal propensity to consume is
A)0.80.
B)0.75.
C)0.25.
D)0.40.
E)0.60.
Fact 11.1.1
In an economy, when disposable income increases from $400 billion to $500 billion, consumption expenditure increases from billion to $540 billion.
Consider Fact 11.1.1.The marginal propensity to consume is
A)0.80.
B)0.75.
C)0.25.
D)0.40.
E)0.60.
Unlock Deck
Unlock for access to all 166 flashcards in this deck.
Unlock Deck
k this deck
44
Use the figure below to answer the following questions.
Figure 11.2.1
There are no exports or imports in this economy.
Refer to Figure 11.2.1.Equilibrium real GDP
A)is decreasing.
B)is equal to Yb.
C)is equal to Ya.
D)is equal to Yc.
E)can be any of Ya, Yb, or Yc depending on what is happening to inventories.
Figure 11.2.1There are no exports or imports in this economy.
Refer to Figure 11.2.1.Equilibrium real GDP
A)is decreasing.
B)is equal to Yb.
C)is equal to Ya.
D)is equal to Yc.
E)can be any of Ya, Yb, or Yc depending on what is happening to inventories.
Unlock Deck
Unlock for access to all 166 flashcards in this deck.
Unlock Deck
k this deck
45
Use the figure below to answer the following questions.
Figure 11.2.1
There are no exports or imports in this economy.
Refer to Figure 11.2.1.When real GDP is equal to Yb, then aggregate planned expenditure is
A)less than real GDP, and real GDP decreases.
B)greater than real GDP, and real GDP increases.
C)equal to real GDP, and real GDP neither increases nor decreases.
D)greater than real GDP, and real GDP decreases.
E)less than real GDP, and real GDP increases.
Figure 11.2.1There are no exports or imports in this economy.
Refer to Figure 11.2.1.When real GDP is equal to Yb, then aggregate planned expenditure is
A)less than real GDP, and real GDP decreases.
B)greater than real GDP, and real GDP increases.
C)equal to real GDP, and real GDP neither increases nor decreases.
D)greater than real GDP, and real GDP decreases.
E)less than real GDP, and real GDP increases.
Unlock Deck
Unlock for access to all 166 flashcards in this deck.
Unlock Deck
k this deck
46
Use the information below to answer the following questions.
Fact 11.1.1
In an economy, when disposable income increases from $400 billion to $500 billion, consumption expenditure increases from billion to $540 billion.
Consider Fact 11.1.1.When disposable income increases from $400 billion to $500 billion, saving
A)decreases by an unknown amount.
B)decreases by $60 billion.
C)increases by $60 billion.
D)increases by $40 billion.
E)increases by an unknown amount.
Unlock Deck
Unlock for access to all 166 flashcards in this deck.
Unlock Deck
k this deck
47
Use the figure below to answer the following questions.
Figure 11.2.1
There are no exports or imports in this economy.
Refer to Figure 11.2.1.When real GDP is equal to Yc, then
A)real GDP increases.
B)actual expenditure is less than planned expenditure.
C)actual expenditure is greater than planned expenditure.
D)planned expenditure is equal to actual expenditure.
E)the economy is in equilibrium.
Figure 11.2.1There are no exports or imports in this economy.
Refer to Figure 11.2.1.When real GDP is equal to Yc, then
A)real GDP increases.
B)actual expenditure is less than planned expenditure.
C)actual expenditure is greater than planned expenditure.
D)planned expenditure is equal to actual expenditure.
E)the economy is in equilibrium.
Unlock Deck
Unlock for access to all 166 flashcards in this deck.
Unlock Deck
k this deck
48
When disposable income increases,
A)a movement occurs up along the consumption function.
B)a movement occurs down along the consumption function.
C)the consumption function shifts upward.
D)a movement occurs down along the saving function.
E)the saving function shifts downward.
A)a movement occurs up along the consumption function.
B)a movement occurs down along the consumption function.
C)the consumption function shifts upward.
D)a movement occurs down along the saving function.
E)the saving function shifts downward.
Unlock Deck
Unlock for access to all 166 flashcards in this deck.
Unlock Deck
k this deck
49
If there is an unplanned increase in inventories, aggregate planned expenditure is
A)greater than real GDP and firms decrease production.
B)less than real GDP and firms increase production.
C)less than real GDP and firms decrease production.
D)greater than real GDP and firms increase production.
E)less than real GDP and firms decrease investment.
A)greater than real GDP and firms decrease production.
B)less than real GDP and firms increase production.
C)less than real GDP and firms decrease production.
D)greater than real GDP and firms increase production.
E)less than real GDP and firms decrease investment.
Unlock Deck
Unlock for access to all 166 flashcards in this deck.
Unlock Deck
k this deck
50
If real GDP is $3 billion and aggregate planned expenditure is $3.5 billion, then inventories
A)increase and productions increases.
B)remain the same and production decreases.
C)decrease and production increases.
D)decrease and production decreases.
E)increase and production decreases.
A)increase and productions increases.
B)remain the same and production decreases.
C)decrease and production increases.
D)decrease and production decreases.
E)increase and production decreases.
Unlock Deck
Unlock for access to all 166 flashcards in this deck.
Unlock Deck
k this deck
51
An increase in autonomous consumption
A)shifts the consumption function upward.
B)creates a movement upward along the consumption function.
C)creates a movement downward along the consumption function.
D)changes the slope of the consumption function.
E)shifts the consumption function downward.
A)shifts the consumption function upward.
B)creates a movement upward along the consumption function.
C)creates a movement downward along the consumption function.
D)changes the slope of the consumption function.
E)shifts the consumption function downward.
Unlock Deck
Unlock for access to all 166 flashcards in this deck.
Unlock Deck
k this deck
52
Use the figure below to answer the following questions.
Figure 11.2.1
There are no exports or imports in this economy.
Refer to Figure 11.2.1.When real GDP is equal to Ya, then
A)the economy is in equilibrium.
B)real GDP decreases.
C)actual expenditure is greater than planned expenditure.
D)planned expenditure is equal to actual expenditure.
E)actual expenditure is less than planned expenditure.
Figure 11.2.1There are no exports or imports in this economy.
Refer to Figure 11.2.1.When real GDP is equal to Ya, then
A)the economy is in equilibrium.
B)real GDP decreases.
C)actual expenditure is greater than planned expenditure.
D)planned expenditure is equal to actual expenditure.
E)actual expenditure is less than planned expenditure.
Unlock Deck
Unlock for access to all 166 flashcards in this deck.
Unlock Deck
k this deck
53
The marginal propensity to consume
A)increases as the economy moves upward along the consumption function.
B)is negative when saving is positive.
C)is greater than the slope of the 45- degree line.
D)is equal to zero when disposable income equals consumption expenditure.
E)is equal to 1 minus the slope of the saving function.
A)increases as the economy moves upward along the consumption function.
B)is negative when saving is positive.
C)is greater than the slope of the 45- degree line.
D)is equal to zero when disposable income equals consumption expenditure.
E)is equal to 1 minus the slope of the saving function.
Unlock Deck
Unlock for access to all 166 flashcards in this deck.
Unlock Deck
k this deck
54
Use the figure below to answer the following questions.
Figure 11.2.1
There are no exports or imports in this economy.
Refer to Figure 11.2.1.When real GDP is equal to Yb, then
A)real GDP increases.
B)real GDP decreases.
C)actual expenditure is less than planned expenditure.
D)actual expenditure is greater than planned expenditure.
E)planned expenditure is equal to actual expenditure.
Figure 11.2.1There are no exports or imports in this economy.
Refer to Figure 11.2.1.When real GDP is equal to Yb, then
A)real GDP increases.
B)real GDP decreases.
C)actual expenditure is less than planned expenditure.
D)actual expenditure is greater than planned expenditure.
E)planned expenditure is equal to actual expenditure.
Unlock Deck
Unlock for access to all 166 flashcards in this deck.
Unlock Deck
k this deck
55
If aggregate planned expenditure is less than real GDP, then inventories
A)increase and real GDP increases.
B)remain constant and real GDP remains constant.
C)decrease and real GDP decreases.
D)decrease and real GDP increases.
E)increase and real GDP falls.
A)increase and real GDP increases.
B)remain constant and real GDP remains constant.
C)decrease and real GDP decreases.
D)decrease and real GDP increases.
E)increase and real GDP falls.
Unlock Deck
Unlock for access to all 166 flashcards in this deck.
Unlock Deck
k this deck
56
Use the information below to answer the following questions.
Fact 11.1.1
In an economy, when disposable income increases from $400 billion to $500 billion, consumption expenditure increases from billion to $540 billion.
Consider Fact 11.1.1.The marginal propensity to save is
A)0.75.
B)0.60.
C)0.80.
D)0.40.
E)0.25.
Fact 11.1.1
In an economy, when disposable income increases from $400 billion to $500 billion, consumption expenditure increases from billion to $540 billion.
Consider Fact 11.1.1.The marginal propensity to save is
A)0.75.
B)0.60.
C)0.80.
D)0.40.
E)0.25.
Unlock Deck
Unlock for access to all 166 flashcards in this deck.
Unlock Deck
k this deck
57
The marginal propensity to import is equal to
A)the change in imports divided by the change in real GDP that brought it about, other things remaining the same.
B)1 - MPS - MPC.
C)imports minus exports.
D)disposable income minus consumption expenditure minus saving divided by real GDP.
E)the change in net imports divided by the change in disposable income, other things remaining the same.
Unlock Deck
Unlock for access to all 166 flashcards in this deck.
Unlock Deck
k this deck
58
If aggregate planned expenditure exceeds real GDP, then inventories
A)remain constant and real GDP remains constant.
B)increase and real GDP falls.
C)increase and real GDP increases.
D)decrease and real GDP decreases.
E)decrease and real GDP increases.
A)remain constant and real GDP remains constant.
B)increase and real GDP falls.
C)increase and real GDP increases.
D)decrease and real GDP decreases.
E)decrease and real GDP increases.
Unlock Deck
Unlock for access to all 166 flashcards in this deck.
Unlock Deck
k this deck
59
The marginal propensity to import is calculated as
A)imports divided by real GDP.
B)the change in imports divided by real GDP.
C)imports divided by the change in real GDP.
D)1- MPC.
E)the change in imports divided by the change in real GDP.
A)imports divided by real GDP.
B)the change in imports divided by real GDP.
C)imports divided by the change in real GDP.
D)1- MPC.
E)the change in imports divided by the change in real GDP.
Unlock Deck
Unlock for access to all 166 flashcards in this deck.
Unlock Deck
k this deck
60
Use the figure below to answer the following questions.
Figure 11.2.1
There are no exports or imports in this economy.
Refer to Figure 11.2.1.When real GDP is equal to Ya, then aggregate planned expenditure
A)exceeds real GDP, and real GDP increases.
B)exceeds real GDP, and real GDP decreases.
C)is less than real GDP, and real GDP decreases.
D)is equal to real GDP, and real GDP neither increases nor decreases.
E)is less than real GDP, and real GDP increases.
Figure 11.2.1There are no exports or imports in this economy.
Refer to Figure 11.2.1.When real GDP is equal to Ya, then aggregate planned expenditure
A)exceeds real GDP, and real GDP increases.
B)exceeds real GDP, and real GDP decreases.
C)is less than real GDP, and real GDP decreases.
D)is equal to real GDP, and real GDP neither increases nor decreases.
E)is less than real GDP, and real GDP increases.
Unlock Deck
Unlock for access to all 166 flashcards in this deck.
Unlock Deck
k this deck
61
If AE = 100 + 0.7Y and Y = 300, then unplanned inventories
A)increase by 10.
B)decrease by 200.
C)increase by 200.
D)decrease by 10.
E)do not change and equilibrium exists.
A)increase by 10.
B)decrease by 200.
C)increase by 200.
D)decrease by 10.
E)do not change and equilibrium exists.
Unlock Deck
Unlock for access to all 166 flashcards in this deck.
Unlock Deck
k this deck
62
As real GDP decreases,
A)planned investment increases.
B)exports increase.
C)induced consumption decreases.
D)induced consumption increases.
E)imports increase.
A)planned investment increases.
B)exports increase.
C)induced consumption decreases.
D)induced consumption increases.
E)imports increase.
Unlock Deck
Unlock for access to all 166 flashcards in this deck.
Unlock Deck
k this deck
63
Use the figure below to answer the following questions.
Figure 11.2.2
The economy depicted does not engage in international trade and has no government.Planned aggregate expenditure AE) is equal to the sum of consumption expenditure C) and investment I).
If there is an unplanned decrease in inventories, aggregate planned expenditure is
A)less than real GDP, and firms increase production.
B)greater than real GDP, and firms decrease production.
C)greater than real GDP, and firms increase production.
D)less than real GDP, and firms decrease production.
E)greater than real GDP, and firms increase investment.
Figure 11.2.2The economy depicted does not engage in international trade and has no government.Planned aggregate expenditure AE) is equal to the sum of consumption expenditure C) and investment I).
If there is an unplanned decrease in inventories, aggregate planned expenditure is
A)less than real GDP, and firms increase production.
B)greater than real GDP, and firms decrease production.
C)greater than real GDP, and firms increase production.
D)less than real GDP, and firms decrease production.
E)greater than real GDP, and firms increase investment.
Unlock Deck
Unlock for access to all 166 flashcards in this deck.
Unlock Deck
k this deck
64
Everything else remaining the same, autonomous consumption
A)increases as disposable income decreases.
B)decreases as disposable income decreases.
C)does not change as disposable income changes.
D)increases as disposable income increases.
E)is usually assumed to be zero.
A)increases as disposable income decreases.
B)decreases as disposable income decreases.
C)does not change as disposable income changes.
D)increases as disposable income increases.
E)is usually assumed to be zero.
Unlock Deck
Unlock for access to all 166 flashcards in this deck.
Unlock Deck
k this deck
65
Use the figure below to answer the following questions.
Figure 11.2.1
There are no exports or imports in this economy.
Refer to Figure 11.2.1.When real GDP is equal to Yc, then aggregate planned expenditure is
A)greater than real GDP, and real GDP decreases.
B)less than real GDP, and real GDP decreases.
C)equal to real GDP, and real GDP neither increases nor decreases.
D)less than real GDP, and real GDP increases.
E)greater than real GDP, and real GDP increases.
Figure 11.2.1There are no exports or imports in this economy.
Refer to Figure 11.2.1.When real GDP is equal to Yc, then aggregate planned expenditure is
A)greater than real GDP, and real GDP decreases.
B)less than real GDP, and real GDP decreases.
C)equal to real GDP, and real GDP neither increases nor decreases.
D)less than real GDP, and real GDP increases.
E)greater than real GDP, and real GDP increases.
Unlock Deck
Unlock for access to all 166 flashcards in this deck.
Unlock Deck
k this deck
66
Use the figure below to answer the following questions.
Figure 11.2.2
The economy depicted does not engage in international trade and has no government.Planned aggregate expenditure AE) is equal to the sum of consumption expenditure C) and investment I).
Refer to Figure 11.2.2.Investment is
A)$100 billion.
B)$25 billion.
C)$75 billion.
D)$50 billion.
E)increasing as real GDP increases.
Figure 11.2.2The economy depicted does not engage in international trade and has no government.Planned aggregate expenditure AE) is equal to the sum of consumption expenditure C) and investment I).
Refer to Figure 11.2.2.Investment is
A)$100 billion.
B)$25 billion.
C)$75 billion.
D)$50 billion.
E)increasing as real GDP increases.
Unlock Deck
Unlock for access to all 166 flashcards in this deck.
Unlock Deck
k this deck
67
A change in consumption, in response to a change in income, is
A)equilibrium consumption.
B)planned consumption.
C)autonomous consumption.
D)induced consumption.
E)unplanned consumption.
A)equilibrium consumption.
B)planned consumption.
C)autonomous consumption.
D)induced consumption.
E)unplanned consumption.
Unlock Deck
Unlock for access to all 166 flashcards in this deck.
Unlock Deck
k this deck
68
Use the figure below to answer the following questions.
Figure 11.2.2
The economy depicted does not engage in international trade and has no government.Planned aggregate expenditure AE) is equal to the sum of consumption expenditure C) and investment I).
Refer to Figure 11.2.2.When real GDP is $300 billion, real GDP
A)exceeds aggregate planned expenditure by $50 billion, and firms increase production.
B)is the same as aggregate planned expenditure, and firms do not change production.
C)is less than aggregate planned expenditure by $25 billion, and firms decrease production.
D)exceeds aggregate planned expenditure by $25 billion, and firms increase production.
E)exceeds aggregate planned expenditure by $25 billion, and firms decrease production.
Figure 11.2.2The economy depicted does not engage in international trade and has no government.Planned aggregate expenditure AE) is equal to the sum of consumption expenditure C) and investment I).
Refer to Figure 11.2.2.When real GDP is $300 billion, real GDP
A)exceeds aggregate planned expenditure by $50 billion, and firms increase production.
B)is the same as aggregate planned expenditure, and firms do not change production.
C)is less than aggregate planned expenditure by $25 billion, and firms decrease production.
D)exceeds aggregate planned expenditure by $25 billion, and firms increase production.
E)exceeds aggregate planned expenditure by $25 billion, and firms decrease production.
Unlock Deck
Unlock for access to all 166 flashcards in this deck.
Unlock Deck
k this deck
69
Suppose real GDP increases by $1 billion and, as a result, consumption increases by $500 million.This change in consumption is
A)unplanned.
B)planned.
C)too little.
D)autonomous.
E)induced.
A)unplanned.
B)planned.
C)too little.
D)autonomous.
E)induced.
Unlock Deck
Unlock for access to all 166 flashcards in this deck.
Unlock Deck
k this deck
70
Consumption expenditure minus imports, which varies with real GDP, is
A)induced expenditure.
B)unplanned consumption.
C)autonomous expenditure.
D)aggregate expenditure.
E)planned consumption.
A)induced expenditure.
B)unplanned consumption.
C)autonomous expenditure.
D)aggregate expenditure.
E)planned consumption.
Unlock Deck
Unlock for access to all 166 flashcards in this deck.
Unlock Deck
k this deck
71
Use the figure below to answer the following questions.
Figure 11.2.3
There are no taxes in this economy.
In Figure 11.2.3, the marginal propensity to consume, assuming no income taxes, is
A)1.0.
B)0.3.
C)0.9.
D)0.6.
E)0.93.
Figure 11.2.3There are no taxes in this economy.
In Figure 11.2.3, the marginal propensity to consume, assuming no income taxes, is
A)1.0.
B)0.3.
C)0.9.
D)0.6.
E)0.93.
Unlock Deck
Unlock for access to all 166 flashcards in this deck.
Unlock Deck
k this deck
72
Which one of the following will lead to an increase in the slope of the AE function?
A)an increase in the marginal tax rate
B)a decrease in the marginal propensity to save
C)an increase in the marginal propensity to save
D)a decrease in the marginal propensity to consume
E)an increase in the marginal propensity to import
A)an increase in the marginal tax rate
B)a decrease in the marginal propensity to save
C)an increase in the marginal propensity to save
D)a decrease in the marginal propensity to consume
E)an increase in the marginal propensity to import
Unlock Deck
Unlock for access to all 166 flashcards in this deck.
Unlock Deck
k this deck
73
Equilibrium expenditure occurs when
A)the price level equals 110.
B)induced consumption equals aggregate planned expenditure.
C)aggregate planned expenditure equals consumption.
D)aggregate planned expenditure equals real GDP.
E)consumption equals real GDP.
A)the price level equals 110.
B)induced consumption equals aggregate planned expenditure.
C)aggregate planned expenditure equals consumption.
D)aggregate planned expenditure equals real GDP.
E)consumption equals real GDP.
Unlock Deck
Unlock for access to all 166 flashcards in this deck.
Unlock Deck
k this deck
74
Use the figure below to answer the following questions.
Figure 11.2.2
The economy depicted does not engage in international trade and has no government.Planned aggregate expenditure AE) is equal to the sum of consumption expenditure C) and investment I).
Refer to Figure 11.2.2.When real GDP is $100 billion,
A)aggregate planned expenditure equals real GDP, and the economy is in equilibrium.
B)aggregate planned expenditure is greater than real GDP, and firms decrease production.
C)aggregate planned expenditure is less than real GDP, and firms increase production.
D)real GDP is less than aggregate planned expenditure, and firms increase production.
E)real GDP is greater than aggregate planned expenditure, and firms decrease production.
Figure 11.2.2The economy depicted does not engage in international trade and has no government.Planned aggregate expenditure AE) is equal to the sum of consumption expenditure C) and investment I).
Refer to Figure 11.2.2.When real GDP is $100 billion,
A)aggregate planned expenditure equals real GDP, and the economy is in equilibrium.
B)aggregate planned expenditure is greater than real GDP, and firms decrease production.
C)aggregate planned expenditure is less than real GDP, and firms increase production.
D)real GDP is less than aggregate planned expenditure, and firms increase production.
E)real GDP is greater than aggregate planned expenditure, and firms decrease production.
Unlock Deck
Unlock for access to all 166 flashcards in this deck.
Unlock Deck
k this deck
75
As real GDP increases,
A)imports increase.
B)planned investment increases.
C)imports decrease.
D)autonomous consumption increases.
E)exports increase.
A)imports increase.
B)planned investment increases.
C)imports decrease.
D)autonomous consumption increases.
E)exports increase.
Unlock Deck
Unlock for access to all 166 flashcards in this deck.
Unlock Deck
k this deck
76
If AE = 50 + 0.6Y and Y = 200, then unplanned inventories
A)increase by 75.
B)decrease by 30.
C)increase by 30.
D)decrease by 75.
E)do not change and equilibrium exists.
A)increase by 75.
B)decrease by 30.
C)increase by 30.
D)decrease by 75.
E)do not change and equilibrium exists.
Unlock Deck
Unlock for access to all 166 flashcards in this deck.
Unlock Deck
k this deck
77
Use the figure below to answer the following questions.
Figure 11.2.2
The economy depicted does not engage in international trade and has no government.Planned aggregate expenditure AE) is equal to the sum of consumption expenditure C) and investment I).
Refer to Figure 11.2.2.Equilibrium expenditure is
A)$100 billion.
B)$400 billion.
C)$200 billion.
D)$250 billion.
E)$300 billion.
Figure 11.2.2The economy depicted does not engage in international trade and has no government.Planned aggregate expenditure AE) is equal to the sum of consumption expenditure C) and investment I).
Refer to Figure 11.2.2.Equilibrium expenditure is
A)$100 billion.
B)$400 billion.
C)$200 billion.
D)$250 billion.
E)$300 billion.
Unlock Deck
Unlock for access to all 166 flashcards in this deck.
Unlock Deck
k this deck
78
Use the figure below to answer the following questions.
Figure 11.2.3
There are no taxes in this economy.
In Figure 11.2.3, autonomous expenditure is
A)$375 billion.
B)$150 billion.
C)$347 billion.
D)$10 billion.
E)$100 billion.
Figure 11.2.3There are no taxes in this economy.
In Figure 11.2.3, autonomous expenditure is
A)$375 billion.
B)$150 billion.
C)$347 billion.
D)$10 billion.
E)$100 billion.
Unlock Deck
Unlock for access to all 166 flashcards in this deck.
Unlock Deck
k this deck
79
Which one of the following variables has an induced component?
A)government expenditure on goods and services
B)exports
C)consumption and investment
D)consumption
E)investment
A)government expenditure on goods and services
B)exports
C)consumption and investment
D)consumption
E)investment
Unlock Deck
Unlock for access to all 166 flashcards in this deck.
Unlock Deck
k this deck
80
The fact that imports increase as real GDP increases implies that imports are part of
A)induced expenditure.
B)autonomous expenditure.
C)equilibrium expenditure.
D)marginal expenditure.
E)consumption expenditure.
A)induced expenditure.
B)autonomous expenditure.
C)equilibrium expenditure.
D)marginal expenditure.
E)consumption expenditure.
Unlock Deck
Unlock for access to all 166 flashcards in this deck.
Unlock Deck
k this deck
Unlock Deck
Unlock for access to all 166 flashcards in this deck.


