Deck 4: A: - Market Failures: Public Goods and Externalities
Full screen (f)
Question
Question
Question
Question
Question
Question
Question
The next three questions refer to the below supply and demand graph for a public good. 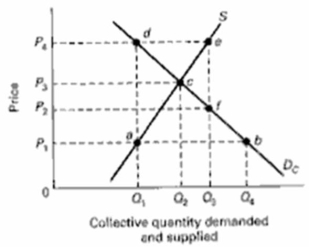 (a) What does point c represent?
(b) What does the line segment ef at output Q3 represent?
(c) At what output level is there an underallocation of resources to the production of this public good?
(a) What does point c represent?(b) What does the line segment ef at output Q3 represent?
(c) At what output level is there an underallocation of resources to the production of this public good?
Question
Question
Question
Question
Draw a market supply curve and indicate the following:
(a) The market price;
(b) The quantity supplied;
(c) The minimum amount that sellers are willing to accept for the quantity supplied;
(d) The actual amount that sellers receive for providing the quantity supplied;
(e) The producer surplus from providing the quantity supplied.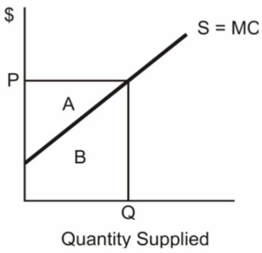
(a) The market price;
(b) The quantity supplied;
(c) The minimum amount that sellers are willing to accept for the quantity supplied;
(d) The actual amount that sellers receive for providing the quantity supplied;
(e) The producer surplus from providing the quantity supplied.
Question
Question
Question
Question
Question
Imagine that a provincial government is considering the construction of a new office building to consolidate its operations.Its estimate of the total costs and the total benefits of building a 4- 6-, 8-, or 10-story building is shown in the table below.(All figures are in millions of dollars.)
 (a) Compute the marginal cost and the marginal benefit of the 4-, 6-, 8-, and 10-story buildings.(b) Should the state build a new office building? If so, what size building and what will be the total benefit, total cost, and net benefit to society?

(a) Compute the marginal cost and the marginal benefit of the 4-, 6-, 8-, and 10-story buildings.(b) Should the state build a new office building? If so, what size building and what will be the total benefit, total cost, and net benefit to society? Question
Question
Question
Question
Question
Assume the atmosphere of an urban area is able to reabsorb 4,000 tonnes of pollutants per year.The schedule below shows the price polluters would be willing to pay for the right to dispose of 1 tonne of pollutants per year and the total quantity of pollutants they would wish to dispose of at each price.  (a) If there were no emission fee, how many tonnes of pollutants would there be and how much greater would this amount be than the capacity for re-absorption?
(b) What pollution fee should the urban authorities charge to solve the problem?
(c) What would happen in this market for pollution rights if quantity demanded increased by 1,000 tonnes at each price?
(a) If there were no emission fee, how many tonnes of pollutants would there be and how much greater would this amount be than the capacity for re-absorption?(b) What pollution fee should the urban authorities charge to solve the problem?
(c) What would happen in this market for pollution rights if quantity demanded increased by 1,000 tonnes at each price?
Question
Question
Question
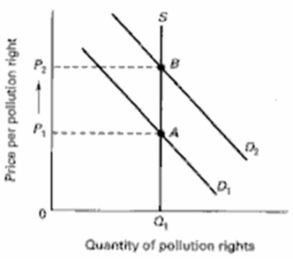
Draw a supply and demand graph on the below diagram that illustrates the market for pollution rights.Label the axes and curves.Then show what happens to price and quantity when the demand for pollution rights increases in the market. 
Question
Question
Question
Question
Question
Question
Question
Question
Question
Question
The following table shows marginal costs and benefits of the optimal quantity of pollution abatement that will occur at a local factory.  (a) What is the optimal level of pollution abatement? Why?
(b) If the marginal benefit of pollution abatement were to increase by $30,000 at each level because of the factory's desire to improve its image and environment, what would the optimal level be? Why?
(c) What might cause the optimal level of pollution abatement to be 400 tonnes?
(a) What is the optimal level of pollution abatement? Why?(b) If the marginal benefit of pollution abatement were to increase by $30,000 at each level because of the factory's desire to improve its image and environment, what would the optimal level be? Why?
(c) What might cause the optimal level of pollution abatement to be 400 tonnes?
Question
Assume the atmosphere of an urban area is able to reabsorb 8,000 tonnes of pollutants per year.The schedule below shows the price polluters would be willing to pay for the right to dispose of 1 tonne of pollutants per year and the total quantity of pollutants they would wish to dispose of at each price.  (a) If there were no emission fee, how many tonnes of pollutants would there be and how much greater would this amount be than the capacity for re-absorption?
(b) What pollution fee should the urban authorities charge to solve the problem?
(c) What would happen in this market for pollution rights if quantity demanded increased by 1,000 tonnes at each price?
(a) If there were no emission fee, how many tonnes of pollutants would there be and how much greater would this amount be than the capacity for re-absorption?(b) What pollution fee should the urban authorities charge to solve the problem?
(c) What would happen in this market for pollution rights if quantity demanded increased by 1,000 tonnes at each price?
Question
The following table shows marginal costs and benefits of the optimal quantity of pollution abatement that will occur at a local factory.  (a) What is the optimal level of pollution abatement? Why?
(b) If the marginal benefit of pollution abatement were to increase by $150,000 at each level because of the factory's desire to improve its image and environment, what would the optimal level be? Why?
(c) What might cause the optimal level of pollution abatement to be 120 tonnes?
(a) What is the optimal level of pollution abatement? Why?(b) If the marginal benefit of pollution abatement were to increase by $150,000 at each level because of the factory's desire to improve its image and environment, what would the optimal level be? Why?
(c) What might cause the optimal level of pollution abatement to be 120 tonnes?

Unlock Deck
Sign up to unlock the cards in this deck!
Unlock Deck
Unlock Deck
1/36
Play
Full screen (f)
Deck 4: A: - Market Failures: Public Goods and Externalities
1
Supply in a market is represented by the equation, P = 5 + .1QS.Suppose the market price is $30.(a) How many units do sellers wish to provide in this market?
(b) What is the minimum amount that sellers are willing to accept for this quantity of output?
(c) What is the actual amount that sellers receive for providing for this quantity of output?
(d) What is the producer surplus that sellers obtain for providing this quantity of output?
(b) What is the minimum amount that sellers are willing to accept for this quantity of output?
(c) What is the actual amount that sellers receive for providing for this quantity of output?
(d) What is the producer surplus that sellers obtain for providing this quantity of output?
(a) 250 units; (b) $4375 [.5($30 - $5) * 250 + $5* 250]; (c) $7500 ($30*250); (d) $3125.
2
Demand is represented by the equation, P = 200 - 2QD and supply by the equation P = 25 + 3QS.(a) Suppose this market produces 30 units of output.What price would this output be sold at if consumers we going to buy all goods? What is the marginal benefit to society of the 30th unit? What is the marginal cost of the 30th unit?
(b) What is consumer surplus if the market produces 30 units of output? What is producer surplus? What is the sum of consumer and producer surplus?
(c) What are the equilibrium price and quantity?
(d) What is consumer surplus at equilibrium? What is producer surplus? What is the sum of consumer and producer surplus?
(e) Is allocative efficiency achieved when the market produces 30 units of output? Explain in three different ways.
(a) The price is $140 [200 - 2(30)].The marginal benefit is $140.The marginal cost is $115 [25 + 3(30)].
(b) Consumer surplus is $900 [0.5($200 - $140) * 30].Producer surplus is $2100 [0.5($115 - $25) *30 + ($140 - $115) * 30].The sum of consumer and producer surplus is $3000.
(c) The equilibrium price and quantity are $130 and 35 units.
(d) Consumer surplus is $1225 [0.5($200 - $130) *35].Producer surplus is $1837.50 [0.5($130 - $25) * 35].The sum of consumer and producer surplus is $3062.50.
(e) Allocative efficiency is achieved when P = MC, when MB = MC, and when the sum of consumer and producer surplus is maximized.When 30 units of output are produced, P, which is $140, exceeds MC, which is $115.Also, MB, which is $140, exceeds MC, which is $115.Finally, the sum of consumer and producer surplus is $3000.However, this sum is not maximized.The sum can be as large as $3062.50.Therefore, on all three bases, allocative efficiency is not achieved at 30 units of output.There is an under allocation of resources to this industry.By shifting resources to this industry and increasing output to 35 units, allocative efficiency is achieved.
3
What is producer surplus?
Producer surplus is the difference between what sellers receive for their product and the marginal cost of producing the product.
4
Demand is represented by the equation, P = 20 - 0.2QD and supply by the equation P = 5 + 0.1QS.(a) Suppose this market produces 40 units of output.What price would this output be sold at? What is the marginal benefit to society of the 40th unit? What is the marginal cost of the 40th unit?
(b) What is consumer surplus if the market produces 40 units of output? What is producer surplus? What is the sum of consumer and producer surplus?
(c) What are the equilibrium price and quantity?
(d) What is consumer surplus at equilibrium? What is producer surplus? What is the sum of consumer and producer surplus?
(e) Is allocative efficiency achieved when the market produces 40 units of output? Explain in three different ways.
Unlock Deck
Unlock for access to all 36 flashcards in this deck.
Unlock Deck
k this deck
5
In your own words, describe what free-riding means.
Unlock Deck
Unlock for access to all 36 flashcards in this deck.
Unlock Deck
k this deck
6
How is consumer surplus derived from a demand curve?
Unlock Deck
Unlock for access to all 36 flashcards in this deck.
Unlock Deck
k this deck
7
The next three questions refer to the below supply and demand graph for a public good. (a) What does point c represent?
(b) What does the line segment ef at output Q3 represent?
(c) At what output level is there an underallocation of resources to the production of this public good?
(a) What does point c represent?(b) What does the line segment ef at output Q3 represent?
(c) At what output level is there an underallocation of resources to the production of this public good?
Unlock Deck
Unlock for access to all 36 flashcards in this deck.
Unlock Deck
k this deck
8
Demand in a market is represented by the equation, P = 50 - QD.Suppose the market price is $30.(a) How many units do buyers wish to purchase in this market?
(b) What is the maximum amount that the buyers are willing to pay for this quantity of output?
(c) What is the actual amount that buyers have to pay for this quantity of output?
(d) What is the consumer surplus that buyers obtain from purchasing this quantity of output?
(b) What is the maximum amount that the buyers are willing to pay for this quantity of output?
(c) What is the actual amount that buyers have to pay for this quantity of output?
(d) What is the consumer surplus that buyers obtain from purchasing this quantity of output?
Unlock Deck
Unlock for access to all 36 flashcards in this deck.
Unlock Deck
k this deck
9
Demand in a market is represented by the equation, P = 30 - .5QD.Suppose the market price is $18.(a) How many units do buyers wish to purchase in this market?
(b) What is the maximum amount that the buyers are willing to pay for this quantity of output?
(c) What is the actual amount that buyers have to pay for this quantity of output?
(d) What is the consumer surplus that buyers obtain from purchasing this quantity of output?
(b) What is the maximum amount that the buyers are willing to pay for this quantity of output?
(c) What is the actual amount that buyers have to pay for this quantity of output?
(d) What is the consumer surplus that buyers obtain from purchasing this quantity of output?
Unlock Deck
Unlock for access to all 36 flashcards in this deck.
Unlock Deck
k this deck
10
How is producer surplus derived from a supply curve?
Unlock Deck
Unlock for access to all 36 flashcards in this deck.
Unlock Deck
k this deck
11
Draw a market supply curve and indicate the following:
(a) The market price;
(b) The quantity supplied;
(c) The minimum amount that sellers are willing to accept for the quantity supplied;
(d) The actual amount that sellers receive for providing the quantity supplied;
(e) The producer surplus from providing the quantity supplied.
(a) The market price;
(b) The quantity supplied;
(c) The minimum amount that sellers are willing to accept for the quantity supplied;
(d) The actual amount that sellers receive for providing the quantity supplied;
(e) The producer surplus from providing the quantity supplied.
Unlock Deck
Unlock for access to all 36 flashcards in this deck.
Unlock Deck
k this deck
12
What is the meaning of Market Failures and how do the Demand and Supply curves cause such failures?
Unlock Deck
Unlock for access to all 36 flashcards in this deck.
Unlock Deck
k this deck
13
Explain the difference between a public and private good.Describe the rationale behind supply and demand analysis for public goods.
Unlock Deck
Unlock for access to all 36 flashcards in this deck.
Unlock Deck
k this deck
14
What is consumer surplus?
Unlock Deck
Unlock for access to all 36 flashcards in this deck.
Unlock Deck
k this deck
15
Supply in a market is represented by the equation, P = 20 + .1QS.Suppose the market price is $30.(a) How many units do sellers wish to provide in this market?
(b) What is the minimum amount that sellers are willing to accept for this quantity of output?
(c) What is the actual amount that sellers receive for providing for this quantity of output?
(d) What is the producer surplus that sellers obtain for providing this quantity of output?
(b) What is the minimum amount that sellers are willing to accept for this quantity of output?
(c) What is the actual amount that sellers receive for providing for this quantity of output?
(d) What is the producer surplus that sellers obtain for providing this quantity of output?
Unlock Deck
Unlock for access to all 36 flashcards in this deck.
Unlock Deck
k this deck
16
Imagine that a provincial government is considering the construction of a new office building to consolidate its operations.Its estimate of the total costs and the total benefits of building a 4- 6-, 8-, or 10-story building is shown in the table below.(All figures are in millions of dollars.)
(a) Compute the marginal cost and the marginal benefit of the 4-, 6-, 8-, and 10-story buildings.(b) Should the state build a new office building? If so, what size building and what will be the total benefit, total cost, and net benefit to society?
(a) Compute the marginal cost and the marginal benefit of the 4-, 6-, 8-, and 10-story buildings.(b) Should the state build a new office building? If so, what size building and what will be the total benefit, total cost, and net benefit to society? Unlock Deck
Unlock for access to all 36 flashcards in this deck.
Unlock Deck
k this deck
17
How are producer surplus and economic profit related?
Unlock Deck
Unlock for access to all 36 flashcards in this deck.
Unlock Deck
k this deck
18
Draw a market demand curve and indicate the following:
(a) The market price;
(b) The quantity demanded;
(c) The maximum amount that buyers are willing to pay for the quantity demanded;
(d) The actual amount that buyers must pay for the quantity demanded;
(e) The consumer surplus from obtaining the quantity demanded.
(a) The market price;
(b) The quantity demanded;
(c) The maximum amount that buyers are willing to pay for the quantity demanded;
(d) The actual amount that buyers must pay for the quantity demanded;
(e) The consumer surplus from obtaining the quantity demanded.
Unlock Deck
Unlock for access to all 36 flashcards in this deck.
Unlock Deck
k this deck
19
How does the market demand curve for a public good differ from the market demand curve for a private good?
Unlock Deck
Unlock for access to all 36 flashcards in this deck.
Unlock Deck
k this deck
20
What are the basic differences between a public good and a private good?
Unlock Deck
Unlock for access to all 36 flashcards in this deck.
Unlock Deck
k this deck
21
Assume the atmosphere of an urban area is able to reabsorb 4,000 tonnes of pollutants per year.The schedule below shows the price polluters would be willing to pay for the right to dispose of 1 tonne of pollutants per year and the total quantity of pollutants they would wish to dispose of at each price. (a) If there were no emission fee, how many tonnes of pollutants would there be and how much greater would this amount be than the capacity for re-absorption?
(b) What pollution fee should the urban authorities charge to solve the problem?
(c) What would happen in this market for pollution rights if quantity demanded increased by 1,000 tonnes at each price?
(a) If there were no emission fee, how many tonnes of pollutants would there be and how much greater would this amount be than the capacity for re-absorption?(b) What pollution fee should the urban authorities charge to solve the problem?
(c) What would happen in this market for pollution rights if quantity demanded increased by 1,000 tonnes at each price?
Unlock Deck
Unlock for access to all 36 flashcards in this deck.
Unlock Deck
k this deck
22
Describe how a market for externality rights would work in terms of supply and demand.
Unlock Deck
Unlock for access to all 36 flashcards in this deck.
Unlock Deck
k this deck
23
Evaluate: "Pollution is undesirable.Therefore, all pollution should be banned."
Unlock Deck
Unlock for access to all 36 flashcards in this deck.
Unlock Deck
k this deck
24
Draw a supply and demand graph on the below diagram that illustrates the market for pollution rights.Label the axes and curves.Then show what happens to price and quantity when the demand for pollution rights increases in the market.
Unlock Deck
Unlock for access to all 36 flashcards in this deck.
Unlock Deck
k this deck
25
What is the economic rationale for liability rules and lawsuits? What are the limitations with this approach?
Unlock Deck
Unlock for access to all 36 flashcards in this deck.
Unlock Deck
k this deck
26
Evaluate.Economy in government requires that government minimize its spending.
Unlock Deck
Unlock for access to all 36 flashcards in this deck.
Unlock Deck
k this deck
27
How could you use the Coase theorem to predict what would happen when smoke from a factory created dirty air and slightly acid rain for all the residents in the area in a one-kilometre radius of the plant?
Unlock Deck
Unlock for access to all 36 flashcards in this deck.
Unlock Deck
k this deck
28
What resource problem is created by positive externalities and what methods are suggested for dealing with this problem?
Unlock Deck
Unlock for access to all 36 flashcards in this deck.
Unlock Deck
k this deck
29
What are negative and positive externalities? How do they affect supply and demand curves?
Unlock Deck
Unlock for access to all 36 flashcards in this deck.
Unlock Deck
k this deck
30
How do direct controls and specific taxes affect negative externalities? Briefly explain in terms of supply and demand.
Unlock Deck
Unlock for access to all 36 flashcards in this deck.
Unlock Deck
k this deck
31
What are quasi-public goods and why does the government provide them?
Unlock Deck
Unlock for access to all 36 flashcards in this deck.
Unlock Deck
k this deck
32
What resource problem is created by negative externalities and what methods are suggested for dealing with this problem?
Unlock Deck
Unlock for access to all 36 flashcards in this deck.
Unlock Deck
k this deck
33
The demand and supply in a market are represented by the equations P = 50 - .2QD and P = 20 + .3QS.A spillover cost in production equal to $2 per unit exists in this market.(a) What are the equilibrium price and quantity?
(b) What are the optimal price and quantity?
(c) How large must a specific tax in this market be to eliminate the market failure? Is the tax equal to the difference between the equilibrium price and the optimal price?
(b) What are the optimal price and quantity?
(c) How large must a specific tax in this market be to eliminate the market failure? Is the tax equal to the difference between the equilibrium price and the optimal price?
Unlock Deck
Unlock for access to all 36 flashcards in this deck.
Unlock Deck
k this deck
34
The following table shows marginal costs and benefits of the optimal quantity of pollution abatement that will occur at a local factory. (a) What is the optimal level of pollution abatement? Why?
(b) If the marginal benefit of pollution abatement were to increase by $30,000 at each level because of the factory's desire to improve its image and environment, what would the optimal level be? Why?
(c) What might cause the optimal level of pollution abatement to be 400 tonnes?
(a) What is the optimal level of pollution abatement? Why?(b) If the marginal benefit of pollution abatement were to increase by $30,000 at each level because of the factory's desire to improve its image and environment, what would the optimal level be? Why?
(c) What might cause the optimal level of pollution abatement to be 400 tonnes?
Unlock Deck
Unlock for access to all 36 flashcards in this deck.
Unlock Deck
k this deck
35
Assume the atmosphere of an urban area is able to reabsorb 8,000 tonnes of pollutants per year.The schedule below shows the price polluters would be willing to pay for the right to dispose of 1 tonne of pollutants per year and the total quantity of pollutants they would wish to dispose of at each price. (a) If there were no emission fee, how many tonnes of pollutants would there be and how much greater would this amount be than the capacity for re-absorption?
(b) What pollution fee should the urban authorities charge to solve the problem?
(c) What would happen in this market for pollution rights if quantity demanded increased by 1,000 tonnes at each price?
(a) If there were no emission fee, how many tonnes of pollutants would there be and how much greater would this amount be than the capacity for re-absorption?(b) What pollution fee should the urban authorities charge to solve the problem?
(c) What would happen in this market for pollution rights if quantity demanded increased by 1,000 tonnes at each price?
Unlock Deck
Unlock for access to all 36 flashcards in this deck.
Unlock Deck
k this deck
36
The following table shows marginal costs and benefits of the optimal quantity of pollution abatement that will occur at a local factory. (a) What is the optimal level of pollution abatement? Why?
(b) If the marginal benefit of pollution abatement were to increase by $150,000 at each level because of the factory's desire to improve its image and environment, what would the optimal level be? Why?
(c) What might cause the optimal level of pollution abatement to be 120 tonnes?
(a) What is the optimal level of pollution abatement? Why?(b) If the marginal benefit of pollution abatement were to increase by $150,000 at each level because of the factory's desire to improve its image and environment, what would the optimal level be? Why?
(c) What might cause the optimal level of pollution abatement to be 120 tonnes?
Unlock Deck
Unlock for access to all 36 flashcards in this deck.
Unlock Deck
k this deck
Unlock Deck
Unlock for access to all 36 flashcards in this deck.


