Deck 12: Economic Efficiency and Public Policy
Full screen (f)
Question
The diagram below shows the demand and supply curves in a perfectly competitive market.  FIGURE 12- 5
Refer to Figure 12- 5. If output in this market were Q3, and the price was still equal to its
Free- market level, the loss in producer surplus relative to the competitive equilibrium would be illustrated by area
A) 3 + 4.
B) 4.
C) 1.
D) 2.
E) 3.
FIGURE 12- 5Refer to Figure 12- 5. If output in this market were Q3, and the price was still equal to its
Free- market level, the loss in producer surplus relative to the competitive equilibrium would be illustrated by area
A) 3 + 4.
B) 4.
C) 1.
D) 2.
E) 3.
Question
Question
Question
Question
 FIGURE 12- 3
Refer to Figure 12- 3. Comparing the monopoly equilibrium to the perfectly competitive equilibrium, the area P2P3CB represents
A) the net loss in the monopolist's profits.
B) the dead- weight loss of monopoly.
C) the net gain in the monopolist's profits.
D) a redistribution of income from the monopolist to the consumer.
E) a redistribution of income from consumers to the monopolist.
Question
Question
The diagram below shows the market demand curve and the cost curves for a single firm.  FIGURE 12- 6
Refer to Figure 12- 6. Suppose the firm is being regulated using a policy of average- cost pricing. The resulting price and output would be
A) P1 and Q2.
B) P3 and Q2.
C) P1 and Q1.
D) P2 and Q2.
E) P3 and Q1.
FIGURE 12- 6Refer to Figure 12- 6. Suppose the firm is being regulated using a policy of average- cost pricing. The resulting price and output would be
A) P1 and Q2.
B) P3 and Q2.
C) P1 and Q1.
D) P2 and Q2.
E) P3 and Q1.
Question
Question
Question
Question
Question
 FIGURE 12- 3
Refer to Figure 12- 3. The area representing producer surplus at the monopoly equilibrium is outlined by
A) P0P2BA.
B) P0AP1.
C) P2P4E.
D) P0P3CA.
E) 0P0Aq1.
Question
Question
Question
The diagram below shows the demand and supply curves in a perfectly competitive market.  FIGURE 12- 5
Refer to Figure 12- 5. At the free- market equilibrium, consumer surplus is represented by the area
A) P1P3E.
B) P1P2E.
C) 1 +2.
D) P2P3E.
E) 1 + 2 + 3 + 4.
FIGURE 12- 5Refer to Figure 12- 5. At the free- market equilibrium, consumer surplus is represented by the area
A) P1P3E.
B) P1P2E.
C) 1 +2.
D) P2P3E.
E) 1 + 2 + 3 + 4.
Question
Question
Question
Question
Consider three firms, A, B and C, all producing kilos of potatoes (per year) in a perfectly competitive market. The diagrams below show marginal cost curves for each of the three firms. 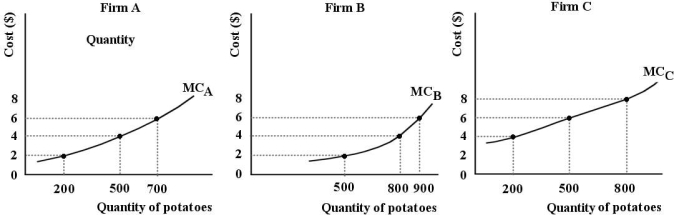 FIGURE 12- 1
Refer to Figure 12- 1. Suppose each of Firms A, B and C are producing 500 kilos of potatoes. Keeping total output unchanged, what level of output should each firm be producing such that the industry is productively efficient?
A) Firm A: 500 kilos, Firm B: 800 kilos, Firm C: 200 kilos
B) Firm A: 200 kilos, Firm B: 500 kilos, Firm C: 800 kilos
C) Firm A: 500 kilos, Firm B: 200 kilos, Firm C: 200 kilos
D) Firm A: 500 kilos, Firm B: 500 kilos, Firm C: 500 kilos
E) Firm A: 700 kilos, Firm B: 800 kilos, Firm C: 0 kilos
FIGURE 12- 1Refer to Figure 12- 1. Suppose each of Firms A, B and C are producing 500 kilos of potatoes. Keeping total output unchanged, what level of output should each firm be producing such that the industry is productively efficient?
A) Firm A: 500 kilos, Firm B: 800 kilos, Firm C: 200 kilos
B) Firm A: 200 kilos, Firm B: 500 kilos, Firm C: 800 kilos
C) Firm A: 500 kilos, Firm B: 200 kilos, Firm C: 200 kilos
D) Firm A: 500 kilos, Firm B: 500 kilos, Firm C: 500 kilos
E) Firm A: 700 kilos, Firm B: 800 kilos, Firm C: 0 kilos
Question
Question
The diagram below shows supply, demand, and quantity exchanged of Monday matinee movie tickets. Assume it is a perfectly competitive market.  FIGURE 12- 4
Refer to Figure 12- 4. What is the total revenue received by the sellers of this product at the allocatively efficient level of output?
A) $250
B) $125
C) $500
D) $375
E) $5
FIGURE 12- 4Refer to Figure 12- 4. What is the total revenue received by the sellers of this product at the allocatively efficient level of output?
A) $250
B) $125
C) $500
D) $375
E) $5
Question
Question
The diagram below shows cost and revenue curves for a natural monopoly producing electricity. Price is dollars per kilowatt hour and quantity is kilowatt hours per day.  FIGURE 12- 7
Refer to Figure 12- 7. Suppose this firm is being regulated using a policy of marginal- cost pricing. In this case, economic profits are equal to
A) $90 000.
B) - $28 000.
C) - $15 000.
D) $0.
E) - $50 000.
FIGURE 12- 7Refer to Figure 12- 7. Suppose this firm is being regulated using a policy of marginal- cost pricing. In this case, economic profits are equal to
A) $90 000.
B) - $28 000.
C) - $15 000.
D) $0.
E) - $50 000.
Question
Question
Question
The production possibilities boundary shows possible combinations of guns and butter that can be produced by a country. The lower diagram shows demand and supply for butter.  FIGURE 12- 2
Refer to Figure 12- 2. Suppose demand and supply for butter are shown by D and S, respectively. And suppose the economy is at point (a) on the production possibilities boundary. Is this output of guns and butter allocatively efficient?
A) No, because the marginal value to consumers of the butter produced is greater than the marginal cost to producers.
B) Yes, because the marginal cost of producing the butter equals the marginal value of consuming the butter.
C) No, because the marginal cost to producers of the butter produced is more than the marginal value to consumers.
D) No, because the marginal costs for guns and butter are not equated.
E) Yes, because all points on the production possibilities boundary are allocatively efficient.
FIGURE 12- 2Refer to Figure 12- 2. Suppose demand and supply for butter are shown by D and S, respectively. And suppose the economy is at point (a) on the production possibilities boundary. Is this output of guns and butter allocatively efficient?
A) No, because the marginal value to consumers of the butter produced is greater than the marginal cost to producers.
B) Yes, because the marginal cost of producing the butter equals the marginal value of consuming the butter.
C) No, because the marginal cost to producers of the butter produced is more than the marginal value to consumers.
D) No, because the marginal costs for guns and butter are not equated.
E) Yes, because all points on the production possibilities boundary are allocatively efficient.
Question
Question
Question
Question
Question
The diagram below shows cost and revenue curves for a natural monopoly producing electricity. Price is dollars per kilowatt hour and quantity is kilowatt hours per day.  FIGURE 12- 7
Refer to Figure 12- 7. Suppose this firm is being regulated using a policy of marginal- cost pricing. The resulting price and output would be per kwh and kwh per day.
A) $0.09; 1.4 million
B) $0.06; 1 million
C) $0.08; 1.5 million
D) $0.07; 1.5 million
E) $0.12; 1 million
FIGURE 12- 7Refer to Figure 12- 7. Suppose this firm is being regulated using a policy of marginal- cost pricing. The resulting price and output would be per kwh and kwh per day.
A) $0.09; 1.4 million
B) $0.06; 1 million
C) $0.08; 1.5 million
D) $0.07; 1.5 million
E) $0.12; 1 million
Question
Question
The diagram below shows supply, demand, and quantity exchanged of Monday matinee movie tickets. Assume it is a perfectly competitive market. 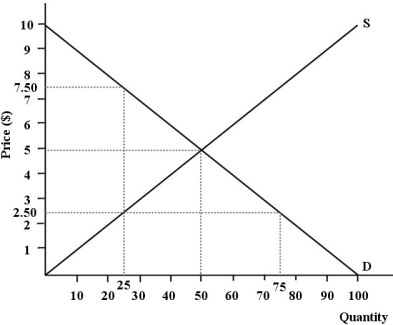 FIGURE 12- 4
Refer to Figure 12- 4. Suppose a disequilibrium price of $7.50 per movie ticket is imposed on this market. The total economic surplus is now _ , which is than the total economic surplus generated at the allocatively efficient level of output.
A) $187.50; $62.50 less
B) $125; $250 less
C) $62.50; $125 less
D) $125; $125 less
E) $187.50; $187.50 less
FIGURE 12- 4Refer to Figure 12- 4. Suppose a disequilibrium price of $7.50 per movie ticket is imposed on this market. The total economic surplus is now _ , which is than the total economic surplus generated at the allocatively efficient level of output.
A) $187.50; $62.50 less
B) $125; $250 less
C) $62.50; $125 less
D) $125; $125 less
E) $187.50; $187.50 less
Question
Question
Question
The diagram below shows supply, demand, and quantity exchanged of Monday matinee movie tickets. Assume it is a perfectly competitive market.  FIGURE 12- 4
Refer to Figure 12- 4. What is the value of the producer surplus generated in this market at the free- market equilibrium?
A) $10
B) $250
C) $0
D) $5
E) $125
FIGURE 12- 4Refer to Figure 12- 4. What is the value of the producer surplus generated in this market at the free- market equilibrium?
A) $10
B) $250
C) $0
D) $5
E) $125
Question
Question
Question
Question
The diagram below shows the market demand curve and the cost curves for a single firm.  FIGURE 12- 6
Refer to Figure 12- 6. Suppose this firm is being regulated using the policy of marginal- cost pricing. The resulting price and output would be
A) P1 and Q2.
B) P2 and Q2.
C) P1 and Q1.
D) P3 and Q2.
E) P3 and Q1.
FIGURE 12- 6Refer to Figure 12- 6. Suppose this firm is being regulated using the policy of marginal- cost pricing. The resulting price and output would be
A) P1 and Q2.
B) P2 and Q2.
C) P1 and Q1.
D) P3 and Q2.
E) P3 and Q1.
Question
 FIGURE 12- 3
Refer to Figure 12- 3. Comparing the perfectly competitive equilibrium to the monopoly equilibrium, the reduction in consumer surplus due to monopoly is outlined by
A) P2P3E.
B) BCE.
C) P2EP4.
D) P2ECP3.
E) q1CEq2.
Question
The diagram below shows the market demand curve and the cost curves for a single firm.  FIGURE 12- 6
Refer to Figure 12- 6. Suppose this firm is being regulated using a policy of marginal- cost pricing. In this case, the firm would experience represented by the area .
A) losses; 0P2bQ2
B) profits; P2P3ad
C) profits; edbc
D) losses; edbc
E) losses; P1P2bc
FIGURE 12- 6Refer to Figure 12- 6. Suppose this firm is being regulated using a policy of marginal- cost pricing. In this case, the firm would experience represented by the area .
A) losses; 0P2bQ2
B) profits; P2P3ad
C) profits; edbc
D) losses; edbc
E) losses; P1P2bc
Question
The diagram below shows the market demand curve and the cost curves for a single firm.  FIGURE 12- 6
Refer to Figure 12- 6. Suppose this firm is being regulated using a policy of marginal- cost pricing. To maintain the resulting level of output
A) the demand curve would have to shift down.
B) the government would have to accept the allocative inefficiency associated with this level of output.
C) the regulator would have to allow the firm to keep the monopoly profits at this level of output.
D) the government would have to subsidize the firm or it will eventually shut down.
E) the average total cost curve would have to shift up.
FIGURE 12- 6Refer to Figure 12- 6. Suppose this firm is being regulated using a policy of marginal- cost pricing. To maintain the resulting level of output
A) the demand curve would have to shift down.
B) the government would have to accept the allocative inefficiency associated with this level of output.
C) the regulator would have to allow the firm to keep the monopoly profits at this level of output.
D) the government would have to subsidize the firm or it will eventually shut down.
E) the average total cost curve would have to shift up.
Question
Question
Question
Question
Question
Question
Question
The diagram below shows the demand and supply curves in a perfectly competitive market. 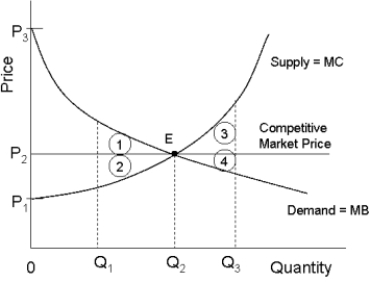 FIGURE 12- 5
Refer to Figure 12- 5. If output in this market were Q1, the total loss in economic surplus relative to the competitive equilibrium would be illustrated by area
A) P1P3E.
B) 1 + 2 + 3 + 4.
C) 1.
D) 2.
E) 1 + 2.
FIGURE 12- 5Refer to Figure 12- 5. If output in this market were Q1, the total loss in economic surplus relative to the competitive equilibrium would be illustrated by area
A) P1P3E.
B) 1 + 2 + 3 + 4.
C) 1.
D) 2.
E) 1 + 2.
Question
Question
The diagram below shows the demand and supply curves in a perfectly competitive market.  FIGURE 12- 5
Refer to Figure 12- 5. In the free- market equilibrium, producer plus consumer surplus is maximized and is illustrated by the area
A) 1 + 2 + 3 + 4.
B) P1P3E.
C) 1 + 2.
D) P1P2E.
E) P3P2E.
FIGURE 12- 5Refer to Figure 12- 5. In the free- market equilibrium, producer plus consumer surplus is maximized and is illustrated by the area
A) 1 + 2 + 3 + 4.
B) P1P3E.
C) 1 + 2.
D) P1P2E.
E) P3P2E.
Question
The diagram below shows the demand and supply curves in a perfectly competitive market.  FIGURE 12- 5
Refer to Figure 12- 5. If output in this market were Q3, the loss in total economic surplus relative to the competitive equilibrium would be illustrated by area
A) 2.
B) 1.
C) 4.
D) 3 + 4.
E) 3.
FIGURE 12- 5Refer to Figure 12- 5. If output in this market were Q3, the loss in total economic surplus relative to the competitive equilibrium would be illustrated by area
A) 2.
B) 1.
C) 4.
D) 3 + 4.
E) 3.
Question
Question
Question
Question
Question
Question
Question
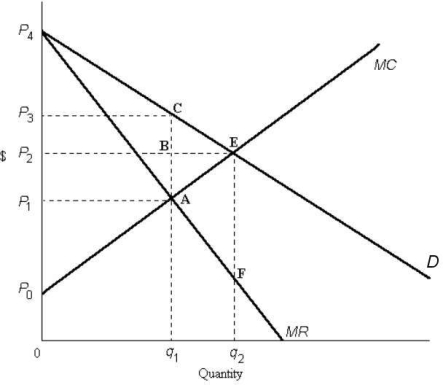 FIGURE 12- 3
Refer to Figure 12- 3. The area representing consumer surplus in a monopoly equilibrium is outlined by
A) 0P4Eq2.
B) P3P4C.
C) P2P4E.
D) ABE.
E) ACE.
Question
The diagram below shows the demand and supply curves in a perfectly competitive market.  FIGURE 12- 5
Refer to Figure 12- 5. If output in this market were Q3, and the price were still P2, the loss in consumer surplus relative to the competitive equilibrium would be illustrated by area
A) 3 + 4.
B) 1.
C) 3.
D) 4.
E) 2.
FIGURE 12- 5Refer to Figure 12- 5. If output in this market were Q3, and the price were still P2, the loss in consumer surplus relative to the competitive equilibrium would be illustrated by area
A) 3 + 4.
B) 1.
C) 3.
D) 4.
E) 2.
Question
The diagram below shows the market demand curve and the cost curves for a single firm.  FIGURE 12- 6
Refer to Figure 12- 6. Suppose this firm is being regulated using a policy of marginal- cost pricing. In this case,
A) allocative efficiency is achieved because price equals marginal cost.
B) allocative efficiency is achieved because profits are maximized.
C) the result is allocatively inefficient because the firm is suffering losses.
D) the result is allocatively inefficient because the marginal cost curve lies below the ATC curve.
E) the result is allocatively inefficient because the firm is earning profits.
FIGURE 12- 6Refer to Figure 12- 6. Suppose this firm is being regulated using a policy of marginal- cost pricing. In this case,
A) allocative efficiency is achieved because price equals marginal cost.
B) allocative efficiency is achieved because profits are maximized.
C) the result is allocatively inefficient because the firm is suffering losses.
D) the result is allocatively inefficient because the marginal cost curve lies below the ATC curve.
E) the result is allocatively inefficient because the firm is earning profits.
Question
Question
The diagram below shows supply, demand, and quantity exchanged of Monday matinee movie tickets. Assume it is a perfectly competitive market.  FIGURE 12- 4
Refer to Figure 12- 4. If a disequilibrium price of $7.50 per movie ticket were imposed on this market, this market would not be allocatively efficient because
1) the sum of consumer and producer surplus would not be maximized;
2) the marginal benefit to consumers of the last movie consumed would be greater than the marginal cost to the seller;
3) the marginal cost to the seller of the last movie consumed would be more than the marginal benefit to consumers.
A) 2 only
B) 1 only
C) 3 only
D) 1 and 2
E) 2 and 3
FIGURE 12- 4Refer to Figure 12- 4. If a disequilibrium price of $7.50 per movie ticket were imposed on this market, this market would not be allocatively efficient because
1) the sum of consumer and producer surplus would not be maximized;
2) the marginal benefit to consumers of the last movie consumed would be greater than the marginal cost to the seller;
3) the marginal cost to the seller of the last movie consumed would be more than the marginal benefit to consumers.
A) 2 only
B) 1 only
C) 3 only
D) 1 and 2
E) 2 and 3
Question
The diagram below shows the market demand curve and the cost curves for a single firm. 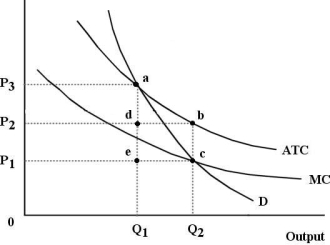 FIGURE 12- 6
Refer to Figure 12- 6. Suppose this firm is being regulated using a policy of average- cost pricing. In this case, economic profits to the firm are represented by the area
A) P2P3ad
B) P1P2bc
C) 0P3aQ1
D) P2P3ab
E) there are no economic profits.
FIGURE 12- 6Refer to Figure 12- 6. Suppose this firm is being regulated using a policy of average- cost pricing. In this case, economic profits to the firm are represented by the area
A) P2P3ad
B) P1P2bc
C) 0P3aQ1
D) P2P3ab
E) there are no economic profits.
Question
The diagram below shows the demand and supply curves in a perfectly competitive market.  FIGURE 12- 5
Refer to Figure 12- 5. Allocative efficiency occurs
A) where the areas 1, 2, 3, and 4 are maximized.
B) at the higher output Q3.
C) at price P1 and output Q3.
D) at price P2 and output Q2.
E) at the lower output Q1.
FIGURE 12- 5Refer to Figure 12- 5. Allocative efficiency occurs
A) where the areas 1, 2, 3, and 4 are maximized.
B) at the higher output Q3.
C) at price P1 and output Q3.
D) at price P2 and output Q2.
E) at the lower output Q1.
Question
Question
The diagram below shows cost and revenue curves for a natural monopoly producing electricity. Price is dollars per kilowatt hour and quantity is kilowatt hours per day.  FIGURE 12- 7
Refer to Figure 12- 7. If this firm were unregulated and profit maximizing, its profit would be
Per day.
A) $60 000
B) $120 000
C) $110 000
D) $0
E) $10 000
FIGURE 12- 7Refer to Figure 12- 7. If this firm were unregulated and profit maximizing, its profit would be
Per day.
A) $60 000
B) $120 000
C) $110 000
D) $0
E) $10 000
Question
Question
Question
The production possibilities boundary shows possible combinations of guns and butter that can be produced by a country. The lower diagram shows demand and supply for butter. 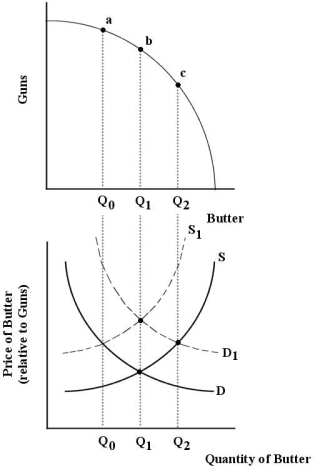 FIGURE 12- 2
Refer to Figure 12- 2. Suppose demand and supply for butter are shown by D and S, respectively. And suppose the economy is at point (a) on the production possibilities boundary. How can this economy move toward allocative efficiency?
A) produce more butter, less guns.
B) increase the demand for butter.
C) produce less butter, more guns.
D) expand the production possibilities boundary outward.
E) increase the supply of guns.
FIGURE 12- 2Refer to Figure 12- 2. Suppose demand and supply for butter are shown by D and S, respectively. And suppose the economy is at point (a) on the production possibilities boundary. How can this economy move toward allocative efficiency?
A) produce more butter, less guns.
B) increase the demand for butter.
C) produce less butter, more guns.
D) expand the production possibilities boundary outward.
E) increase the supply of guns.
Question
The production possibilities boundary shows possible combinations of guns and butter that can be produced by a country. The lower diagram shows demand and supply for butter.  FIGURE 12- 2
Refer to Figure 12- 2. Suppose this economy is allocatively efficient at Q1 units of butter. Now suppose there is an increase in demand for butter from D to D1. After this shift in demand,
A) the price of guns (relative to the price of butter) rises and the economy moves to point (a) on the PPB.
B) the marginal value to consumers of butter is greater than the marginal cost to producers; the price of butter (relative to the price of guns) rises; the economy moves to output Q2 of butter and point (c) on the PPB.
C) the supply curve will shift up to S1 and allocative efficiency will be maintained.
D) the marginal value to consumers of butter is less than the marginal cost to producers; the price of butter (relative to the price of guns) rises; the economy moves to output Q2 of butter and point (c) on the PPB.
E) the increase in the price of butter (relative to the price of guns) will cause the demand curve to shift back down to D and allocative efficiency will be maintained.
FIGURE 12- 2Refer to Figure 12- 2. Suppose this economy is allocatively efficient at Q1 units of butter. Now suppose there is an increase in demand for butter from D to D1. After this shift in demand,
A) the price of guns (relative to the price of butter) rises and the economy moves to point (a) on the PPB.
B) the marginal value to consumers of butter is greater than the marginal cost to producers; the price of butter (relative to the price of guns) rises; the economy moves to output Q2 of butter and point (c) on the PPB.
C) the supply curve will shift up to S1 and allocative efficiency will be maintained.
D) the marginal value to consumers of butter is less than the marginal cost to producers; the price of butter (relative to the price of guns) rises; the economy moves to output Q2 of butter and point (c) on the PPB.
E) the increase in the price of butter (relative to the price of guns) will cause the demand curve to shift back down to D and allocative efficiency will be maintained.
Question
The diagram below shows cost and revenue curves for a natural monopoly producing electricity. Price is dollars per kilowatt hour and quantity is kilowatt hours per day. 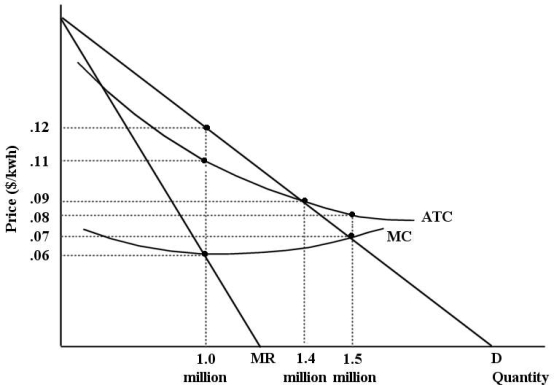 FIGURE 12- 7
Refer to Figure 12- 7. Suppose this firm is being regulated using a policy of average- cost pricing. The resulting price and output would be per kwh and kwh per day.
A) $0.11; 1 million
B) $0.09; 1.4 million
C) $0.07; 1.5 million
D) $0.06; 1 million
E) $0.12; 1 million
FIGURE 12- 7Refer to Figure 12- 7. Suppose this firm is being regulated using a policy of average- cost pricing. The resulting price and output would be per kwh and kwh per day.
A) $0.11; 1 million
B) $0.09; 1.4 million
C) $0.07; 1.5 million
D) $0.06; 1 million
E) $0.12; 1 million
Question
The diagram below shows the demand and supply curves in a perfectly competitive market.  FIGURE 12- 5
Refer to Figure 12- 5. If output in this market were Q1, and the price were still equal to its
Free- market level, the loss in producer surplus relative to the competitive equilibrium would be illustrated by area
A) P3P2E.
B) P1P3E.
C) 2.
D) 1.
E) 1 + 2.
FIGURE 12- 5Refer to Figure 12- 5. If output in this market were Q1, and the price were still equal to its
Free- market level, the loss in producer surplus relative to the competitive equilibrium would be illustrated by area
A) P3P2E.
B) P1P3E.
C) 2.
D) 1.
E) 1 + 2.
Question
The diagram below shows supply, demand, and quantity exchanged of Monday matinee movie tickets. Assume it is a perfectly competitive market.  FIGURE 12- 4
Refer to Figure 12- 4. What is the total economic surplus generated in this market at the allocatively efficient level of output?
A) $500
B) $125
C) $250
D) $5
E) $10
FIGURE 12- 4Refer to Figure 12- 4. What is the total economic surplus generated in this market at the allocatively efficient level of output?
A) $500
B) $125
C) $250
D) $5
E) $10
Question
Question
Question
The diagram below shows supply, demand, and quantity exchanged of Monday matinee movie tickets. Assume it is a perfectly competitive market.  FIGURE 12- 4
Refer to Figure 12- 4. Suppose a disequilibrium price of $7.50 per movie ticket is imposed in this market. The consumer surplus becomes _ and the producer surplus becomes .
A) $2.50; $7.50
B) $62.50; $250
C) $62.50; $125
D) $0; $62.50
E) $31.25; $156.25
FIGURE 12- 4Refer to Figure 12- 4. Suppose a disequilibrium price of $7.50 per movie ticket is imposed in this market. The consumer surplus becomes _ and the producer surplus becomes .
A) $2.50; $7.50
B) $62.50; $250
C) $62.50; $125
D) $0; $62.50
E) $31.25; $156.25
Question
 FIGURE 12- 3
Refer to Figure 12- 3. The area representing consumer surplus in a perfectly competitive equilibrium is outlined by
A) P2P4E.
B) P3P4C.
C) ACE.
D) ABE.
E) 0P4Eq2.
Question

Unlock Deck
Sign up to unlock the cards in this deck!
Unlock Deck
Unlock Deck
1/109
Play
Full screen (f)
Deck 12: Economic Efficiency and Public Policy
1
The diagram below shows the demand and supply curves in a perfectly competitive market. FIGURE 12- 5
Refer to Figure 12- 5. If output in this market were Q3, and the price was still equal to its
Free- market level, the loss in producer surplus relative to the competitive equilibrium would be illustrated by area
A) 3 + 4.
B) 4.
C) 1.
D) 2.
E) 3.
FIGURE 12- 5Refer to Figure 12- 5. If output in this market were Q3, and the price was still equal to its
Free- market level, the loss in producer surplus relative to the competitive equilibrium would be illustrated by area
A) 3 + 4.
B) 4.
C) 1.
D) 2.
E) 3.
E
2
If the total output of some industry is allocated among its individual firms in such a way that the total cost of producing the industry's output is minimized, the industry will achieve
1) full employment of resources;
2) productive efficiency;
3) allocative efficiency.
A) 1 only
B) 2 only
C) 3 only
D) both 1 and 3
E) both 2 and 3
1) full employment of resources;
2) productive efficiency;
3) allocative efficiency.
A) 1 only
B) 2 only
C) 3 only
D) both 1 and 3
E) both 2 and 3
B
3
Choose the statement that best compares the long- run equilibrium of a competitive industry and that in a monopolized industry.
A) It is not possible to make this comparison because firms in a competitive industry operate only in the short run.
B) Allocative efficiency will be achieved in the monopolized, but not the competitive industry.
C) Allocative efficiency is not possible in either industry.
D) Allocative efficiency will be achieved in the competitive, but not the monopolized industry.
E) Resources will be allocated efficiently in both the competitive and monopolized industries.
D
4
All points on a country's production possibilities boundary are
A) productively efficient.
B) Pareto optimal.
C) not productively efficient.
D) points at which P = MC for all goods.
E) allocatively efficient.
A) productively efficient.
B) Pareto optimal.
C) not productively efficient.
D) points at which P = MC for all goods.
E) allocatively efficient.
Unlock Deck
Unlock for access to all 109 flashcards in this deck.
Unlock Deck
k this deck
5
FIGURE 12- 3Refer to Figure 12- 3. Comparing the monopoly equilibrium to the perfectly competitive equilibrium, the area P2P3CB represents
A) the net loss in the monopolist's profits.
B) the dead- weight loss of monopoly.
C) the net gain in the monopolist's profits.
D) a redistribution of income from the monopolist to the consumer.
E) a redistribution of income from consumers to the monopolist.
Unlock Deck
Unlock for access to all 109 flashcards in this deck.
Unlock Deck
k this deck
6
Monopoly is allocatively inefficient because
A) the price exceeds the marginal cost of the last unit produced.
B) the firm has no incentive to maximize profits.
C) the opportunity cost exceeds the marginal cost of the last unit produced.
D) the marginal cost exceeds the average cost for the last unit produced.
E) lower costs could be achieved.
Unlock Deck
Unlock for access to all 109 flashcards in this deck.
Unlock Deck
k this deck
7
The diagram below shows the market demand curve and the cost curves for a single firm. FIGURE 12- 6
Refer to Figure 12- 6. Suppose the firm is being regulated using a policy of average- cost pricing. The resulting price and output would be
A) P1 and Q2.
B) P3 and Q2.
C) P1 and Q1.
D) P2 and Q2.
E) P3 and Q1.
FIGURE 12- 6Refer to Figure 12- 6. Suppose the firm is being regulated using a policy of average- cost pricing. The resulting price and output would be
A) P1 and Q2.
B) P3 and Q2.
C) P1 and Q1.
D) P2 and Q2.
E) P3 and Q1.
Unlock Deck
Unlock for access to all 109 flashcards in this deck.
Unlock Deck
k this deck
8
Choose the statement that best describes the dilemma facing the regulator of a natural monopoly.
A) marginal- cost pricing leads to profit or losses; average- cost pricing results in allocative inefficiency
B) there is no dilemma
C) marginal- cost pricing will result in productive and allocative inefficiency; average- cost pricing will not
D) both kinds of regulation have the same implications for allocative efficiency.
E) marginal- cost pricing will result in allocative inefficiency; average- cost pricing leads to profits or losses
Unlock Deck
Unlock for access to all 109 flashcards in this deck.
Unlock Deck
k this deck
9
In many cases throughout Canadian history, governments have sought to control the behaviour of oligopolistic firms through either ownership or regulation. Policymakers are now skeptical of such practices because
1) many innovations in products and production methods that have led to increases in living standards are attributable to firms in oligopolistic industries;
2) it became clear that oligopolistic industries can achieve both productive and allocative efficiency without government intervention;
3) the regulatory body often ends up protecting the firms from competition.
A) 2 only
B) 3 only
C) 1 and 2
D) 1 and 3
E) 1 only
Unlock Deck
Unlock for access to all 109 flashcards in this deck.
Unlock Deck
k this deck
10
Suppose we compare two monopolists with identical cost and demand conditions. Monopolist A charges a single price. Monopolist B engages in price discrimination, charging a different price for different units of the product. Which one of the following statements is correct?
A) B will generally produce more than A, resulting in less deadweight loss.
B) A will produce less than B, resulting in smaller deadweight loss.
C) A and B will both produce the same amount.
D) A will produce more than B, resulting in larger deadweight loss.
E) B will produce less than A, resulting in a larger deadweight loss.
Unlock Deck
Unlock for access to all 109 flashcards in this deck.
Unlock Deck
k this deck
11
In general, the sum of consumer and producer surplus is maximized under the conditions of
A) perfect competition.
B) monopoly.
C) any market structure.
D) oligopoly.
E) monopolistic competition.
A) perfect competition.
B) monopoly.
C) any market structure.
D) oligopoly.
E) monopolistic competition.
Unlock Deck
Unlock for access to all 109 flashcards in this deck.
Unlock Deck
k this deck
12
FIGURE 12- 3Refer to Figure 12- 3. The area representing producer surplus at the monopoly equilibrium is outlined by
A) P0P2BA.
B) P0AP1.
C) P2P4E.
D) P0P3CA.
E) 0P0Aq1.
Unlock Deck
Unlock for access to all 109 flashcards in this deck.
Unlock Deck
k this deck
13
For an entire economy, allocative efficiency requires that
A) MRP is equated for all factors of production.
B) goods are allocated equitably across markets.
C) MC = P for all goods.
D) price is greater than marginal cost for all goods.
E) price equals average cost for all goods.
A) MRP is equated for all factors of production.
B) goods are allocated equitably across markets.
C) MC = P for all goods.
D) price is greater than marginal cost for all goods.
E) price equals average cost for all goods.
Unlock Deck
Unlock for access to all 109 flashcards in this deck.
Unlock Deck
k this deck
14
Suppose your municipality charges your household a flat fee of $100 per year plus $2 per cubic metre of water used. This pricing policy is an example of
A) a two- part tariff.
B) marginal- cost pricing.
C) linear pricing.
D) utility pricing.
E) average cost pricing.
A) a two- part tariff.
B) marginal- cost pricing.
C) linear pricing.
D) utility pricing.
E) average cost pricing.
Unlock Deck
Unlock for access to all 109 flashcards in this deck.
Unlock Deck
k this deck
15
The diagram below shows the demand and supply curves in a perfectly competitive market. FIGURE 12- 5
Refer to Figure 12- 5. At the free- market equilibrium, consumer surplus is represented by the area
A) P1P3E.
B) P1P2E.
C) 1 +2.
D) P2P3E.
E) 1 + 2 + 3 + 4.
FIGURE 12- 5Refer to Figure 12- 5. At the free- market equilibrium, consumer surplus is represented by the area
A) P1P3E.
B) P1P2E.
C) 1 +2.
D) P2P3E.
E) 1 + 2 + 3 + 4.
Unlock Deck
Unlock for access to all 109 flashcards in this deck.
Unlock Deck
k this deck
16
In the absence of market failures, allocative efficiency is achieved in a perfectly competitive industry because
A) firms do not need to maximize profits.
B) the industry produces a level of output such that there are increasing returns to scale.
C) the industry produces a level of output such that the marginal cost to producers equals the marginal benefit to consumers.
D) there are barriers to entry.
E) the industry produces a level of output such that the marginal cost of production is minimized.
Unlock Deck
Unlock for access to all 109 flashcards in this deck.
Unlock Deck
k this deck
17
Consider a regulated natural monopoly, such as an electricity distribution company, that faces falling long- run average costs. If it is forced to price its output at average cost it will provide
A) less output than what is socially optimal.
B) so little output that there will be a shortage.
C) the socially optimal amount of output.
D) more output than what is socially optimal.
E) more output than can be absorbed by the market.
A) less output than what is socially optimal.
B) so little output that there will be a shortage.
C) the socially optimal amount of output.
D) more output than what is socially optimal.
E) more output than can be absorbed by the market.
Unlock Deck
Unlock for access to all 109 flashcards in this deck.
Unlock Deck
k this deck
18
In the long run, the imposition of average- cost pricing in natural monopolies, such as Manitoba Hydro and New Brunswick Power, would generally lead to
A) a reduction in the output by these firms.
B) allocative efficiency.
C) distorted investment decisions.
D) productive efficiency.
E) both allocative efficiency and productive efficiency.
A) a reduction in the output by these firms.
B) allocative efficiency.
C) distorted investment decisions.
D) productive efficiency.
E) both allocative efficiency and productive efficiency.
Unlock Deck
Unlock for access to all 109 flashcards in this deck.
Unlock Deck
k this deck
19
Consider three firms, A, B and C, all producing kilos of potatoes (per year) in a perfectly competitive market. The diagrams below show marginal cost curves for each of the three firms. FIGURE 12- 1
Refer to Figure 12- 1. Suppose each of Firms A, B and C are producing 500 kilos of potatoes. Keeping total output unchanged, what level of output should each firm be producing such that the industry is productively efficient?
A) Firm A: 500 kilos, Firm B: 800 kilos, Firm C: 200 kilos
B) Firm A: 200 kilos, Firm B: 500 kilos, Firm C: 800 kilos
C) Firm A: 500 kilos, Firm B: 200 kilos, Firm C: 200 kilos
D) Firm A: 500 kilos, Firm B: 500 kilos, Firm C: 500 kilos
E) Firm A: 700 kilos, Firm B: 800 kilos, Firm C: 0 kilos
FIGURE 12- 1Refer to Figure 12- 1. Suppose each of Firms A, B and C are producing 500 kilos of potatoes. Keeping total output unchanged, what level of output should each firm be producing such that the industry is productively efficient?
A) Firm A: 500 kilos, Firm B: 800 kilos, Firm C: 200 kilos
B) Firm A: 200 kilos, Firm B: 500 kilos, Firm C: 800 kilos
C) Firm A: 500 kilos, Firm B: 200 kilos, Firm C: 200 kilos
D) Firm A: 500 kilos, Firm B: 500 kilos, Firm C: 500 kilos
E) Firm A: 700 kilos, Firm B: 800 kilos, Firm C: 0 kilos
Unlock Deck
Unlock for access to all 109 flashcards in this deck.
Unlock Deck
k this deck
20
When comparing a perfectly competitive firm and a (single- price) monopolist, a major difference is that
A) the perfect competitor achieves productive efficiency, but the monopolist does not.
B) the monopolist produces where MR = MC, but the perfect competitor does not.
C) the monopolist achieves allocative efficiency but the perfect competitor does not.
D) the perfect competitor minimizes its costs, but the monopolist does not.
E) the perfect competitor produces where P = MC, but the monopolist does not.
Unlock Deck
Unlock for access to all 109 flashcards in this deck.
Unlock Deck
k this deck
21
The diagram below shows supply, demand, and quantity exchanged of Monday matinee movie tickets. Assume it is a perfectly competitive market. FIGURE 12- 4
Refer to Figure 12- 4. What is the total revenue received by the sellers of this product at the allocatively efficient level of output?
A) $250
B) $125
C) $500
D) $375
E) $5
FIGURE 12- 4Refer to Figure 12- 4. What is the total revenue received by the sellers of this product at the allocatively efficient level of output?
A) $250
B) $125
C) $500
D) $375
E) $5
Unlock Deck
Unlock for access to all 109 flashcards in this deck.
Unlock Deck
k this deck
22
In Canada, a significant challenge for the Competition Bureau when reviewing a possible merger between firms in a concentrated industry is to
A) impose effective entry barriers to the industry.
B) determine whether monopoly no longer poses a threat to the Canadian economy.
C) determine whether efficiency gains make the merger desirable.
D) allow those mergers that lead to larger firms that are easier to regulate.
E) determine whether criminal charges are required due to unlawful collusion.
Unlock Deck
Unlock for access to all 109 flashcards in this deck.
Unlock Deck
k this deck
23
The diagram below shows cost and revenue curves for a natural monopoly producing electricity. Price is dollars per kilowatt hour and quantity is kilowatt hours per day. FIGURE 12- 7
Refer to Figure 12- 7. Suppose this firm is being regulated using a policy of marginal- cost pricing. In this case, economic profits are equal to
A) $90 000.
B) - $28 000.
C) - $15 000.
D) $0.
E) - $50 000.
FIGURE 12- 7Refer to Figure 12- 7. Suppose this firm is being regulated using a policy of marginal- cost pricing. In this case, economic profits are equal to
A) $90 000.
B) - $28 000.
C) - $15 000.
D) $0.
E) - $50 000.
Unlock Deck
Unlock for access to all 109 flashcards in this deck.
Unlock Deck
k this deck
24
Productive efficiency for an individual firm requires that
A) all resources be fully used.
B) P = ATC for all goods.
C) the firm be allocatively efficient.
D) MC = P for all goods.
E) the firm be on its LRAC curve.
A) all resources be fully used.
B) P = ATC for all goods.
C) the firm be allocatively efficient.
D) MC = P for all goods.
E) the firm be on its LRAC curve.
Unlock Deck
Unlock for access to all 109 flashcards in this deck.
Unlock Deck
k this deck
25
An allowable defense for a merger according to Canada's Competition Bureau is that
A) merging firms find it easier to decide how they will share the market.
B) merging firms are more profitable because they no longer have to compete with one another.
C) larger firms are easier to regulate.
D) merged and therefore bigger firms are better placed to compete globally.
E) the gains in efficiency resulting from the merger more than offset any reductions in competition.
Unlock Deck
Unlock for access to all 109 flashcards in this deck.
Unlock Deck
k this deck
26
The production possibilities boundary shows possible combinations of guns and butter that can be produced by a country. The lower diagram shows demand and supply for butter. FIGURE 12- 2
Refer to Figure 12- 2. Suppose demand and supply for butter are shown by D and S, respectively. And suppose the economy is at point (a) on the production possibilities boundary. Is this output of guns and butter allocatively efficient?
A) No, because the marginal value to consumers of the butter produced is greater than the marginal cost to producers.
B) Yes, because the marginal cost of producing the butter equals the marginal value of consuming the butter.
C) No, because the marginal cost to producers of the butter produced is more than the marginal value to consumers.
D) No, because the marginal costs for guns and butter are not equated.
E) Yes, because all points on the production possibilities boundary are allocatively efficient.
FIGURE 12- 2Refer to Figure 12- 2. Suppose demand and supply for butter are shown by D and S, respectively. And suppose the economy is at point (a) on the production possibilities boundary. Is this output of guns and butter allocatively efficient?
A) No, because the marginal value to consumers of the butter produced is greater than the marginal cost to producers.
B) Yes, because the marginal cost of producing the butter equals the marginal value of consuming the butter.
C) No, because the marginal cost to producers of the butter produced is more than the marginal value to consumers.
D) No, because the marginal costs for guns and butter are not equated.
E) Yes, because all points on the production possibilities boundary are allocatively efficient.
Unlock Deck
Unlock for access to all 109 flashcards in this deck.
Unlock Deck
k this deck
27
Regulated monopolies that face rising long- run costs and which are forced to price their output at average cost will provide
A) less output than what is socially optimal.
B) the socially optimal amount of output.
C) more output than what is socially optimal.
D) more output than what can be absorbed by the market.
E) so little output that there will be a shortage.
A) less output than what is socially optimal.
B) the socially optimal amount of output.
C) more output than what is socially optimal.
D) more output than what can be absorbed by the market.
E) so little output that there will be a shortage.
Unlock Deck
Unlock for access to all 109 flashcards in this deck.
Unlock Deck
k this deck
28
In principle, a comparison of the long- run equilibrium of competitive and (single- price) monopoly industries leads to the following conclusion:
A) the competitive industry is consistent with allocative efficiency whereas the monopoly is not.
B) neither industry is capable of allocative efficiency.
C) the competitive industry will achieve productive efficiency but the monopoly will not.
D) both the competitive industry and the monopoly will allocate resources inefficiently.
E) both the competitive industry and the monopoly will allocate resources efficiently.
Unlock Deck
Unlock for access to all 109 flashcards in this deck.
Unlock Deck
k this deck
29
A monopolist's pricing and output behaviour
A) increases both consumer and producer surplus.
B) reduces both consumer and producer surplus.
C) increases the sum of consumer and producer surplus.
D) reduces producer surplus and increases consumer surplus.
E) reduces the sum of consumer and producer surplus.
A) increases both consumer and producer surplus.
B) reduces both consumer and producer surplus.
C) increases the sum of consumer and producer surplus.
D) reduces producer surplus and increases consumer surplus.
E) reduces the sum of consumer and producer surplus.
Unlock Deck
Unlock for access to all 109 flashcards in this deck.
Unlock Deck
k this deck
30
There has been a trend toward less government regulation and ownership in oligopolistic industries in most industrialized countries since the 1980s. One reason for this is
A) domestic firms are now exposed to more international competition due to falling transportation and communication costs.
B) policymakers came to understand that many oligopolistic firms were producing output levels that resulted in allocative efficiency.
C) policymakers came to understand that many oligopolistic firms were operating at their minimum efficient scale, thereby producing an efficient outcome.
D) Canada's Competition Bureau, and similar agencies in other countries were so successful at promoting competition that such regulation is no longer required.
E) policymakers realized that they did not have effective tools for promoting efficiency.
Unlock Deck
Unlock for access to all 109 flashcards in this deck.
Unlock Deck
k this deck
31
The diagram below shows cost and revenue curves for a natural monopoly producing electricity. Price is dollars per kilowatt hour and quantity is kilowatt hours per day. FIGURE 12- 7
Refer to Figure 12- 7. Suppose this firm is being regulated using a policy of marginal- cost pricing. The resulting price and output would be per kwh and kwh per day.
A) $0.09; 1.4 million
B) $0.06; 1 million
C) $0.08; 1.5 million
D) $0.07; 1.5 million
E) $0.12; 1 million
FIGURE 12- 7Refer to Figure 12- 7. Suppose this firm is being regulated using a policy of marginal- cost pricing. The resulting price and output would be per kwh and kwh per day.
A) $0.09; 1.4 million
B) $0.06; 1 million
C) $0.08; 1.5 million
D) $0.07; 1.5 million
E) $0.12; 1 million
Unlock Deck
Unlock for access to all 109 flashcards in this deck.
Unlock Deck
k this deck
32
Which of the following is the definition of producer surplus?
A) the price of a good minus the marginal cost of producing it, summed over the quantity produced.
B) quantity produced in excess of the allocatively efficient amount.
C) the total revenue received by the producer for a good minus the total cost of producing that good.
D) the price of a good minus the cost of producing it.
E) the revenue received for a good, minus the cost of producing it.
Unlock Deck
Unlock for access to all 109 flashcards in this deck.
Unlock Deck
k this deck
33
The diagram below shows supply, demand, and quantity exchanged of Monday matinee movie tickets. Assume it is a perfectly competitive market. FIGURE 12- 4
Refer to Figure 12- 4. Suppose a disequilibrium price of $7.50 per movie ticket is imposed on this market. The total economic surplus is now _ , which is than the total economic surplus generated at the allocatively efficient level of output.
A) $187.50; $62.50 less
B) $125; $250 less
C) $62.50; $125 less
D) $125; $125 less
E) $187.50; $187.50 less
FIGURE 12- 4Refer to Figure 12- 4. Suppose a disequilibrium price of $7.50 per movie ticket is imposed on this market. The total economic surplus is now _ , which is than the total economic surplus generated at the allocatively efficient level of output.
A) $187.50; $62.50 less
B) $125; $250 less
C) $62.50; $125 less
D) $125; $125 less
E) $187.50; $187.50 less
Unlock Deck
Unlock for access to all 109 flashcards in this deck.
Unlock Deck
k this deck
34
Suppose a cell- phone service provider has monopoly rights for a geographical region and is earning monopoly profits. If the government then imposes a lump- sum tax of $X on this firm, the effect is
A) to increase the firm's average costs and reduce its profit by $X.
B) an increase in output and a decrease in price.
C) a reduction in output and an increase in price.
D) to increase the firm's marginal costs and reduce its profit by $X.
E) an increase in consumer surplus due to the tax revenue.
A) to increase the firm's average costs and reduce its profit by $X.
B) an increase in output and a decrease in price.
C) a reduction in output and an increase in price.
D) to increase the firm's marginal costs and reduce its profit by $X.
E) an increase in consumer surplus due to the tax revenue.
Unlock Deck
Unlock for access to all 109 flashcards in this deck.
Unlock Deck
k this deck
35
Canadian governments (federal, provincial and municipal) employ public ownership or regulation of industries in an effort to
A) protect consumers from the high prices and restricted output associated with monopoly power.
B) produce a more equitable distribution of income between consumers and producers with monopoly power.
C) transfer monopoly profits from private firm owners to the government.
D) ensure that the goal of profit maximization is being pursued because this ensures allocative efficiency.
E) promote productive efficiency in all industries.
Unlock Deck
Unlock for access to all 109 flashcards in this deck.
Unlock Deck
k this deck
36
The diagram below shows supply, demand, and quantity exchanged of Monday matinee movie tickets. Assume it is a perfectly competitive market. FIGURE 12- 4
Refer to Figure 12- 4. What is the value of the producer surplus generated in this market at the free- market equilibrium?
A) $10
B) $250
C) $0
D) $5
E) $125
FIGURE 12- 4Refer to Figure 12- 4. What is the value of the producer surplus generated in this market at the free- market equilibrium?
A) $10
B) $250
C) $0
D) $5
E) $125
Unlock Deck
Unlock for access to all 109 flashcards in this deck.
Unlock Deck
k this deck
37
The deadweight loss of monopoly is
A) the loss of economic surplus due to the low monopoly output level.
B) any negative profit due to cyclical decreases in demand.
C) the cost of maintaining effective barriers to entry.
D) its fixed cost.
E) the extra administrative costs of operating a large firm.
A) the loss of economic surplus due to the low monopoly output level.
B) any negative profit due to cyclical decreases in demand.
C) the cost of maintaining effective barriers to entry.
D) its fixed cost.
E) the extra administrative costs of operating a large firm.
Unlock Deck
Unlock for access to all 109 flashcards in this deck.
Unlock Deck
k this deck
38
Consumer surplus represents
A) the marginal value that consumers place on the last unit consumed of a good.
B) the value that consumers place on the last unit consumed of a good.
C) the quantity consumed in excess of the allocatively efficient amount.
D) the total value that consumers place on the quantity consumed of some good.
E) the difference between the value that consumers place on a good and the payment they make to buy the good, summed over the quantity consumed.
Unlock Deck
Unlock for access to all 109 flashcards in this deck.
Unlock Deck
k this deck
39
Which of the following is an example of an industry that succeeds in restricting entry, thereby maintaining prices above competitive levels?
A) beef cattle ranching
B) transport trucking
C) window washing
D) book publishing
E) dentistry
A) beef cattle ranching
B) transport trucking
C) window washing
D) book publishing
E) dentistry
Unlock Deck
Unlock for access to all 109 flashcards in this deck.
Unlock Deck
k this deck
40
The diagram below shows the market demand curve and the cost curves for a single firm. FIGURE 12- 6
Refer to Figure 12- 6. Suppose this firm is being regulated using the policy of marginal- cost pricing. The resulting price and output would be
A) P1 and Q2.
B) P2 and Q2.
C) P1 and Q1.
D) P3 and Q2.
E) P3 and Q1.
FIGURE 12- 6Refer to Figure 12- 6. Suppose this firm is being regulated using the policy of marginal- cost pricing. The resulting price and output would be
A) P1 and Q2.
B) P2 and Q2.
C) P1 and Q1.
D) P3 and Q2.
E) P3 and Q1.
Unlock Deck
Unlock for access to all 109 flashcards in this deck.
Unlock Deck
k this deck
41
FIGURE 12- 3Refer to Figure 12- 3. Comparing the perfectly competitive equilibrium to the monopoly equilibrium, the reduction in consumer surplus due to monopoly is outlined by
A) P2P3E.
B) BCE.
C) P2EP4.
D) P2ECP3.
E) q1CEq2.
Unlock Deck
Unlock for access to all 109 flashcards in this deck.
Unlock Deck
k this deck
42
The diagram below shows the market demand curve and the cost curves for a single firm. FIGURE 12- 6
Refer to Figure 12- 6. Suppose this firm is being regulated using a policy of marginal- cost pricing. In this case, the firm would experience represented by the area .
A) losses; 0P2bQ2
B) profits; P2P3ad
C) profits; edbc
D) losses; edbc
E) losses; P1P2bc
FIGURE 12- 6Refer to Figure 12- 6. Suppose this firm is being regulated using a policy of marginal- cost pricing. In this case, the firm would experience represented by the area .
A) losses; 0P2bQ2
B) profits; P2P3ad
C) profits; edbc
D) losses; edbc
E) losses; P1P2bc
Unlock Deck
Unlock for access to all 109 flashcards in this deck.
Unlock Deck
k this deck
43
The diagram below shows the market demand curve and the cost curves for a single firm. FIGURE 12- 6
Refer to Figure 12- 6. Suppose this firm is being regulated using a policy of marginal- cost pricing. To maintain the resulting level of output
A) the demand curve would have to shift down.
B) the government would have to accept the allocative inefficiency associated with this level of output.
C) the regulator would have to allow the firm to keep the monopoly profits at this level of output.
D) the government would have to subsidize the firm or it will eventually shut down.
E) the average total cost curve would have to shift up.
FIGURE 12- 6Refer to Figure 12- 6. Suppose this firm is being regulated using a policy of marginal- cost pricing. To maintain the resulting level of output
A) the demand curve would have to shift down.
B) the government would have to accept the allocative inefficiency associated with this level of output.
C) the regulator would have to allow the firm to keep the monopoly profits at this level of output.
D) the government would have to subsidize the firm or it will eventually shut down.
E) the average total cost curve would have to shift up.
Unlock Deck
Unlock for access to all 109 flashcards in this deck.
Unlock Deck
k this deck
44
If an economy is productively inefficient, it could improve its situation by
A) moving onto its production possibilities boundary.
B) acquiring more resources.
C) moving beyond its production possibilities boundary.
D) moving along its production possibilities boundary.
E) trading some of its resources.
A) moving onto its production possibilities boundary.
B) acquiring more resources.
C) moving beyond its production possibilities boundary.
D) moving along its production possibilities boundary.
E) trading some of its resources.
Unlock Deck
Unlock for access to all 109 flashcards in this deck.
Unlock Deck
k this deck
45
Productive efficiency (at the level of the firm) is a goal that is sought
A) by no firms in any market.
B) by profit- maximizing firms in all market structures.
C) only by perfectly competitive firms.
D) only by profit- maximizing imperfectly competitive firms.
E) only by profit- maximizing firms in an oligopolistic market structure.
A) by no firms in any market.
B) by profit- maximizing firms in all market structures.
C) only by perfectly competitive firms.
D) only by profit- maximizing imperfectly competitive firms.
E) only by profit- maximizing firms in an oligopolistic market structure.
Unlock Deck
Unlock for access to all 109 flashcards in this deck.
Unlock Deck
k this deck
46
The administrative agency established to enforce the provisions of the Competition Act is the
A) Director of Investigations.
B) Department of Consumer and Corporate Affairs.
C) Competition Tribunal Act.
D) Federal Free Trade Practices Commission.
E) Competition Bureau.
A) Director of Investigations.
B) Department of Consumer and Corporate Affairs.
C) Competition Tribunal Act.
D) Federal Free Trade Practices Commission.
E) Competition Bureau.
Unlock Deck
Unlock for access to all 109 flashcards in this deck.
Unlock Deck
k this deck
47
Consider two firms, A and B, that are producing the same product but with different average costs. Economists say this situation reflects a problem of
A) economic inefficiency.
B) unemployed resources.
C) productive inefficiency.
D) allocative inefficiency.
E) - not necessarily any of the above.
A) economic inefficiency.
B) unemployed resources.
C) productive inefficiency.
D) allocative inefficiency.
E) - not necessarily any of the above.
Unlock Deck
Unlock for access to all 109 flashcards in this deck.
Unlock Deck
k this deck
48
The larger the minimum efficient scale of firms, ceteris paribus, the
A) more likely a concentrated market will improve allocative efficiency.
B) greater the number of firms comprising an industry.
C) greater the tendency toward monopoly inefficiency.
D) lower the advantages of large- scale production.
E) more likely a concentrated market will improve productive efficiency.
Unlock Deck
Unlock for access to all 109 flashcards in this deck.
Unlock Deck
k this deck
49
Traditionally, economists have regarded monopoly as an undesirable market structure because
A) of its innovative tendencies.
B) it is usually characterized by wastefully confrontational labour relations.
C) of its ability to minimize costs through large output.
D) it is allocatively inefficient.
E) it allows producers to earn large profits.
A) of its innovative tendencies.
B) it is usually characterized by wastefully confrontational labour relations.
C) of its ability to minimize costs through large output.
D) it is allocatively inefficient.
E) it allows producers to earn large profits.
Unlock Deck
Unlock for access to all 109 flashcards in this deck.
Unlock Deck
k this deck
50
The diagram below shows the demand and supply curves in a perfectly competitive market. FIGURE 12- 5
Refer to Figure 12- 5. If output in this market were Q1, the total loss in economic surplus relative to the competitive equilibrium would be illustrated by area
A) P1P3E.
B) 1 + 2 + 3 + 4.
C) 1.
D) 2.
E) 1 + 2.
FIGURE 12- 5Refer to Figure 12- 5. If output in this market were Q1, the total loss in economic surplus relative to the competitive equilibrium would be illustrated by area
A) P1P3E.
B) 1 + 2 + 3 + 4.
C) 1.
D) 2.
E) 1 + 2.
Unlock Deck
Unlock for access to all 109 flashcards in this deck.
Unlock Deck
k this deck
51
We can safely say that each point on a country's production possibilities boundary (PPB) is
A) Pareto optimal.
B) not productively efficient.
C) allocatively efficient.
D) one at which P = MC for all goods.
E) productively efficient.
A) Pareto optimal.
B) not productively efficient.
C) allocatively efficient.
D) one at which P = MC for all goods.
E) productively efficient.
Unlock Deck
Unlock for access to all 109 flashcards in this deck.
Unlock Deck
k this deck
52
The diagram below shows the demand and supply curves in a perfectly competitive market. FIGURE 12- 5
Refer to Figure 12- 5. In the free- market equilibrium, producer plus consumer surplus is maximized and is illustrated by the area
A) 1 + 2 + 3 + 4.
B) P1P3E.
C) 1 + 2.
D) P1P2E.
E) P3P2E.
FIGURE 12- 5Refer to Figure 12- 5. In the free- market equilibrium, producer plus consumer surplus is maximized and is illustrated by the area
A) 1 + 2 + 3 + 4.
B) P1P3E.
C) 1 + 2.
D) P1P2E.
E) P3P2E.
Unlock Deck
Unlock for access to all 109 flashcards in this deck.
Unlock Deck
k this deck
53
The diagram below shows the demand and supply curves in a perfectly competitive market. FIGURE 12- 5
Refer to Figure 12- 5. If output in this market were Q3, the loss in total economic surplus relative to the competitive equilibrium would be illustrated by area
A) 2.
B) 1.
C) 4.
D) 3 + 4.
E) 3.
FIGURE 12- 5Refer to Figure 12- 5. If output in this market were Q3, the loss in total economic surplus relative to the competitive equilibrium would be illustrated by area
A) 2.
B) 1.
C) 4.
D) 3 + 4.
E) 3.
Unlock Deck
Unlock for access to all 109 flashcards in this deck.
Unlock Deck
k this deck
54
An economy with no market failures and all industries are in a competitive long- run equilibrium is one where
1. allocative efficiency is achieved;
2. the economy is on the production possibilities boundary;
3. there is no incentive for firms to enter or leave industries.
A) 1 and 3
B) 2 and 3
C) 1 and 2
D) 1, 2, and 3
E) 2 only
1. allocative efficiency is achieved;
2. the economy is on the production possibilities boundary;
3. there is no incentive for firms to enter or leave industries.
A) 1 and 3
B) 2 and 3
C) 1 and 2
D) 1, 2, and 3
E) 2 only
Unlock Deck
Unlock for access to all 109 flashcards in this deck.
Unlock Deck
k this deck
55
Regulation can reduce the profits of a natural monopoly by imposing a per- unit output tax (rather than directly regulating price). Such a tax would cause the monopolist's
1) average total cost curve to shift upward;
2) marginal cost curve to shift upward;
3) demand curve to shift to the left.
A) 1 only
B) 2 only
C) 3 only
D) 1 and 2
E) 2 and 3
1) average total cost curve to shift upward;
2) marginal cost curve to shift upward;
3) demand curve to shift to the left.
A) 1 only
B) 2 only
C) 3 only
D) 1 and 2
E) 2 and 3
Unlock Deck
Unlock for access to all 109 flashcards in this deck.
Unlock Deck
k this deck
56
The objective of government regulation and competition policy is best described as a means to
A) promote economic efficiency.
B) reduce inequality in the economy.
C) make at least one person better off at the expense of others.
D) increase fairness in economic activities.
E) eliminate all market power.
A) promote economic efficiency.
B) reduce inequality in the economy.
C) make at least one person better off at the expense of others.
D) increase fairness in economic activities.
E) eliminate all market power.
Unlock Deck
Unlock for access to all 109 flashcards in this deck.
Unlock Deck
k this deck
57
In the absence of market failures, allocative efficiency is achieved only under perfect competition because only this market structure results in
A) productive efficiency.
B) P = MC.
C) complete freedom of entry and exit.
D) zero long- run profits.
E) maximization of profits through competition.
A) productive efficiency.
B) P = MC.
C) complete freedom of entry and exit.
D) zero long- run profits.
E) maximization of profits through competition.
Unlock Deck
Unlock for access to all 109 flashcards in this deck.
Unlock Deck
k this deck
58
An economy will be allocatively efficient if
A) imperfectly competitive markets are regulated.
B) the economy's resources are fully employed.
C) least- cost production techniques are employed by all firms.
D) the marginal cost equals price for all goods.
E) the marginal costs of all firms in an industry are equal.
A) imperfectly competitive markets are regulated.
B) the economy's resources are fully employed.
C) least- cost production techniques are employed by all firms.
D) the marginal cost equals price for all goods.
E) the marginal costs of all firms in an industry are equal.
Unlock Deck
Unlock for access to all 109 flashcards in this deck.
Unlock Deck
k this deck
59
A major aim of Canadian competition policy is to
A) achieve a perfectly competitive market structure in all markets in the Canadian economy.
B) protect Canadian companies from unfair foreign competition.
C) monitor the pricing practices of crown corporations.
D) eliminate oligopolies and the allocative inefficiency that they entail.
E) prevent further concentration of industries where such concentration would lessen competition.
Unlock Deck
Unlock for access to all 109 flashcards in this deck.
Unlock Deck
k this deck
60
FIGURE 12- 3Refer to Figure 12- 3. The area representing consumer surplus in a monopoly equilibrium is outlined by
A) 0P4Eq2.
B) P3P4C.
C) P2P4E.
D) ABE.
E) ACE.
Unlock Deck
Unlock for access to all 109 flashcards in this deck.
Unlock Deck
k this deck
61
The diagram below shows the demand and supply curves in a perfectly competitive market. FIGURE 12- 5
Refer to Figure 12- 5. If output in this market were Q3, and the price were still P2, the loss in consumer surplus relative to the competitive equilibrium would be illustrated by area
A) 3 + 4.
B) 1.
C) 3.
D) 4.
E) 2.
FIGURE 12- 5Refer to Figure 12- 5. If output in this market were Q3, and the price were still P2, the loss in consumer surplus relative to the competitive equilibrium would be illustrated by area
A) 3 + 4.
B) 1.
C) 3.
D) 4.
E) 2.
Unlock Deck
Unlock for access to all 109 flashcards in this deck.
Unlock Deck
k this deck
62
The diagram below shows the market demand curve and the cost curves for a single firm. FIGURE 12- 6
Refer to Figure 12- 6. Suppose this firm is being regulated using a policy of marginal- cost pricing. In this case,
A) allocative efficiency is achieved because price equals marginal cost.
B) allocative efficiency is achieved because profits are maximized.
C) the result is allocatively inefficient because the firm is suffering losses.
D) the result is allocatively inefficient because the marginal cost curve lies below the ATC curve.
E) the result is allocatively inefficient because the firm is earning profits.
FIGURE 12- 6Refer to Figure 12- 6. Suppose this firm is being regulated using a policy of marginal- cost pricing. In this case,
A) allocative efficiency is achieved because price equals marginal cost.
B) allocative efficiency is achieved because profits are maximized.
C) the result is allocatively inefficient because the firm is suffering losses.
D) the result is allocatively inefficient because the marginal cost curve lies below the ATC curve.
E) the result is allocatively inefficient because the firm is earning profits.
Unlock Deck
Unlock for access to all 109 flashcards in this deck.
Unlock Deck
k this deck
63
Consider the case of a natural monopoly with falling average total costs. If regulation sets the price equal to marginal cost, then
A) the firm would earn economic profits.
B) the outcome would be allocatively inefficient.
C) shortages would result.
D) the firm would operate at a loss and eventually go out of business.
E) the demand curve would shift to the left.
A) the firm would earn economic profits.
B) the outcome would be allocatively inefficient.
C) shortages would result.
D) the firm would operate at a loss and eventually go out of business.
E) the demand curve would shift to the left.
Unlock Deck
Unlock for access to all 109 flashcards in this deck.
Unlock Deck
k this deck
64
The diagram below shows supply, demand, and quantity exchanged of Monday matinee movie tickets. Assume it is a perfectly competitive market. FIGURE 12- 4
Refer to Figure 12- 4. If a disequilibrium price of $7.50 per movie ticket were imposed on this market, this market would not be allocatively efficient because
1) the sum of consumer and producer surplus would not be maximized;
2) the marginal benefit to consumers of the last movie consumed would be greater than the marginal cost to the seller;
3) the marginal cost to the seller of the last movie consumed would be more than the marginal benefit to consumers.
A) 2 only
B) 1 only
C) 3 only
D) 1 and 2
E) 2 and 3
FIGURE 12- 4Refer to Figure 12- 4. If a disequilibrium price of $7.50 per movie ticket were imposed on this market, this market would not be allocatively efficient because
1) the sum of consumer and producer surplus would not be maximized;
2) the marginal benefit to consumers of the last movie consumed would be greater than the marginal cost to the seller;
3) the marginal cost to the seller of the last movie consumed would be more than the marginal benefit to consumers.
A) 2 only
B) 1 only
C) 3 only
D) 1 and 2
E) 2 and 3
Unlock Deck
Unlock for access to all 109 flashcards in this deck.
Unlock Deck
k this deck
65
The diagram below shows the market demand curve and the cost curves for a single firm. FIGURE 12- 6
Refer to Figure 12- 6. Suppose this firm is being regulated using a policy of average- cost pricing. In this case, economic profits to the firm are represented by the area
A) P2P3ad
B) P1P2bc
C) 0P3aQ1
D) P2P3ab
E) there are no economic profits.
FIGURE 12- 6Refer to Figure 12- 6. Suppose this firm is being regulated using a policy of average- cost pricing. In this case, economic profits to the firm are represented by the area
A) P2P3ad
B) P1P2bc
C) 0P3aQ1
D) P2P3ab
E) there are no economic profits.
Unlock Deck
Unlock for access to all 109 flashcards in this deck.
Unlock Deck
k this deck
66
The diagram below shows the demand and supply curves in a perfectly competitive market. FIGURE 12- 5
Refer to Figure 12- 5. Allocative efficiency occurs
A) where the areas 1, 2, 3, and 4 are maximized.
B) at the higher output Q3.
C) at price P1 and output Q3.
D) at price P2 and output Q2.
E) at the lower output Q1.
FIGURE 12- 5Refer to Figure 12- 5. Allocative efficiency occurs
A) where the areas 1, 2, 3, and 4 are maximized.
B) at the higher output Q3.
C) at price P1 and output Q3.
D) at price P2 and output Q2.
E) at the lower output Q1.
Unlock Deck
Unlock for access to all 109 flashcards in this deck.
Unlock Deck
k this deck
67
Allocative efficiency is a property of the behaviour of
A) perfectly- competitive firms.
B) monopolies.
C) all firms in an industry.
D) the overall economy.
E) individual firms.
A) perfectly- competitive firms.
B) monopolies.
C) all firms in an industry.
D) the overall economy.
E) individual firms.
Unlock Deck
Unlock for access to all 109 flashcards in this deck.
Unlock Deck
k this deck
68
The diagram below shows cost and revenue curves for a natural monopoly producing electricity. Price is dollars per kilowatt hour and quantity is kilowatt hours per day. FIGURE 12- 7
Refer to Figure 12- 7. If this firm were unregulated and profit maximizing, its profit would be
Per day.
A) $60 000
B) $120 000
C) $110 000
D) $0
E) $10 000
FIGURE 12- 7Refer to Figure 12- 7. If this firm were unregulated and profit maximizing, its profit would be
Per day.
A) $60 000
B) $120 000
C) $110 000
D) $0
E) $10 000
Unlock Deck
Unlock for access to all 109 flashcards in this deck.
Unlock Deck
k this deck
69
Allocative efficiency concerns
A) the allocation of resources such that total economic surplus is maximized.
B) the equitable distribution of resources.
C) discouraging all monopoly firms.
D) producing outputs at lowest possible cost.
E) encouraging monopoly if it generates innovation.
A) the allocation of resources such that total economic surplus is maximized.
B) the equitable distribution of resources.
C) discouraging all monopoly firms.
D) producing outputs at lowest possible cost.
E) encouraging monopoly if it generates innovation.
Unlock Deck
Unlock for access to all 109 flashcards in this deck.
Unlock Deck
k this deck
70
Consider two firms, A and B, that are producing the same product but with different marginal costs. In this case,
A) neither firm is producing its output at the lowest attainable cost.
B) each firm is being wasteful.
C) a reallocation of output between the firms can lower the industry's total cost.
D) one firm is not maximizing profits.
E) some resources must be unemployed.
A) neither firm is producing its output at the lowest attainable cost.
B) each firm is being wasteful.
C) a reallocation of output between the firms can lower the industry's total cost.
D) one firm is not maximizing profits.
E) some resources must be unemployed.
Unlock Deck
Unlock for access to all 109 flashcards in this deck.
Unlock Deck
k this deck
71
The production possibilities boundary shows possible combinations of guns and butter that can be produced by a country. The lower diagram shows demand and supply for butter. FIGURE 12- 2
Refer to Figure 12- 2. Suppose demand and supply for butter are shown by D and S, respectively. And suppose the economy is at point (a) on the production possibilities boundary. How can this economy move toward allocative efficiency?
A) produce more butter, less guns.
B) increase the demand for butter.
C) produce less butter, more guns.
D) expand the production possibilities boundary outward.
E) increase the supply of guns.
FIGURE 12- 2Refer to Figure 12- 2. Suppose demand and supply for butter are shown by D and S, respectively. And suppose the economy is at point (a) on the production possibilities boundary. How can this economy move toward allocative efficiency?
A) produce more butter, less guns.
B) increase the demand for butter.
C) produce less butter, more guns.
D) expand the production possibilities boundary outward.
E) increase the supply of guns.
Unlock Deck
Unlock for access to all 109 flashcards in this deck.
Unlock Deck
k this deck
72
The production possibilities boundary shows possible combinations of guns and butter that can be produced by a country. The lower diagram shows demand and supply for butter. FIGURE 12- 2
Refer to Figure 12- 2. Suppose this economy is allocatively efficient at Q1 units of butter. Now suppose there is an increase in demand for butter from D to D1. After this shift in demand,
A) the price of guns (relative to the price of butter) rises and the economy moves to point (a) on the PPB.
B) the marginal value to consumers of butter is greater than the marginal cost to producers; the price of butter (relative to the price of guns) rises; the economy moves to output Q2 of butter and point (c) on the PPB.
C) the supply curve will shift up to S1 and allocative efficiency will be maintained.
D) the marginal value to consumers of butter is less than the marginal cost to producers; the price of butter (relative to the price of guns) rises; the economy moves to output Q2 of butter and point (c) on the PPB.
E) the increase in the price of butter (relative to the price of guns) will cause the demand curve to shift back down to D and allocative efficiency will be maintained.
FIGURE 12- 2Refer to Figure 12- 2. Suppose this economy is allocatively efficient at Q1 units of butter. Now suppose there is an increase in demand for butter from D to D1. After this shift in demand,
A) the price of guns (relative to the price of butter) rises and the economy moves to point (a) on the PPB.
B) the marginal value to consumers of butter is greater than the marginal cost to producers; the price of butter (relative to the price of guns) rises; the economy moves to output Q2 of butter and point (c) on the PPB.
C) the supply curve will shift up to S1 and allocative efficiency will be maintained.
D) the marginal value to consumers of butter is less than the marginal cost to producers; the price of butter (relative to the price of guns) rises; the economy moves to output Q2 of butter and point (c) on the PPB.
E) the increase in the price of butter (relative to the price of guns) will cause the demand curve to shift back down to D and allocative efficiency will be maintained.
Unlock Deck
Unlock for access to all 109 flashcards in this deck.
Unlock Deck
k this deck
73
The diagram below shows cost and revenue curves for a natural monopoly producing electricity. Price is dollars per kilowatt hour and quantity is kilowatt hours per day. FIGURE 12- 7
Refer to Figure 12- 7. Suppose this firm is being regulated using a policy of average- cost pricing. The resulting price and output would be per kwh and kwh per day.
A) $0.11; 1 million
B) $0.09; 1.4 million
C) $0.07; 1.5 million
D) $0.06; 1 million
E) $0.12; 1 million
FIGURE 12- 7Refer to Figure 12- 7. Suppose this firm is being regulated using a policy of average- cost pricing. The resulting price and output would be per kwh and kwh per day.
A) $0.11; 1 million
B) $0.09; 1.4 million
C) $0.07; 1.5 million
D) $0.06; 1 million
E) $0.12; 1 million
Unlock Deck
Unlock for access to all 109 flashcards in this deck.
Unlock Deck
k this deck
74
The diagram below shows the demand and supply curves in a perfectly competitive market. FIGURE 12- 5
Refer to Figure 12- 5. If output in this market were Q1, and the price were still equal to its
Free- market level, the loss in producer surplus relative to the competitive equilibrium would be illustrated by area
A) P3P2E.
B) P1P3E.
C) 2.
D) 1.
E) 1 + 2.
FIGURE 12- 5Refer to Figure 12- 5. If output in this market were Q1, and the price were still equal to its
Free- market level, the loss in producer surplus relative to the competitive equilibrium would be illustrated by area
A) P3P2E.
B) P1P3E.
C) 2.
D) 1.
E) 1 + 2.
Unlock Deck
Unlock for access to all 109 flashcards in this deck.
Unlock Deck
k this deck
75
The diagram below shows supply, demand, and quantity exchanged of Monday matinee movie tickets. Assume it is a perfectly competitive market. FIGURE 12- 4
Refer to Figure 12- 4. What is the total economic surplus generated in this market at the allocatively efficient level of output?
A) $500
B) $125
C) $250
D) $5
E) $10
FIGURE 12- 4Refer to Figure 12- 4. What is the total economic surplus generated in this market at the allocatively efficient level of output?
A) $500
B) $125
C) $250
D) $5
E) $10
Unlock Deck
Unlock for access to all 109 flashcards in this deck.
Unlock Deck
k this deck
76
One method of regulating a natural monopoly is known as average- cost pricing. Using this method, the regulator requires that the price be set equal to average
A) internal cost.
B) variable cost.
C) total cost.
D) marginal cost.
E) fixed cost.
A) internal cost.
B) variable cost.
C) total cost.
D) marginal cost.
E) fixed cost.
Unlock Deck
Unlock for access to all 109 flashcards in this deck.
Unlock Deck
k this deck
77
A natural monopoly exists when
A) a firm produces a product essential to national security.
B) a firm is able to operate at the minimum point of its long- run average total cost curve.
C) one firm can most efficiently supply the entire market demand.
D) a firm has a government charter to be the sole producer of some good.
E) only one firm is supplying a natural resource.
Unlock Deck
Unlock for access to all 109 flashcards in this deck.
Unlock Deck
k this deck
78
The diagram below shows supply, demand, and quantity exchanged of Monday matinee movie tickets. Assume it is a perfectly competitive market. FIGURE 12- 4
Refer to Figure 12- 4. Suppose a disequilibrium price of $7.50 per movie ticket is imposed in this market. The consumer surplus becomes _ and the producer surplus becomes .
A) $2.50; $7.50
B) $62.50; $250
C) $62.50; $125
D) $0; $62.50
E) $31.25; $156.25
FIGURE 12- 4Refer to Figure 12- 4. Suppose a disequilibrium price of $7.50 per movie ticket is imposed in this market. The consumer surplus becomes _ and the producer surplus becomes .
A) $2.50; $7.50
B) $62.50; $250
C) $62.50; $125
D) $0; $62.50
E) $31.25; $156.25
Unlock Deck
Unlock for access to all 109 flashcards in this deck.
Unlock Deck
k this deck
79
FIGURE 12- 3Refer to Figure 12- 3. The area representing consumer surplus in a perfectly competitive equilibrium is outlined by
A) P2P4E.
B) P3P4C.
C) ACE.
D) ABE.
E) 0P4Eq2.
Unlock Deck
Unlock for access to all 109 flashcards in this deck.
Unlock Deck
k this deck
80
The Canadian economy is achieving allocative efficiency if
A) there are no idle resources in the economy.
B) marginal product is equal for all factors of production.
C) marginal cost is equalized across industries.
D) marginal cost equals price in all industries.
E) price equals average cost in all industries.
A) there are no idle resources in the economy.
B) marginal product is equal for all factors of production.
C) marginal cost is equalized across industries.
D) marginal cost equals price in all industries.
E) price equals average cost in all industries.
Unlock Deck
Unlock for access to all 109 flashcards in this deck.
Unlock Deck
k this deck
Unlock Deck
Unlock for access to all 109 flashcards in this deck.


