Deck 6: Consumer Behaviour
Full screen (f)
Question
Question
Question
Question
Question
 FIGURE 6- 2
Refer to Figure 6- 2. Suppose that the price of X is $2, the price of Y is $1, the consumer's income is
$10, and the consumer is buying 3 units of good X and 4 units of good Y. What is the total utility the consumer obtains from this combination of X and Y?
A) 18.
B) 30.
C) 40.
D) 60.
E) 72.
Question
 FIGURE 6- 1
Refer to Figure 6- 1. The consumer's total utility is
A) constant.
B) increasing at a decreasing rate..
C) decreasing at an increasing rate
D) decreasing at a decreasing rate.
E) increasing at an increasing rate.
Question
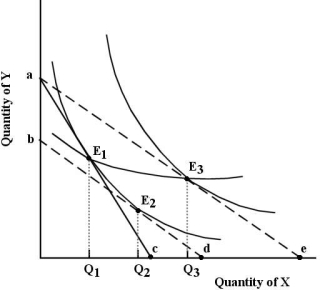 FIGURE 6- 10
Refer to Figure 6- 10. The line joining points E1 and E3 is known as , which shows how
.
A) an income consumption line; consumption changes as income changes, with relative prices held constant
B) a price consumption line; consumption changes as one price changes, with money income held constant
C) a price consumption line; consumption changes as money income and relative prices change
D) an income consumption line; consumption changes with changing relative prices and constant income
Question
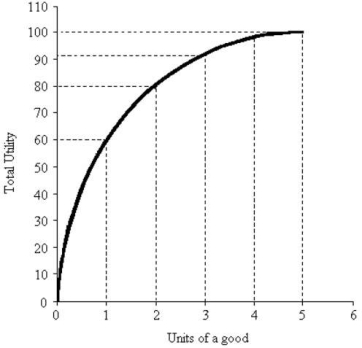 FIGURE 6- 1
Refer to Figure 6- 1. The total utility from consuming two units of the good is
A) 80.
B) 100.
C) 20.
D) 40.
E) 60.
Question
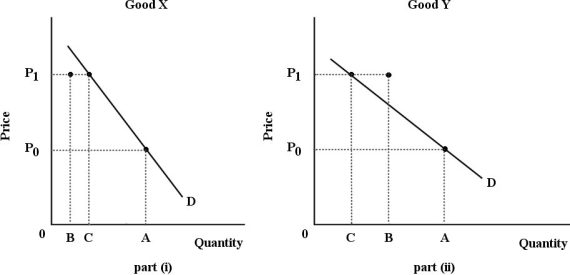 FIGURE 6- 4
Refer to Figure 6- 4. For both goods, the price increases from P0 to P1. The substitution effect is illustrated by the change in quantity demanded from A to B; the income effect is illustrated by the change in quantity demanded from B to C. Good X is certainly a(n) good.
A) normal
B) Giffen
C) inferior
D) luxury
E) necessity
Question
Question
The figures below show Chris's consumption of specialty coffee per week. 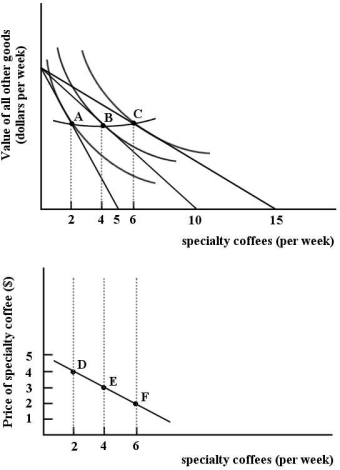 FIGURE 6- 9
Refer to Figure 6- 9. The line connecting points A, B and C is _ . The line connecting points D, E and F is .
A) the budget line; the price- consumption line
B) the demand curve; the budget line
C) the income- consumption line; the demand curve
D) the price- consumption line; the demand curve
E) the income- consumption line; the budget line
FIGURE 6- 9Refer to Figure 6- 9. The line connecting points A, B and C is _ . The line connecting points D, E and F is .
A) the budget line; the price- consumption line
B) the demand curve; the budget line
C) the income- consumption line; the demand curve
D) the price- consumption line; the demand curve
E) the income- consumption line; the budget line
Question
The diagram below shows a set of budget lines facing a household. 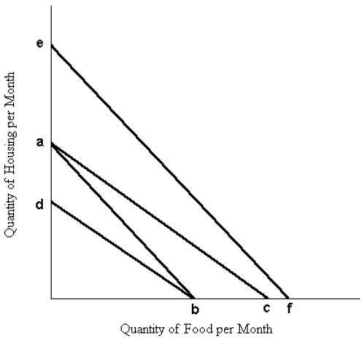 FIGURE 6- 7
Refer to Figure 6- 7. The movement of the budget line from ab to db could be caused by
A) a decrease in the price of housing.
B) a decrease in the price of food.
C) an increase in the price of housing.
D) an increase in the price of food.
E) a decrease in money income.
FIGURE 6- 7Refer to Figure 6- 7. The movement of the budget line from ab to db could be caused by
A) a decrease in the price of housing.
B) a decrease in the price of food.
C) an increase in the price of housing.
D) an increase in the price of food.
E) a decrease in money income.
Question
 FIGURE 6- 2
-Refer to Figure 6- 2. Suppose that the price of Y is $1 and the consumer's income is $10. Initially, the price of X is $2 and the consumer is buying 4 units of good Y. If the price of X then falls to $1, which of the following pairs of quantities of X correctly completes the demand schedule below?
A) 6, 3
B) 4, 3
C) 4, 4
D) 6, 4
E) 2, 4
Question
Question
Question
Question
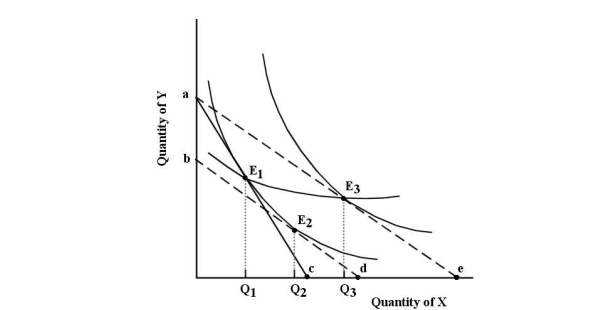 FIGURE 6- 10
Refer to Figure 6- 10. Suppose the consumer begins at E1. The income and substitution effects of the reduction in the price of X are represented as follows:
A) the distance Q1Q2 shows the income effect and the distance Q2Q3 shows the substitution effect.
B) the distance Q1Q2 shows the substitution effect and the distance Q2Q3 shows the income effect.
C) the distance Q1d shows the substitution effect and the distance Q2e shows the income effect.
D) the distance de shows the income effect and the distance cd shows the substitution effect.
E) the distance Q1Q3 shows the substitution effect and the distance Q2Q3 shows the income effect.
Question
Question
Question
Question
 FIGURE 6- 2
Refer to Figure 6- 2. If the price of X is $2 and the price of Y is $1 and the consumer is buying 4 units of X and 2 units of Y, the consumer's total utility is
A) 8.
B) 10.
C) 52.
D) 56.
E) 69.
Question
Question
Question
Question
Question
Question
Question
Question
Question
The figures below show Chris's consumption of specialty coffee per week. FIGURE 6- 9
Refer to Figure 6- 9. The absolute value of the slope of the budget lines is equal to , which reflects the of specialty coffees in terms of all other goods.
A) the relative price ratio (Pall other goods/Pspecialty coffee); demand
B) the dollar value of all other goods divided by the number of specialty coffees consumed per week; demand
C) the quantity of all other goods consumed divided by the quantity of specialty coffees consumed; quantity
D) $15/value of all other goods; opportunity cost
E) the relative price ratio (Pspecialty coffee/Pall other goods); opportunity cost
FIGURE 6- 9Refer to Figure 6- 9. The absolute value of the slope of the budget lines is equal to , which reflects the of specialty coffees in terms of all other goods.
A) the relative price ratio (Pall other goods/Pspecialty coffee); demand
B) the dollar value of all other goods divided by the number of specialty coffees consumed per week; demand
C) the quantity of all other goods consumed divided by the quantity of specialty coffees consumed; quantity
D) $15/value of all other goods; opportunity cost
E) the relative price ratio (Pspecialty coffee/Pall other goods); opportunity cost
Question
Question
Question
 FIGURE 6- 1
Refer to Figure 6- 1. The marginal utility of the second unit of the good consumed is
A) 50.
B) 30.
C) 40.
D) 10.
E) 20.
Question
Question
Question
Question
 FIGURE 6- 8
Refer to Figure 6- 8. In part (ii), the consumer's move from point Z to point Y is caused by
A) a change in the consumer's preferences towards milk.
B) an increase in the price of bread.
C) a decrease in money income.
D) an decrease in the price of bread.
E) an increase in the price of milk.
Question
Question
Question
Question
Sophie consumes two goods - paperback novels and visits to the movies. 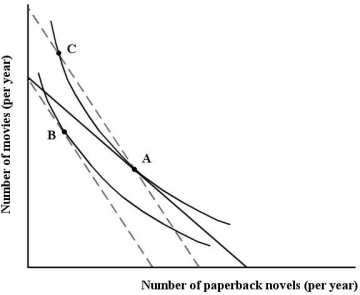 FIGURE 6- 11
Refer to Figure 6- 11. Sophie's movement from point A to point C is
A) the income effect of a decrease in the price of paperback novels.
B) the total effect of a decrease in the price of paperback novels.
C) the income effect of an increase in the price of paperback novels.
D) the total effect of a change in money income.
E) the substitution effect of an increase in the price of paperback novels.
FIGURE 6- 11Refer to Figure 6- 11. Sophie's movement from point A to point C is
A) the income effect of a decrease in the price of paperback novels.
B) the total effect of a decrease in the price of paperback novels.
C) the income effect of an increase in the price of paperback novels.
D) the total effect of a change in money income.
E) the substitution effect of an increase in the price of paperback novels.
Question
 FIGURE 6- 2
Refer to Figure 6- 2. Suppose that the price of X is $2, the price of Y is $1, and the consumer's income is $10. The consumer is currently buying 3 units of good X and 4 units of good Y. In order to maximize his/her utility, the consumer should
A) buy the same amount of X but less Y.
B) buy more of X and less Y.
C) buy more of X but the same amount Y.
D) buy less of X and more Y.
E) not change his/her behaviour.
Question
Question
Question
Question
Question
The figures below show Chris's consumption of specialty coffee per week.  FIGURE 6- 9
Refer to Figure 6- 9. Suppose Chris's income is such that he is able to buy no more than 10 specialty coffees per week. If Chris is maximizing his utility at this level of income, how many specialty coffees is he consuming per week?
A) 2
B) 4
C) 5
D) 6
E) 10
FIGURE 6- 9Refer to Figure 6- 9. Suppose Chris's income is such that he is able to buy no more than 10 specialty coffees per week. If Chris is maximizing his utility at this level of income, how many specialty coffees is he consuming per week?
A) 2
B) 4
C) 5
D) 6
E) 10
Question
Question
Question
Question
 FIGURE 6- 8
Refer to Figure 6- 8. In part (i), the line joining points A, B, and C is known as , which shows how .
A) a price- consumption line; consumption changes as money income and relative prices change
B) an indifference map; the value of various combinations of two goods changes.
C) an income- consumption line; consumption changes as income changes, with relative prices held constant
D) a price- consumption line; consumption changes as relative prices change, with money income constant
E) an income- consumption line; consumption changes with changing relative prices and constant income
Question
Question
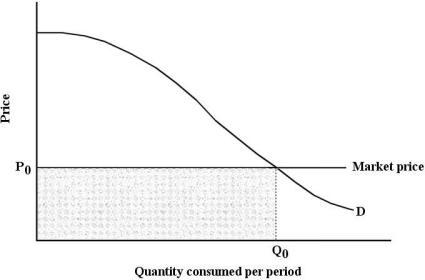 FIGURE 6- 6
Refer to Figure 6- 6. Suppose that price is P0. The market value of the quantity purchased is given by the area
A) under the demand curve to the left of Q0.
B) below P0 and to the left of Q0.
C) under the demand curve.
D) under the demand curve and to the right of Q0.
E) under the demand curve and above P0.
Question
Question
 FIGURE 6- 1
Refer to Figure 6- 1. Total utility is at its maximum when marginal utility is
A) at the maximum.
B) equal to total utility.
C) negative.
D) positive.
E) equal to zero.
Question
Question
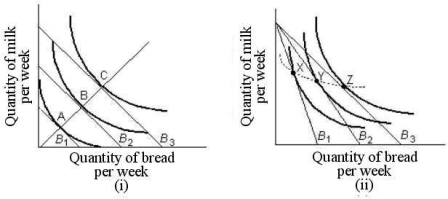 FIGURE 6- 8
Refer to Figure 6- 8. In part (i), the consumer is able to move from point A to point B because of
A) a decrease in money income.
B) a decrease in the price of one good and an increase in money income.
C) a decrease in the price of bread.
D) a decrease in the price of milk.
E) an increase in real income.
Question
Question
Question
 FIGURE 6- 4
Refer to Figure 6- 4. For both goods, the price increases from P0 to P1. The substitution effect is illustrated by the change in quantity demanded from A to B; the income effect is illustrated by the change in quantity demanded from B to C. Good Y is certainly a(n) good.
A) normal
B) Giffen
C) luxury
D) necessity
E) inferior
Question
 FIGURE 6- 1
Refer to Figure 6- 1. Marginal utility is zero when total utility is
A) is increasing.
B) equal to zero.
C) at its maximum.
D) is decreasing.
E) equal to marginal utility.
Question
Question
Question
Question
The diagram below shows a set of budget lines facing a household.  FIGURE 6- 7
Refer to Figure 6- 7. The movement of the budget line from ab to ef could be caused by
A) a decrease in money income.
B) an equal percentage increase in the price of both food and housing.
C) an equal percentage decrease in the price of both food and housing.
D) a decrease in the price of either food or housing.
E) an increase in the price of either food or housing.
FIGURE 6- 7Refer to Figure 6- 7. The movement of the budget line from ab to ef could be caused by
A) a decrease in money income.
B) an equal percentage increase in the price of both food and housing.
C) an equal percentage decrease in the price of both food and housing.
D) a decrease in the price of either food or housing.
E) an increase in the price of either food or housing.
Question
Question
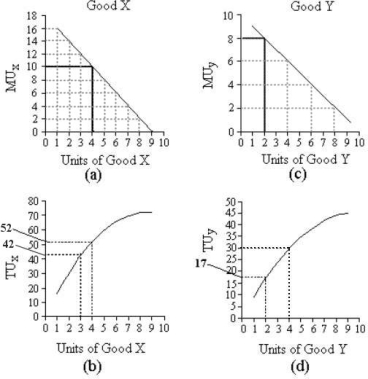 FIGURE 6- 2
Refer to Figure 6- 2. Suppose the price of Y is $1 and the consumer's income is $10. Initially, the price of X is $2 and the consumer is buying 3 units of good X and 4 units of good Y. If the price of X then falls to $1, what quantities of X and Y will he/she now purchase in order to maximize total utility?
A) 5 X and 5 Y.
B) 6 X and 4 Y.
C) 2 X and 8 Y.
D) 4 X and 6 Y.
E) 3 X and 7 Y.
Question
Question
Question
The figures below show Chris's consumption of specialty coffee per week.  FIGURE 6- 9
Refer to Figure 6- 9. The two diagrams in Figure 6- 9 are showing
A) that Chris is indifferent between bundles A, B and C.
B) the derivation of Chris's demand curve for specialty coffee.
C) the change in Chris's preferences toward specialty coffee.
D) that Chris is indifferent between points D, E and F.
E) the derivation of Chris's indifference curve for specialty coffee.
FIGURE 6- 9Refer to Figure 6- 9. The two diagrams in Figure 6- 9 are showing
A) that Chris is indifferent between bundles A, B and C.
B) the derivation of Chris's demand curve for specialty coffee.
C) the change in Chris's preferences toward specialty coffee.
D) that Chris is indifferent between points D, E and F.
E) the derivation of Chris's indifference curve for specialty coffee.
Question
Question
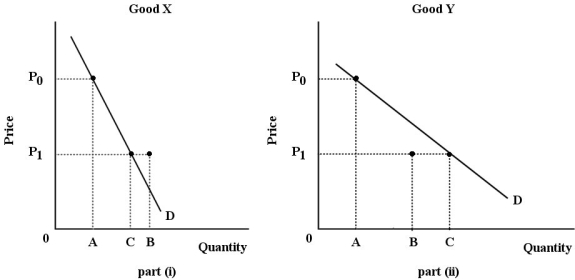 FIGURE 6- 3
Refer to Figure 6- 3. For both goods, the price falls from P0 to P1. The substitution effect is illustrated by the change in quantity demanded from A to B; the income effect is illustrated by the change in quantity demanded from B to C. Good Y is certainly a(n) good.
A) luxury
B) normal
C) inferior
D) necessity
E) Giffen
Question
Question
 FIGURE 6- 2
Refer to Figure 6- 2. Suppose the price of Y is $1, the consumer's income is $10, and the consumer is currently buying 3 units of good X and 4 units of good Y. If this consumer is maximizing her utility, then the price of X must be
A) $1.
B) $2.
C) $3.
D) $4.
E) impossible to tell with the given information.
Question
Question
 FIGURE 6- 6
Refer to Figure 6- 6. Suppose that price is P0. Total consumer surplus is then given by the area
A) under the demand curve to the left of Q0, but above P0.
B) under the demand curve to the left of Q0.
C) under the entire demand curve.
D) above the market price.
E) below P0 and to the left of Q0.
Question
Question
Question
Question

Unlock Deck
Sign up to unlock the cards in this deck!
Unlock Deck
Unlock Deck
1/119
Play
Full screen (f)
Deck 6: Consumer Behaviour
1
The condition required for a consumer to be maximizing utility, for any pair of products, X and Y, is
A) MUX/PY = MUY/PX.
B) MUX = MUY.
C) PX = PY.
D) PX(MUX) = PY(MUY).
E) MUX/PX = MUY/PY.
A) MUX/PY = MUY/PX.
B) MUX = MUY.
C) PX = PY.
D) PX(MUX) = PY(MUY).
E) MUX/PX = MUY/PY.
E
2
FIGURE 6- 8
-Refer to Figure 6- 8. In part (ii), the line joining points X, Y, and Z is known as , which shows how .
A) an indifference map; the value of various combinations of two goods changes.
B) an income- consumption line; consumption changes with changing relative prices and constant income
C) a price- consumption line; consumption changes as relative prices change, with money income constant
D) an income- consumption line; consumption changes as income changes, with relative prices held constant
E) a price- consumption line; consumption changes as money income and relative prices change
a price- consumption line; consumption changes as relative prices change, with money income constant
3
The table below shows the total value (in dollars) that Andrew gets from playing 9- hole rounds of golf.
-Refer to Table 6- 3. If the price of a 9- hole round of golf is $22, then Andrew's consumer surplus will be
A) $202.
B) $22.
C) $108.
D) $92.
E) $26.
-Refer to Table 6- 3. If the price of a 9- hole round of golf is $22, then Andrew's consumer surplus will be
A) $202.
B) $22.
C) $108.
D) $92.
E) $26.
$26.
4
If John consumes only two goods, A and B, and he is maximizing his utility subject to his budget constraint,
A) MUA/MUB equals the ratio of the price of A to the price of B.
B) MUA/MUB equals 1.
C) MUA/MUB equals the ratio of the total utility of A to the total utility of B.
D) MUA/MUB is at a maximum.
E) MUA/MUB equals zero.
A) MUA/MUB equals the ratio of the price of A to the price of B.
B) MUA/MUB equals 1.
C) MUA/MUB equals the ratio of the total utility of A to the total utility of B.
D) MUA/MUB is at a maximum.
E) MUA/MUB equals zero.
Unlock Deck
Unlock for access to all 119 flashcards in this deck.
Unlock Deck
k this deck
5
FIGURE 6- 2Refer to Figure 6- 2. Suppose that the price of X is $2, the price of Y is $1, the consumer's income is
$10, and the consumer is buying 3 units of good X and 4 units of good Y. What is the total utility the consumer obtains from this combination of X and Y?
A) 18.
B) 30.
C) 40.
D) 60.
E) 72.
Unlock Deck
Unlock for access to all 119 flashcards in this deck.
Unlock Deck
k this deck
6
FIGURE 6- 1Refer to Figure 6- 1. The consumer's total utility is
A) constant.
B) increasing at a decreasing rate..
C) decreasing at an increasing rate
D) decreasing at a decreasing rate.
E) increasing at an increasing rate.
Unlock Deck
Unlock for access to all 119 flashcards in this deck.
Unlock Deck
k this deck
7
FIGURE 6- 10Refer to Figure 6- 10. The line joining points E1 and E3 is known as , which shows how
.
A) an income consumption line; consumption changes as income changes, with relative prices held constant
B) a price consumption line; consumption changes as one price changes, with money income held constant
C) a price consumption line; consumption changes as money income and relative prices change
D) an income consumption line; consumption changes with changing relative prices and constant income
Unlock Deck
Unlock for access to all 119 flashcards in this deck.
Unlock Deck
k this deck
8
FIGURE 6- 1Refer to Figure 6- 1. The total utility from consuming two units of the good is
A) 80.
B) 100.
C) 20.
D) 40.
E) 60.
Unlock Deck
Unlock for access to all 119 flashcards in this deck.
Unlock Deck
k this deck
9
FIGURE 6- 4Refer to Figure 6- 4. For both goods, the price increases from P0 to P1. The substitution effect is illustrated by the change in quantity demanded from A to B; the income effect is illustrated by the change in quantity demanded from B to C. Good X is certainly a(n) good.
A) normal
B) Giffen
C) inferior
D) luxury
E) necessity
Unlock Deck
Unlock for access to all 119 flashcards in this deck.
Unlock Deck
k this deck
10
Christine is allocating her household expenditure between cleaning services and gardening services in order to maximize the household's total utility. For the quantities of cleaning and gardening services she has chosen, an increase in the price of cleaning service will, ceteris paribus,
A) increase the marginal utility of a unit of cleaning service.
B) increase the marginal utility per dollar spent on cleaning service.
C) have no effect on the marginal utility per dollar spent on cleaning service.
D) reduce the marginal utility of a unit of cleaning service.
E) reduce the marginal utility per dollar spent on cleaning service.
Unlock Deck
Unlock for access to all 119 flashcards in this deck.
Unlock Deck
k this deck
11
The figures below show Chris's consumption of specialty coffee per week. FIGURE 6- 9
Refer to Figure 6- 9. The line connecting points A, B and C is _ . The line connecting points D, E and F is .
A) the budget line; the price- consumption line
B) the demand curve; the budget line
C) the income- consumption line; the demand curve
D) the price- consumption line; the demand curve
E) the income- consumption line; the budget line
FIGURE 6- 9Refer to Figure 6- 9. The line connecting points A, B and C is _ . The line connecting points D, E and F is .
A) the budget line; the price- consumption line
B) the demand curve; the budget line
C) the income- consumption line; the demand curve
D) the price- consumption line; the demand curve
E) the income- consumption line; the budget line
Unlock Deck
Unlock for access to all 119 flashcards in this deck.
Unlock Deck
k this deck
12
The diagram below shows a set of budget lines facing a household. FIGURE 6- 7
Refer to Figure 6- 7. The movement of the budget line from ab to db could be caused by
A) a decrease in the price of housing.
B) a decrease in the price of food.
C) an increase in the price of housing.
D) an increase in the price of food.
E) a decrease in money income.
FIGURE 6- 7Refer to Figure 6- 7. The movement of the budget line from ab to db could be caused by
A) a decrease in the price of housing.
B) a decrease in the price of food.
C) an increase in the price of housing.
D) an increase in the price of food.
E) a decrease in money income.
Unlock Deck
Unlock for access to all 119 flashcards in this deck.
Unlock Deck
k this deck
13
FIGURE 6- 2-Refer to Figure 6- 2. Suppose that the price of Y is $1 and the consumer's income is $10. Initially, the price of X is $2 and the consumer is buying 4 units of good Y. If the price of X then falls to $1, which of the following pairs of quantities of X correctly completes the demand schedule below?
A) 6, 3
B) 4, 3
C) 4, 4
D) 6, 4
E) 2, 4
Unlock Deck
Unlock for access to all 119 flashcards in this deck.
Unlock Deck
k this deck
14
Suppose a consumer can purchase only two goods, soap and apples. If the price of soap falls and the consumption of apples increases, we can conclude that the increased consumption of apples is due to
A) the income effect only.
B) both the income effect and the substitution effect.
C) the deflation effect.
D) neither the income effect nor the substitution effect.
E) the substitution effect only.
A) the income effect only.
B) both the income effect and the substitution effect.
C) the deflation effect.
D) neither the income effect nor the substitution effect.
E) the substitution effect only.
Unlock Deck
Unlock for access to all 119 flashcards in this deck.
Unlock Deck
k this deck
15
The paradox in "the paradox of value" refers to the
A) confusion between supply curves and demand curves.
B) fact that goods with high total values command high prices.
C) fact that goods with low total values command low prices.
D) situation where a good with a low total value can command a high price, while a good with a high total value can command a low price.
E) situation where a good that is necessary to sustain life is "more valuable" than a decorative, luxury item.
Unlock Deck
Unlock for access to all 119 flashcards in this deck.
Unlock Deck
k this deck
16
In indifference curve analysis, the consumer's utility- maximizing point is where
A) the consumer's marginal utility curve is tangent to the relevant budget line.
B) the indifference curve farthest from the origin intersects with the budget line that is farthest from the origin.
C) each indifference curve has the same slope as the relevant budget line.
D) the price- consumption line is tangent to the budget line.
E) one indifference curve is tangent to the relevant budget line.
Unlock Deck
Unlock for access to all 119 flashcards in this deck.
Unlock Deck
k this deck
17
FIGURE 6- 10Refer to Figure 6- 10. Suppose the consumer begins at E1. The income and substitution effects of the reduction in the price of X are represented as follows:
A) the distance Q1Q2 shows the income effect and the distance Q2Q3 shows the substitution effect.
B) the distance Q1Q2 shows the substitution effect and the distance Q2Q3 shows the income effect.
C) the distance Q1d shows the substitution effect and the distance Q2e shows the income effect.
D) the distance de shows the income effect and the distance cd shows the substitution effect.
E) the distance Q1Q3 shows the substitution effect and the distance Q2Q3 shows the income effect.
Unlock Deck
Unlock for access to all 119 flashcards in this deck.
Unlock Deck
k this deck
18
The idea that the utility a consumer derives from successive units of a good diminishes as total consumption of the good increases is known as
A) diminishing marginal utility.
B) the paradox of value.
C) the utility theory of demand.
D) diminishing total utility.
E) utility maximization.
A) diminishing marginal utility.
B) the paradox of value.
C) the utility theory of demand.
D) diminishing total utility.
E) utility maximization.
Unlock Deck
Unlock for access to all 119 flashcards in this deck.
Unlock Deck
k this deck
19
The real purchasing power of an individual will NOT be affected if
A) money income doubles and the prices of all goods and services are cut in half.
B) money income is cut in half and prices of all goods and services remain constant.
C) money income is cut in half and the prices of all goods and services fall by fifty percent.
D) money income doubles and the prices of all goods and services remain constant.
E) money income falls and the price of one good falls.
Unlock Deck
Unlock for access to all 119 flashcards in this deck.
Unlock Deck
k this deck
20
If total utility is decreasing as more units are consumed, then marginal utility must be
A) negative.
B) decreasing at an increasing rate.
C) decreasing.
D) increasing at a decreasing rate.
E) positive.
A) negative.
B) decreasing at an increasing rate.
C) decreasing.
D) increasing at a decreasing rate.
E) positive.
Unlock Deck
Unlock for access to all 119 flashcards in this deck.
Unlock Deck
k this deck
21
FIGURE 6- 2Refer to Figure 6- 2. If the price of X is $2 and the price of Y is $1 and the consumer is buying 4 units of X and 2 units of Y, the consumer's total utility is
A) 8.
B) 10.
C) 52.
D) 56.
E) 69.
Unlock Deck
Unlock for access to all 119 flashcards in this deck.
Unlock Deck
k this deck
22
If the price of a normal good changes, the income effect of the price change will
A) produce a positively sloped demand curve.
B) reinforce the substitution effect.
C) always be to increase quantity demanded.
D) oppose the substitution effect.
E) always be larger than the substitution effect.
A) produce a positively sloped demand curve.
B) reinforce the substitution effect.
C) always be to increase quantity demanded.
D) oppose the substitution effect.
E) always be larger than the substitution effect.
Unlock Deck
Unlock for access to all 119 flashcards in this deck.
Unlock Deck
k this deck
23
Economists use the term "marginal utility" to describe the
A) average utility of each unit of a good consumed.
B) change in total satisfaction caused by consumption of an additional unit of a good.
C) price paid for every unit consumed.
D) inverse of the measure of total utility.
E) total satisfaction received from consumption of a good.
A) average utility of each unit of a good consumed.
B) change in total satisfaction caused by consumption of an additional unit of a good.
C) price paid for every unit consumed.
D) inverse of the measure of total utility.
E) total satisfaction received from consumption of a good.
Unlock Deck
Unlock for access to all 119 flashcards in this deck.
Unlock Deck
k this deck
24
Marginal utility analysis predicts a downward- sloping demand curve for good X because
A) utility- maximizing consumers equate marginal utility received for each product consumed.
B) all demand curves are downward sloping, regardless of the behaviour of consumers.
C) as PX falls, the ratio MUX/PX becomes smaller, causing the consumer to purchase more of good X.
D) as PX falls, the consumer increases purchases of X such that MUX/PX is equal to MU/P for all other products.
E) as PX rises, the consumer increases purchases of X such that MUX/PX is equal to MU/P for all other products.
Unlock Deck
Unlock for access to all 119 flashcards in this deck.
Unlock Deck
k this deck
25
As a consumer moves along an indifference curve
A) his level of utility will vary as the combinations of goods varies.
B) the combination of goods and the consumer's income level will remain constant.
C) the combination of goods will vary but the level of utility remains constant.
D) the combination of goods will vary, but the level of money income remains constant.
E) the combination of goods he prefers will remain constant, but the level of satisfaction will vary.
Unlock Deck
Unlock for access to all 119 flashcards in this deck.
Unlock Deck
k this deck
26
In economics, the term "utility" is defined as the
A) a service such as sewer and water or electricity.
B) usefulness of a theory to explain price determination.
C) system of basing the price of a good on its usefulness to society.
D) usefulness of a good.
E) total consumer satisfaction received from consumption of a good.
A) a service such as sewer and water or electricity.
B) usefulness of a theory to explain price determination.
C) system of basing the price of a good on its usefulness to society.
D) usefulness of a good.
E) total consumer satisfaction received from consumption of a good.
Unlock Deck
Unlock for access to all 119 flashcards in this deck.
Unlock Deck
k this deck
27
The substitution effect is
A) the change in quantity demanded that occurs when one good is substituted for another.
B) the change in the relative prices of two or more goods.
C) the change in quantity demanded that occurs as a result of a change in absolute prices, with real income held constant.
D) the change in quantity demanded that occurs as a result of a change in relative prices with real income held constant.
E) the change in quantity demanded that occurs as a result of a change in relative prices with money income held constant.
Unlock Deck
Unlock for access to all 119 flashcards in this deck.
Unlock Deck
k this deck
28
A consumer maximizes his or her utility when expenditures are allocated such that
A) the utility received per dollar spent on the last unit of each good is equal.
B) the total number of dollars spent on each good is equal.
C) the utility received from the last unit of each good is equal.
D) the marginal utility is zero for each good consumed utility.
E) the total utility from each good is equal.
Unlock Deck
Unlock for access to all 119 flashcards in this deck.
Unlock Deck
k this deck
29
Consumer surplus is
A) the same as total utility.
B) the marginal value that consumers place on their purchases.
C) the same as Karl Marx's notion of surplus value.
D) the total value that consumers place on their purchases.
E) the sum of the extra value placed on each unit of a commodity above the market price paid for each.
Unlock Deck
Unlock for access to all 119 flashcards in this deck.
Unlock Deck
k this deck
30
The figures below show Chris's consumption of specialty coffee per week. FIGURE 6- 9
Refer to Figure 6- 9. The absolute value of the slope of the budget lines is equal to , which reflects the of specialty coffees in terms of all other goods.
A) the relative price ratio (Pall other goods/Pspecialty coffee); demand
B) the dollar value of all other goods divided by the number of specialty coffees consumed per week; demand
C) the quantity of all other goods consumed divided by the quantity of specialty coffees consumed; quantity
D) $15/value of all other goods; opportunity cost
E) the relative price ratio (Pspecialty coffee/Pall other goods); opportunity cost
FIGURE 6- 9Refer to Figure 6- 9. The absolute value of the slope of the budget lines is equal to , which reflects the of specialty coffees in terms of all other goods.
A) the relative price ratio (Pall other goods/Pspecialty coffee); demand
B) the dollar value of all other goods divided by the number of specialty coffees consumed per week; demand
C) the quantity of all other goods consumed divided by the quantity of specialty coffees consumed; quantity
D) $15/value of all other goods; opportunity cost
E) the relative price ratio (Pspecialty coffee/Pall other goods); opportunity cost
Unlock Deck
Unlock for access to all 119 flashcards in this deck.
Unlock Deck
k this deck
31
-Refer to Table 6- 2. If Dave rents 3 DVDs in one week, his total consumer surplus is and the total amount he pays is .
A) $24.50; $24.50
B) $19.50; $15.00
C) $9.50; $15.00
D) $6.50; $5.00
E) $5.50; $5.00
Unlock Deck
Unlock for access to all 119 flashcards in this deck.
Unlock Deck
k this deck
32
If consumption of a good generates a marginal utility of zero, then consumption of an additional unit would mean that total utility would
A) not change.
B) also be zero.
C) be negative.
D) be increasing.
E) be decreasing.
A) not change.
B) also be zero.
C) be negative.
D) be increasing.
E) be decreasing.
Unlock Deck
Unlock for access to all 119 flashcards in this deck.
Unlock Deck
k this deck
33
FIGURE 6- 1Refer to Figure 6- 1. The marginal utility of the second unit of the good consumed is
A) 50.
B) 30.
C) 40.
D) 10.
E) 20.
Unlock Deck
Unlock for access to all 119 flashcards in this deck.
Unlock Deck
k this deck
34
In indifference curve analysis, a point to the left of the consumer's budget line
A) implies that the household is not spending all of its income on the goods in question.
B) implies the household is paying below- market prices for the goods in question.
C) implies the household is paying above- market prices for the goods in question.
D) shows a combination of goods that are beyond the income of the household.
E) indicates consumption spending beyond current income.
Unlock Deck
Unlock for access to all 119 flashcards in this deck.
Unlock Deck
k this deck
35
Since there is a relatively plentiful supply of water in Canada (this is not true in many parts of the world), the consumption of water in Canada
A) takes place at a relatively high marginal value.
B) takes place at a relatively low marginal value.
C) should be regulated by the government.
D) takes priority over all other goods.
E) should be unlimited at a price of $0.
A) takes place at a relatively high marginal value.
B) takes place at a relatively low marginal value.
C) should be regulated by the government.
D) takes priority over all other goods.
E) should be unlimited at a price of $0.
Unlock Deck
Unlock for access to all 119 flashcards in this deck.
Unlock Deck
k this deck
36
The substitution effect of a price change
A) outweighs the income effect for Giffen goods.
B) is equal to the income effect for normal goods.
C) is equal to the income effect for inferior goods.
D) will result in the consumer buying less of a good at a lower price.
E) will result in the consumer buying less of a good at a higher price.
A) outweighs the income effect for Giffen goods.
B) is equal to the income effect for normal goods.
C) is equal to the income effect for inferior goods.
D) will result in the consumer buying less of a good at a lower price.
E) will result in the consumer buying less of a good at a higher price.
Unlock Deck
Unlock for access to all 119 flashcards in this deck.
Unlock Deck
k this deck
37
FIGURE 6- 8Refer to Figure 6- 8. In part (ii), the consumer's move from point Z to point Y is caused by
A) a change in the consumer's preferences towards milk.
B) an increase in the price of bread.
C) a decrease in money income.
D) an decrease in the price of bread.
E) an increase in the price of milk.
Unlock Deck
Unlock for access to all 119 flashcards in this deck.
Unlock Deck
k this deck
38
The income effect refers to the change in quantity demanded that occurs as a result of a change in
A) real income, with relative prices held constant.
B) preferences, with real income held constant.
C) marginal utility, with real income held constant.
D) money income, with relative prices held constant.
E) relative prices, with real income held constant.
A) real income, with relative prices held constant.
B) preferences, with real income held constant.
C) marginal utility, with real income held constant.
D) money income, with relative prices held constant.
E) relative prices, with real income held constant.
Unlock Deck
Unlock for access to all 119 flashcards in this deck.
Unlock Deck
k this deck
39
If the income effect is negative and larger in absolute terms than the substitution effect, then the demand curve will be
A) vertical.
B) horizontal.
C) upward sloping.
D) downward sloping.
E) of indeterminate slope.
A) vertical.
B) horizontal.
C) upward sloping.
D) downward sloping.
E) of indeterminate slope.
Unlock Deck
Unlock for access to all 119 flashcards in this deck.
Unlock Deck
k this deck
40
Utility
A) can be measured with the appropriate equipment.
B) is not real as we cannot measure it directly.
C) is very difficult to observe empirically.
D) is an objective measure of a good's value.
E) measures the common value of a good, independent of the individual.
A) can be measured with the appropriate equipment.
B) is not real as we cannot measure it directly.
C) is very difficult to observe empirically.
D) is an objective measure of a good's value.
E) measures the common value of a good, independent of the individual.
Unlock Deck
Unlock for access to all 119 flashcards in this deck.
Unlock Deck
k this deck
41
Sophie consumes two goods - paperback novels and visits to the movies. FIGURE 6- 11
Refer to Figure 6- 11. Sophie's movement from point A to point C is
A) the income effect of a decrease in the price of paperback novels.
B) the total effect of a decrease in the price of paperback novels.
C) the income effect of an increase in the price of paperback novels.
D) the total effect of a change in money income.
E) the substitution effect of an increase in the price of paperback novels.
FIGURE 6- 11Refer to Figure 6- 11. Sophie's movement from point A to point C is
A) the income effect of a decrease in the price of paperback novels.
B) the total effect of a decrease in the price of paperback novels.
C) the income effect of an increase in the price of paperback novels.
D) the total effect of a change in money income.
E) the substitution effect of an increase in the price of paperback novels.
Unlock Deck
Unlock for access to all 119 flashcards in this deck.
Unlock Deck
k this deck
42
FIGURE 6- 2Refer to Figure 6- 2. Suppose that the price of X is $2, the price of Y is $1, and the consumer's income is $10. The consumer is currently buying 3 units of good X and 4 units of good Y. In order to maximize his/her utility, the consumer should
A) buy the same amount of X but less Y.
B) buy more of X and less Y.
C) buy more of X but the same amount Y.
D) buy less of X and more Y.
E) not change his/her behaviour.
Unlock Deck
Unlock for access to all 119 flashcards in this deck.
Unlock Deck
k this deck
43
If a consumer is faced with a choice of products A, B, C, ..., and has a given money income, the consumer's utility will be maximized when
A) TUA = TUB = TUC = ...
B) MUA = PA; MUB = PB; MUC = PC; ...
C) MUA = MUB = MUC = ...
D) MUA/PA = MUB/PB = MUC/PC = ...
E) PA = PB = PC = ...
A) TUA = TUB = TUC = ...
B) MUA = PA; MUB = PB; MUC = PC; ...
C) MUA = MUB = MUC = ...
D) MUA/PA = MUB/PB = MUC/PC = ...
E) PA = PB = PC = ...
Unlock Deck
Unlock for access to all 119 flashcards in this deck.
Unlock Deck
k this deck
44
Given a particular market demand curve, consumer surplus is
A) greater the lower the price and the larger the output.
B) less the lower the price and the larger the output.
C) greater the lower the price and the smaller the output.
D) less the lower the price and the smaller the output.
E) greater the higher the price and the smaller the output.
A) greater the lower the price and the larger the output.
B) less the lower the price and the larger the output.
C) greater the lower the price and the smaller the output.
D) less the lower the price and the smaller the output.
E) greater the higher the price and the smaller the output.
Unlock Deck
Unlock for access to all 119 flashcards in this deck.
Unlock Deck
k this deck
45
For your typical consumption levels of water and diamonds, the good with the higher marginal utility is ; the good with the higher total utility is ; and the good with the greatest consumer surplus is .
A) water; water; water
B) diamonds; water; water
C) water; water; diamonds
D) water; diamonds; water
E) diamonds; water; diamonds
A) water; water; water
B) diamonds; water; water
C) water; water; diamonds
D) water; diamonds; water
E) diamonds; water; diamonds
Unlock Deck
Unlock for access to all 119 flashcards in this deck.
Unlock Deck
k this deck
46
When a consumer's marginal rate of substitution between X and Y is equal to the ratio of prices for X and Y, and when the consumer is spending all available income, then
A) a higher indifference curve can be reached given the existing budget line.
B) all budget lines are tangent to all indifference curves.
C) the consumer is not maximizing his utility.
D) the budget line is tangent to the indifference curve at all quantities of X and Y.
E) the budget line is tangent to the indifference curve.
Unlock Deck
Unlock for access to all 119 flashcards in this deck.
Unlock Deck
k this deck
47
The figures below show Chris's consumption of specialty coffee per week. FIGURE 6- 9
Refer to Figure 6- 9. Suppose Chris's income is such that he is able to buy no more than 10 specialty coffees per week. If Chris is maximizing his utility at this level of income, how many specialty coffees is he consuming per week?
A) 2
B) 4
C) 5
D) 6
E) 10
FIGURE 6- 9Refer to Figure 6- 9. Suppose Chris's income is such that he is able to buy no more than 10 specialty coffees per week. If Chris is maximizing his utility at this level of income, how many specialty coffees is he consuming per week?
A) 2
B) 4
C) 5
D) 6
E) 10
Unlock Deck
Unlock for access to all 119 flashcards in this deck.
Unlock Deck
k this deck
48
Suppose a consumer can purchase only two goods, pasta and cheese. Let the quantity of pasta be measured on the vertical axis and the quantity of cheese be measured on the horizontal axis. If the price of pasta falls, with no change in the price of cheese or in the consumer's money income, then the budget line for the consumer will shift
A) outward parallel to the existing budget line.
B) away from the origin and become steeper.
C) away from the origin and become flatter.
D) toward the origin and become steeper.
E) toward the origin and become flatter.
A) outward parallel to the existing budget line.
B) away from the origin and become steeper.
C) away from the origin and become flatter.
D) toward the origin and become steeper.
E) toward the origin and become flatter.
Unlock Deck
Unlock for access to all 119 flashcards in this deck.
Unlock Deck
k this deck
49
Since there is a limited supply of diamonds in the world, the consumption of diamonds
A) takes place at relatively high marginal value.
B) takes place at relatively low marginal value.
C) takes priority over some other good.
D) is no less important than consumption of water.
E) should be regulated by the government.
A) takes place at relatively high marginal value.
B) takes place at relatively low marginal value.
C) takes priority over some other good.
D) is no less important than consumption of water.
E) should be regulated by the government.
Unlock Deck
Unlock for access to all 119 flashcards in this deck.
Unlock Deck
k this deck
50
-Refer to Table 6- 1. If the prices of toffee bars and bags of cashews are both $1 and this consumer has $7 per week to spend on these two snacks, how many of each will he/she purchase to maximize utility?
A) 2 toffee bars and 5 bags of cashews.
B) 5 toffee bars and 2 bags of cashews.
C) 3 toffee bars and 4 bags of cashews.
D) 4 toffee bars and 3 bags of cashews.
E) 6 toffee bars and 1 bag of cashews.
Unlock Deck
Unlock for access to all 119 flashcards in this deck.
Unlock Deck
k this deck
51
FIGURE 6- 8Refer to Figure 6- 8. In part (i), the line joining points A, B, and C is known as , which shows how .
A) a price- consumption line; consumption changes as money income and relative prices change
B) an indifference map; the value of various combinations of two goods changes.
C) an income- consumption line; consumption changes as income changes, with relative prices held constant
D) a price- consumption line; consumption changes as relative prices change, with money income constant
E) an income- consumption line; consumption changes with changing relative prices and constant income
Unlock Deck
Unlock for access to all 119 flashcards in this deck.
Unlock Deck
k this deck
52
The marginal rate of substitution
A) is equal to the price ratio on the budget line.
B) always has a positive algebraic value.
C) is constant as one moves along a particular indifference curve.
D) is the amount of one good the consumer is willing to give up in exchange for another so as to keep total expenditure unchanged.
E) is the amount of one good the consumer is willing to give up in exchange for another so as to keep total satisfaction unchanged.
Unlock Deck
Unlock for access to all 119 flashcards in this deck.
Unlock Deck
k this deck
53
FIGURE 6- 6Refer to Figure 6- 6. Suppose that price is P0. The market value of the quantity purchased is given by the area
A) under the demand curve to the left of Q0.
B) below P0 and to the left of Q0.
C) under the demand curve.
D) under the demand curve and to the right of Q0.
E) under the demand curve and above P0.
Unlock Deck
Unlock for access to all 119 flashcards in this deck.
Unlock Deck
k this deck
54
A demand curve for a normal good is downward sloping due to
A) the substitution effect.
B) the combination of income and substitution effects.
C) the income effect.
D) neither the substitution effect nor the income effect.
E) the Giffen effect.
A) the substitution effect.
B) the combination of income and substitution effects.
C) the income effect.
D) neither the substitution effect nor the income effect.
E) the Giffen effect.
Unlock Deck
Unlock for access to all 119 flashcards in this deck.
Unlock Deck
k this deck
55
FIGURE 6- 1Refer to Figure 6- 1. Total utility is at its maximum when marginal utility is
A) at the maximum.
B) equal to total utility.
C) negative.
D) positive.
E) equal to zero.
Unlock Deck
Unlock for access to all 119 flashcards in this deck.
Unlock Deck
k this deck
56
Assume an individual with a downward- sloping demand curve is paying a single price for each unit of some commodity. He will get consumer surplus on
A) none of the units.
B) the first unit only.
C) all units bought with the possible exception of the last unit.
D) all of the units bought.
E) all units that were not bought at that particular price.
A) none of the units.
B) the first unit only.
C) all units bought with the possible exception of the last unit.
D) all of the units bought.
E) all units that were not bought at that particular price.
Unlock Deck
Unlock for access to all 119 flashcards in this deck.
Unlock Deck
k this deck
57
FIGURE 6- 8Refer to Figure 6- 8. In part (i), the consumer is able to move from point A to point B because of
A) a decrease in money income.
B) a decrease in the price of one good and an increase in money income.
C) a decrease in the price of bread.
D) a decrease in the price of milk.
E) an increase in real income.
Unlock Deck
Unlock for access to all 119 flashcards in this deck.
Unlock Deck
k this deck
58
The Smith family is allocating its monthly household expenditure between only two goods, food and
Clothing. Suppose that the price of food is $12 per unit, and the price of clothing is $16 per unit and that the marginal utility that the family is receiving from its consumption of clothing is currently
200. What is the family's marginal utility from its consumption of food if it is maximizing its utility?
A) 75
B) 16
C) 12
D) 150
E) 200
Unlock Deck
Unlock for access to all 119 flashcards in this deck.
Unlock Deck
k this deck
59
Suppose a consumer can purchase only two goods, beef and chicken. If the price of beef falls (with all other variables held constant), and the consumption of chicken increases, we can conclude that the increased consumption of chicken is due to
A) a change in the consumer's preference toward chicken.
B) the substitution effect only.
C) the income effect only.
D) neither the income effect nor the substitution effect.
E) both the income effect and the substitution effect.
A) a change in the consumer's preference toward chicken.
B) the substitution effect only.
C) the income effect only.
D) neither the income effect nor the substitution effect.
E) both the income effect and the substitution effect.
Unlock Deck
Unlock for access to all 119 flashcards in this deck.
Unlock Deck
k this deck
60
FIGURE 6- 4Refer to Figure 6- 4. For both goods, the price increases from P0 to P1. The substitution effect is illustrated by the change in quantity demanded from A to B; the income effect is illustrated by the change in quantity demanded from B to C. Good Y is certainly a(n) good.
A) normal
B) Giffen
C) luxury
D) necessity
E) inferior
Unlock Deck
Unlock for access to all 119 flashcards in this deck.
Unlock Deck
k this deck
61
FIGURE 6- 1Refer to Figure 6- 1. Marginal utility is zero when total utility is
A) is increasing.
B) equal to zero.
C) at its maximum.
D) is decreasing.
E) equal to marginal utility.
Unlock Deck
Unlock for access to all 119 flashcards in this deck.
Unlock Deck
k this deck
62
Economists usually assume that consumers
A) are motivated to maximize their utility.
B) spend all of their current income.
C) are poor judges of what is best for them.
D) are motivated to maximize their profit.
E) usually save as much as possible of their income.
A) are motivated to maximize their utility.
B) spend all of their current income.
C) are poor judges of what is best for them.
D) are motivated to maximize their profit.
E) usually save as much as possible of their income.
Unlock Deck
Unlock for access to all 119 flashcards in this deck.
Unlock Deck
k this deck
63
A parallel shift in the consumer's budget line always indicates a change in
A) at least one money price.
B) both prices.
C) money income.
D) tastes.
E) real income.
A) at least one money price.
B) both prices.
C) money income.
D) tastes.
E) real income.
Unlock Deck
Unlock for access to all 119 flashcards in this deck.
Unlock Deck
k this deck
64
Consider a consumer who divides his income between spending on good X and good Y. The opportunity cost of good X in terms of good Y is reflected by the
A) price of good X relative to the prices of all other goods.
B) ratio of the price of X to the price of Y.
C) absolute price of good X.
D) ratio of the price of Y to the price of X.
E) absolute price of good Y.
A) price of good X relative to the prices of all other goods.
B) ratio of the price of X to the price of Y.
C) absolute price of good X.
D) ratio of the price of Y to the price of X.
E) absolute price of good Y.
Unlock Deck
Unlock for access to all 119 flashcards in this deck.
Unlock Deck
k this deck
65
The diagram below shows a set of budget lines facing a household. FIGURE 6- 7
Refer to Figure 6- 7. The movement of the budget line from ab to ef could be caused by
A) a decrease in money income.
B) an equal percentage increase in the price of both food and housing.
C) an equal percentage decrease in the price of both food and housing.
D) a decrease in the price of either food or housing.
E) an increase in the price of either food or housing.
FIGURE 6- 7Refer to Figure 6- 7. The movement of the budget line from ab to ef could be caused by
A) a decrease in money income.
B) an equal percentage increase in the price of both food and housing.
C) an equal percentage decrease in the price of both food and housing.
D) a decrease in the price of either food or housing.
E) an increase in the price of either food or housing.
Unlock Deck
Unlock for access to all 119 flashcards in this deck.
Unlock Deck
k this deck
66
Suppose Arun consumes only 2 goods -- books and CDs -- and has a set of downward sloping indifference curves. As Arun moves from one point to another on a particular indifference curve,
A) the combination of books and CDs that Arun prefers will remain constant, but the level of satisfaction will vary.
B) the combination of books and CDs will vary, but the level of utility remains constant.
C) Arun is consuming the same combination of goods, but with varying levels of income.
D) Arun's level of satisfaction will vary as the combinations of books and CDs varies.
E) the combination of books and CDs and Arun's income level will remain constant.
Unlock Deck
Unlock for access to all 119 flashcards in this deck.
Unlock Deck
k this deck
67
FIGURE 6- 2Refer to Figure 6- 2. Suppose the price of Y is $1 and the consumer's income is $10. Initially, the price of X is $2 and the consumer is buying 3 units of good X and 4 units of good Y. If the price of X then falls to $1, what quantities of X and Y will he/she now purchase in order to maximize total utility?
A) 5 X and 5 Y.
B) 6 X and 4 Y.
C) 2 X and 8 Y.
D) 4 X and 6 Y.
E) 3 X and 7 Y.
Unlock Deck
Unlock for access to all 119 flashcards in this deck.
Unlock Deck
k this deck
68
Assume a person reveals the following demand conditions. At a price of $10, quantity demanded is zero; and at a price of $1, quantity demanded is 10 units.
A) The consumer surplus will be the area under the entire demand curve.
B) Demand decreases as the price decreases.
C) The lower the price the smaller the consumer surplus.
D) The consumer surplus will be zero at a price of $10.
E) The consumer surplus is zero at a price of $1.
A) The consumer surplus will be the area under the entire demand curve.
B) Demand decreases as the price decreases.
C) The lower the price the smaller the consumer surplus.
D) The consumer surplus will be zero at a price of $10.
E) The consumer surplus is zero at a price of $1.
Unlock Deck
Unlock for access to all 119 flashcards in this deck.
Unlock Deck
k this deck
69
Any consumption point that is on the budget line
A) indicates consumption spending beyond current income.
B) implies that the household is not spending all of its income on the goods in question.
C) implies the household is paying above- market prices for the goods in question.
D) implies the household is paying below- market prices for the goods in question.
E) implies that the household is spending all of its income on the goods in question.
Unlock Deck
Unlock for access to all 119 flashcards in this deck.
Unlock Deck
k this deck
70
The figures below show Chris's consumption of specialty coffee per week. FIGURE 6- 9
Refer to Figure 6- 9. The two diagrams in Figure 6- 9 are showing
A) that Chris is indifferent between bundles A, B and C.
B) the derivation of Chris's demand curve for specialty coffee.
C) the change in Chris's preferences toward specialty coffee.
D) that Chris is indifferent between points D, E and F.
E) the derivation of Chris's indifference curve for specialty coffee.
FIGURE 6- 9Refer to Figure 6- 9. The two diagrams in Figure 6- 9 are showing
A) that Chris is indifferent between bundles A, B and C.
B) the derivation of Chris's demand curve for specialty coffee.
C) the change in Chris's preferences toward specialty coffee.
D) that Chris is indifferent between points D, E and F.
E) the derivation of Chris's indifference curve for specialty coffee.
Unlock Deck
Unlock for access to all 119 flashcards in this deck.
Unlock Deck
k this deck
71
An indifference curve plotted for two different goods on the axes
A) shows the different combinations of two goods that the same income can purchase.
B) shows all combinations of the two goods that give the same level of utility.
C) changes its slope as the relative prices of the two goods change.
D) shifts when real income changes.
E) shows the combinations of the two goods that will just use up a consumer's income.
Unlock Deck
Unlock for access to all 119 flashcards in this deck.
Unlock Deck
k this deck
72
FIGURE 6- 3Refer to Figure 6- 3. For both goods, the price falls from P0 to P1. The substitution effect is illustrated by the change in quantity demanded from A to B; the income effect is illustrated by the change in quantity demanded from B to C. Good Y is certainly a(n) good.
A) luxury
B) normal
C) inferior
D) necessity
E) Giffen
Unlock Deck
Unlock for access to all 119 flashcards in this deck.
Unlock Deck
k this deck
73
For a product with an income elasticity greater than one, a price increase will cause the consumer's real income to
A) rise and the quantity purchased to fall.
B) fall and the quantity purchased to rise.
C) fall and the quantity purchased to fall.
D) remain constant.
E) rise and the quantity purchased to rise.
A) rise and the quantity purchased to fall.
B) fall and the quantity purchased to rise.
C) fall and the quantity purchased to fall.
D) remain constant.
E) rise and the quantity purchased to rise.
Unlock Deck
Unlock for access to all 119 flashcards in this deck.
Unlock Deck
k this deck
74
FIGURE 6- 2Refer to Figure 6- 2. Suppose the price of Y is $1, the consumer's income is $10, and the consumer is currently buying 3 units of good X and 4 units of good Y. If this consumer is maximizing her utility, then the price of X must be
A) $1.
B) $2.
C) $3.
D) $4.
E) impossible to tell with the given information.
Unlock Deck
Unlock for access to all 119 flashcards in this deck.
Unlock Deck
k this deck
75
Suppose a utility- maximizing person consumes only two goods, hamburgers and milkshakes. Suppose the price of milkshakes rises and all other variables remain constant. As a result, this person will certainly
A) reduce his/her consumption of both milkshakes and hamburgers.
B) not increase his consumption of both milkshakes and hamburgers.
C) purchase more milkshakes and fewer hamburgers.
D) increase his/her consumption of milkshakes.
E) consume more hamburgers and the same amount of milkshakes.
A) reduce his/her consumption of both milkshakes and hamburgers.
B) not increase his consumption of both milkshakes and hamburgers.
C) purchase more milkshakes and fewer hamburgers.
D) increase his/her consumption of milkshakes.
E) consume more hamburgers and the same amount of milkshakes.
Unlock Deck
Unlock for access to all 119 flashcards in this deck.
Unlock Deck
k this deck
76
FIGURE 6- 6Refer to Figure 6- 6. Suppose that price is P0. Total consumer surplus is then given by the area
A) under the demand curve to the left of Q0, but above P0.
B) under the demand curve to the left of Q0.
C) under the entire demand curve.
D) above the market price.
E) below P0 and to the left of Q0.
Unlock Deck
Unlock for access to all 119 flashcards in this deck.
Unlock Deck
k this deck
77
-Refer to Table 6- 1. If the prices of both toffee bars and bags of cashews are $2 and this consumer has $14 per week to spend on these two snacks, what is the maximum total utility achievable?
A) 10
B) 15
C) 33
D) 45
E) 57
Unlock Deck
Unlock for access to all 119 flashcards in this deck.
Unlock Deck
k this deck
78
At a garage sale, Dominique purchases a sewing machine for $30 when she was willing to pay $55. If the sewing machine costs $200 new, Dominique's consumer surplus would be _ .
A) $0
B) $25
C) $120
D) $145
E) $170
A) $0
B) $25
C) $120
D) $145
E) $170
Unlock Deck
Unlock for access to all 119 flashcards in this deck.
Unlock Deck
k this deck
79
A basic hypothesis of marginal utility theory is that the utility a consumer derives from successive units of a good diminishes as total consumption of the good increases. This hypothesis is known as
A) utility maximization.
B) the law of diminishing marginal utility.
C) the law of diminishing total utility.
D) the paradox of value.
E) the utility theory of demand.
A) utility maximization.
B) the law of diminishing marginal utility.
C) the law of diminishing total utility.
D) the paradox of value.
E) the utility theory of demand.
Unlock Deck
Unlock for access to all 119 flashcards in this deck.
Unlock Deck
k this deck
80
The total value that Doug places on his consumption of computer games equals
A) price times marginal value.
B) his marginal utility multiplied by quantity demanded.
C) the total amount he pays for all the games he purchases.
D) his total expenditure on computer games plus his consumer surplus.
E) the price multiplied by quantity demanded.
A) price times marginal value.
B) his marginal utility multiplied by quantity demanded.
C) the total amount he pays for all the games he purchases.
D) his total expenditure on computer games plus his consumer surplus.
E) the price multiplied by quantity demanded.
Unlock Deck
Unlock for access to all 119 flashcards in this deck.
Unlock Deck
k this deck
Unlock Deck
Unlock for access to all 119 flashcards in this deck.


