Deck 17: The Economics of Environmental Protection
Full screen (f)
Question
Question
Question
Question
Question
Question
Question
The diagram below shows the market for tradable pollution permits. 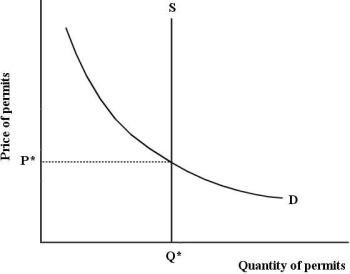 Figure 17- 7
Refer to Figure 17- 7, which depicts the market for tradable pollution permits. If there is an increase in firms' marginal cost of pollution abatement,
A) the price of pollution permits will fall.
B) firms decide to abate more pollution.
C) firms will demand fewer pollution permits.
D) firms will demand more pollution permits.
E) firms require exactly Q* permits.
Figure 17- 7Refer to Figure 17- 7, which depicts the market for tradable pollution permits. If there is an increase in firms' marginal cost of pollution abatement,
A) the price of pollution permits will fall.
B) firms decide to abate more pollution.
C) firms will demand fewer pollution permits.
D) firms will demand more pollution permits.
E) firms require exactly Q* permits.
Question
The diagram below shows the marginal cost of pollution abatement for two firms, Firm X and Firm Y. 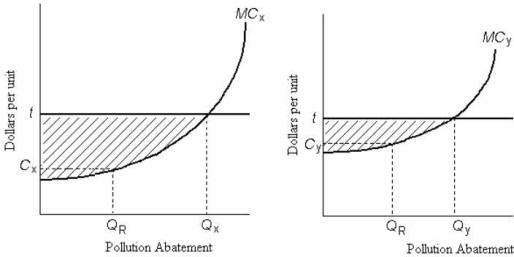 FIGURE 17- 4
Refer to Figure 17- 4. Ignore the horizontal line at t. Suppose the government requires each firm to reduce pollution by the same amount, QR. The result will be
A) fair and just because both firms are facing the same requirements.
B) economically inefficient because Firm Y is then abating pollution at a higher marginal cost than Firm X.
C) economically efficient because the maximum amount of pollution will be abated.
D) economically efficient because even though their marginal costs of abatement differ, the marginal cost for the last unit of abatement is equal.
E) economically inefficient because Firm X is not producing as much pollution as Firm Y and therefore should not be faced with the same requirements.
FIGURE 17- 4Refer to Figure 17- 4. Ignore the horizontal line at t. Suppose the government requires each firm to reduce pollution by the same amount, QR. The result will be
A) fair and just because both firms are facing the same requirements.
B) economically inefficient because Firm Y is then abating pollution at a higher marginal cost than Firm X.
C) economically efficient because the maximum amount of pollution will be abated.
D) economically efficient because even though their marginal costs of abatement differ, the marginal cost for the last unit of abatement is equal.
E) economically inefficient because Firm X is not producing as much pollution as Firm Y and therefore should not be faced with the same requirements.
Question
Question
Question
Question
Question
Question
The diagram below shows the marginal costs of pollution abatement for two firms, Firm 1 and Firm 2.  FIGURE 17- 5
Refer to Figure 17- 5. If the government requires each firm to abate Q3 units of pollution, the social costs of this abatement
A) could be reduced further if Firm 2 increased abatement and Firm 1 reduced its abatement by the same amount.
B) could be reduced further if each firm was required to abate more.
C) could be reduced further if each firm was allowed to pollute more.
D) would be minimized.
E) could be reduced further if Firm 1 increased its abatement and Firm 2 reduced its abatement by the same amount.
FIGURE 17- 5Refer to Figure 17- 5. If the government requires each firm to abate Q3 units of pollution, the social costs of this abatement
A) could be reduced further if Firm 2 increased abatement and Firm 1 reduced its abatement by the same amount.
B) could be reduced further if each firm was required to abate more.
C) could be reduced further if each firm was allowed to pollute more.
D) would be minimized.
E) could be reduced further if Firm 1 increased its abatement and Firm 2 reduced its abatement by the same amount.
Question
The diagram below shows the marginal cost of abatement for each of two firms, A and B. Each firm is initially abating Q0 units of pollution.  FIGURE 17- 6
Refer to Figure 17- 6. Suppose that a system of tradable pollution permits is introduced into this market and the equilibrium permit price is p*. Firm B will buy permits from Firm A because
A) its total cost of abating less (areas 1+2+3) exceeds the cost of buying the permits (areas 2+3).
B) Firm B can buy the permits at a lower price than Firm A.
C) its total savings from abating less (areas 1+2+3) exceed the cost of buying the permits (areas 2+3).
D) Firm B has lower costs of pollution abatement than Firm A.
E) its total savings from abating less (areas 1+2+3) exceed the total costs of Firm A abating more (area 6).
FIGURE 17- 6Refer to Figure 17- 6. Suppose that a system of tradable pollution permits is introduced into this market and the equilibrium permit price is p*. Firm B will buy permits from Firm A because
A) its total cost of abating less (areas 1+2+3) exceeds the cost of buying the permits (areas 2+3).
B) Firm B can buy the permits at a lower price than Firm A.
C) its total savings from abating less (areas 1+2+3) exceed the cost of buying the permits (areas 2+3).
D) Firm B has lower costs of pollution abatement than Firm A.
E) its total savings from abating less (areas 1+2+3) exceed the total costs of Firm A abating more (area 6).
Question
Question
The diagram below shows the marginal cost of abatement for each of two firms, A and B. Each firm is initially abating Q0 units of pollution. 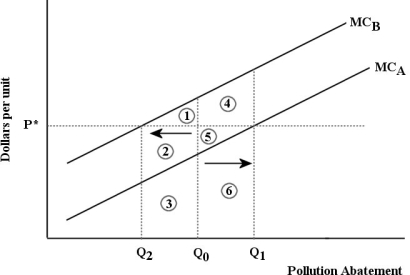 FIGURE 17- 6
Refer to Figure 17- 6. Suppose that a system of tradable pollution permits is introduced into this market and the equilibrium permit price is p×. Firm A will sell permits to Firm B because
A) Firm B has lower costs of pollution abatement than Firm A.
B) the revenue Firm A earns from selling permits (areas 5 + 6) is greater than the cost it incurs from abating more pollution (area 6).
C) Firm A can buy the permits at a lower price than Firm B.
D) Firm A's total cost of abating more pollution (area 6) is less than the revenue it earns from selling the permits (areas 4 + 5).
E) Firm A's total cost of abating more pollution (areas 5 + 6) is less than the revenue it earns from selling the permits (areas 4 + 5 + 6).
FIGURE 17- 6Refer to Figure 17- 6. Suppose that a system of tradable pollution permits is introduced into this market and the equilibrium permit price is p×. Firm A will sell permits to Firm B because
A) Firm B has lower costs of pollution abatement than Firm A.
B) the revenue Firm A earns from selling permits (areas 5 + 6) is greater than the cost it incurs from abating more pollution (area 6).
C) Firm A can buy the permits at a lower price than Firm B.
D) Firm A's total cost of abating more pollution (area 6) is less than the revenue it earns from selling the permits (areas 4 + 5).
E) Firm A's total cost of abating more pollution (areas 5 + 6) is less than the revenue it earns from selling the permits (areas 4 + 5 + 6).
Question
Question
Question
Question
Question
Question
The diagram below show the private and social marginal costs and the social marginal benefits of producing disposable diapers. 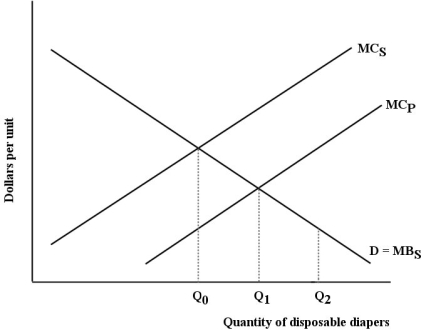 FIGURE 17- 2
Refer to Figure 17- 2. The allocatively efficient level of production and use of disposable diapers is
A) Q0, because that is where MCS equals MBS.
B) Q0, because that is where MCS exceeds MCP.
C) Q2, because that is where the externality is internalized.
D) Q1, because that is where MCP equals MBS.
E) Q1, because that is where MCS equals MBS.
FIGURE 17- 2Refer to Figure 17- 2. The allocatively efficient level of production and use of disposable diapers is
A) Q0, because that is where MCS equals MBS.
B) Q0, because that is where MCS exceeds MCP.
C) Q2, because that is where the externality is internalized.
D) Q1, because that is where MCP equals MBS.
E) Q1, because that is where MCS equals MBS.
Question
Question
Question
Question
The diagram below shows the marginal cost of pollution abatement for two firms, Firm X and Firm Y.  FIGURE 17- 4
Refer to Figure 17- 4. Firms X and Y have an emissions tax of $t imposed on each unit of pollution they produce. If Firm X chooses to abate QX units of pollution, the total cost of its abatement is
A) tax amount t multiplied by the level of pollution abatement, QX.
B) area beneath the marginal cost of pollution abatement curve.
C) area below the horizontal line at t and above the MC of pollution abatement curve.
D) area beneath the marginal cost of pollution abatement curve up to QX.
E) tax amount t multiplied by the maximum possible level of pollution abatement.
FIGURE 17- 4Refer to Figure 17- 4. Firms X and Y have an emissions tax of $t imposed on each unit of pollution they produce. If Firm X chooses to abate QX units of pollution, the total cost of its abatement is
A) tax amount t multiplied by the level of pollution abatement, QX.
B) area beneath the marginal cost of pollution abatement curve.
C) area below the horizontal line at t and above the MC of pollution abatement curve.
D) area beneath the marginal cost of pollution abatement curve up to QX.
E) tax amount t multiplied by the maximum possible level of pollution abatement.
Question
Question
The diagram below show the private and social marginal costs and the social marginal benefits of producing disposable diapers.  FIGURE 17- 2
Refer to Figure 17- 2. The net social benefit derived from the production and use of disposable diapers is
A) zero at Q0, because that is where MCS equals MBS.
B) at a maximum at Q1, because that is where MCS equals MBS.
C) at a minimum at Q0, because MCS exceeds MCP.
D) zero at Q2, because that is where the externality is internalized.
E) at a maximum at Q0, because that is where MCS equals MBS.
FIGURE 17- 2Refer to Figure 17- 2. The net social benefit derived from the production and use of disposable diapers is
A) zero at Q0, because that is where MCS equals MBS.
B) at a maximum at Q1, because that is where MCS equals MBS.
C) at a minimum at Q0, because MCS exceeds MCP.
D) zero at Q2, because that is where the externality is internalized.
E) at a maximum at Q0, because that is where MCS equals MBS.
Question
The figure below shows the demand and supply curves for pollution abatement. 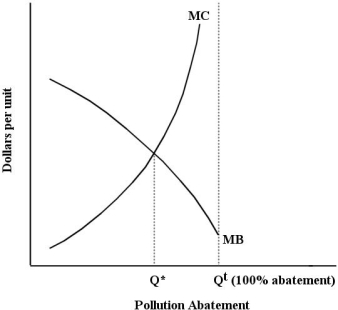 FIGURE 17- 3
Refer to Figure 17- 3. The socially optimal amount of pollution is
A) Qt - Q*.
B) Q* + Qt.
C) 0.
D) Q*.
E) Qt.
FIGURE 17- 3Refer to Figure 17- 3. The socially optimal amount of pollution is
A) Qt - Q*.
B) Q* + Qt.
C) 0.
D) Q*.
E) Qt.
Question
Question
The diagram below shows the marginal cost of abatement for each of two firms, A and B. Each firm is initially abating Q0 units of pollution.  FIGURE 17- 6
Refer to Figure 17- 6. Suppose that a system of tradable pollution permits is introduced into this market and the equilibrium permit price is p*. The effect will be that
A) Firm B will abate less pollution-the amount Q2, and Firm A will abate more pollution-the amount Q1.
B) Firms A and B will each abate Q0 units of pollution.
C) Firms A and B will each abate Q2 units of pollution.
D) there will be no change in the quantity of abatement by each firm.
E) Firm A will abate less pollution-the amount Q2, and Firm B will abate more pollution-the amount Q1.
FIGURE 17- 6Refer to Figure 17- 6. Suppose that a system of tradable pollution permits is introduced into this market and the equilibrium permit price is p*. The effect will be that
A) Firm B will abate less pollution-the amount Q2, and Firm A will abate more pollution-the amount Q1.
B) Firms A and B will each abate Q0 units of pollution.
C) Firms A and B will each abate Q2 units of pollution.
D) there will be no change in the quantity of abatement by each firm.
E) Firm A will abate less pollution-the amount Q2, and Firm B will abate more pollution-the amount Q1.
Question
Question
Question
Question
Question
Question
Question
The figure below shows the marginal benefit to consumers, MB, the marginal cost to private firms, MCp, and the marginal cost to society, MCs, at each level of output of some good. 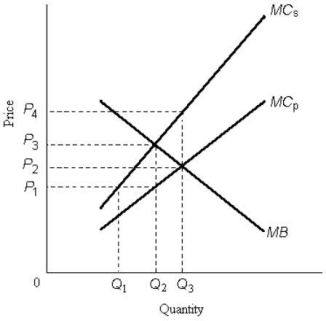 FIGURE 17- 1
Refer to Figure 17- 1. The price that leads consumers to demand the socially optimal quantity of output is
A) P3.
B) P2.
C) P1.
D) zero.
E) not possible to know from the information given.
FIGURE 17- 1Refer to Figure 17- 1. The price that leads consumers to demand the socially optimal quantity of output is
A) P3.
B) P2.
C) P1.
D) zero.
E) not possible to know from the information given.
Question
Question
Question
The diagram below shows the marginal cost of pollution abatement for two firms, Firm X and Firm Y.  FIGURE 17- 4
Refer to Figure 17- 4. Firms X and Y have an emissions tax of $t imposed on each unit of pollution they produce. Firm X will choose to abate pollution of units and Firm Y will choose to abate pollution of units.
A) QR; QY
B) QX; QR
C) QR; QR
D) 0; 0
E) QX; QY
FIGURE 17- 4Refer to Figure 17- 4. Firms X and Y have an emissions tax of $t imposed on each unit of pollution they produce. Firm X will choose to abate pollution of units and Firm Y will choose to abate pollution of units.
A) QR; QY
B) QX; QR
C) QR; QR
D) 0; 0
E) QX; QY
Question
The diagram below shows the market for tradable pollution permits.  Figure 17- 7
Refer to Figure 17- 7, which depicts the market for tradable pollution permits. Improvements in firms' abatement technology will be expected to
A) shift the demand curve to the left.
B) shift the supply curve to the right.
C) shift the supply curve to the left.
D) shift the demand curve to the right.
E) not have any impact on the equilibrium.
Figure 17- 7Refer to Figure 17- 7, which depicts the market for tradable pollution permits. Improvements in firms' abatement technology will be expected to
A) shift the demand curve to the left.
B) shift the supply curve to the right.
C) shift the supply curve to the left.
D) shift the demand curve to the right.
E) not have any impact on the equilibrium.
Question
Question
Question
Question
Question
Question
Question
Question
Question
The figure below shows the marginal benefit to consumers, MB, the marginal cost to private firms, MCp, and the marginal cost to society, MCs, at each level of output of some good.  FIGURE 17- 1
Refer to Figure 17- 1. The socially optimal level of output is
A) Q1.
B) Q3.
C) Q2.
D) zero.
E) none of the above; there is no optimal output level.
FIGURE 17- 1Refer to Figure 17- 1. The socially optimal level of output is
A) Q1.
B) Q3.
C) Q2.
D) zero.
E) none of the above; there is no optimal output level.
Question
Question
The diagram below shows the marginal costs of pollution abatement for two firms, Firm 1 and Firm 2.  FIGURE 17- 5
Refer to Figure 17- 5. Suppose Firm 1 and Firm 2 are each abating Q3 units of pollution. If the government imposes an emissions tax of $20 per unit of emissions,
A) Firm 1 will increase abatement beyond Q3 and Firm 2 will abate less than Q3.
B) Firm 1 and Firm 2 will each increase abatement beyond Q3.
C) the level of pollution abatement will be optimal.
D) Firm 1 will abate less than Q3, and Firm 2 will not abate any pollution at all.
E) neither firm will abate any pollution.
FIGURE 17- 5Refer to Figure 17- 5. Suppose Firm 1 and Firm 2 are each abating Q3 units of pollution. If the government imposes an emissions tax of $20 per unit of emissions,
A) Firm 1 will increase abatement beyond Q3 and Firm 2 will abate less than Q3.
B) Firm 1 and Firm 2 will each increase abatement beyond Q3.
C) the level of pollution abatement will be optimal.
D) Firm 1 will abate less than Q3, and Firm 2 will not abate any pollution at all.
E) neither firm will abate any pollution.
Question
Question
Question
Question
The diagram below shows the marginal cost of pollution abatement for two firms, Firm X and Firm Y.  FIGURE 17- 4
Refer to Figure 17- 4. Ignore the horizontal line at t. If the government wanted to impose an emissions tax, efficiency requires that it
A) impose the same tax on both firms and also fix the amount of pollution abatement at QR for each firm.
B) tax only the low- cost firm (Firm X) and fix the amount of pollution abatement for the high- cost firm (Firm Y).
C) choose a different tax rate for each firm so that each firm abates QR units of pollution.
D) levy a tax at the same rate to both firms.
E) tax only the high- cost firm (Firm Y) and fix the amount of pollution abatement for the low- cost firm (Firm X).
FIGURE 17- 4Refer to Figure 17- 4. Ignore the horizontal line at t. If the government wanted to impose an emissions tax, efficiency requires that it
A) impose the same tax on both firms and also fix the amount of pollution abatement at QR for each firm.
B) tax only the low- cost firm (Firm X) and fix the amount of pollution abatement for the high- cost firm (Firm Y).
C) choose a different tax rate for each firm so that each firm abates QR units of pollution.
D) levy a tax at the same rate to both firms.
E) tax only the high- cost firm (Firm Y) and fix the amount of pollution abatement for the low- cost firm (Firm X).
Question
Question
Question
Question
The figure below shows the marginal benefit to consumers, MB, the marginal cost to private firms, MCp, and the marginal cost to society, MCs, at each level of output of some good.  FIGURE 17- 1
Refer to Figure 17- 1. The price that would occur in a competitive market in the absence of government intervention is
A) P3.
B) P2.
C) P4.
D) P1.
E) not possible to know from the information given.
FIGURE 17- 1Refer to Figure 17- 1. The price that would occur in a competitive market in the absence of government intervention is
A) P3.
B) P2.
C) P4.
D) P1.
E) not possible to know from the information given.
Question
Question
Question
The figure below shows the marginal benefit to consumers, MB, the marginal cost to private firms, MCp, and the marginal cost to society, MCs, at each level of output of some good.  FIGURE 17- 1
Refer to Figure 17- 1. The equilibrium output that would occur in a competitive market in the absence of government intervention is
A) zero.
B) Q3.
C) Q1.
D) Q2.
E) none of the above; there is no equilibrium output level.
FIGURE 17- 1Refer to Figure 17- 1. The equilibrium output that would occur in a competitive market in the absence of government intervention is
A) zero.
B) Q3.
C) Q1.
D) Q2.
E) none of the above; there is no equilibrium output level.
Question
Question
Question
Question
The diagram below shows the market for tradable pollution permits.  Figure 17- 7
Refer to Figure 17- 7, which depicts the market for tradable pollution permits. The equilibrium price p*
A) is not a function of the abatement technology.
B) is always equal to the subsidy provided by the government.
C) equals the average abatement cost for firms.
D) is imposed by the government.
E) equals the marginal abatement cost for each profit- maximizing firm.
Figure 17- 7Refer to Figure 17- 7, which depicts the market for tradable pollution permits. The equilibrium price p*
A) is not a function of the abatement technology.
B) is always equal to the subsidy provided by the government.
C) equals the average abatement cost for firms.
D) is imposed by the government.
E) equals the marginal abatement cost for each profit- maximizing firm.
Question
Question
Question
Question
Question
Question
Question
Question
Question
The diagram below shows the marginal costs of pollution abatement for two firms, Firm 1 and Firm 2. 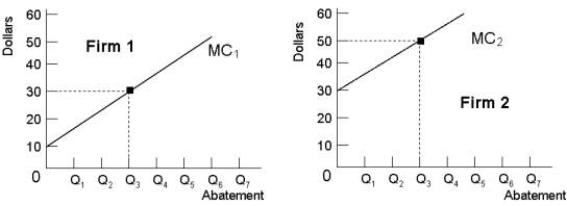 FIGURE 17- 5
Refer to Figure 17- 5. Suppose Firm 1 and Firm 2 are each abating Q3 units of pollution. If the government imposed an emissions tax of $40 per unit of emissions,
A) each firm would abate to Q3.
B) the level of pollution would be optimal.
C) each firm would abate to the same level.
D) Firm 2 would increase abatement beyond Q3 and Firm 1 would abate less than Q3.
E) Firm 1 would increase abatement beyond Q3 and Firm 2 would abate less than Q3.
FIGURE 17- 5Refer to Figure 17- 5. Suppose Firm 1 and Firm 2 are each abating Q3 units of pollution. If the government imposed an emissions tax of $40 per unit of emissions,
A) each firm would abate to Q3.
B) the level of pollution would be optimal.
C) each firm would abate to the same level.
D) Firm 2 would increase abatement beyond Q3 and Firm 1 would abate less than Q3.
E) Firm 1 would increase abatement beyond Q3 and Firm 2 would abate less than Q3.
Question
Question

Unlock Deck
Sign up to unlock the cards in this deck!
Unlock Deck
Unlock Deck
1/110
Play
Full screen (f)
Deck 17: The Economics of Environmental Protection
1
A system of tradable pollution permits is cost- effective because
A) firms with a marginal cost of abatement lower than the permit price will buy permits and abate less.
B) firms will choose their abatement so that their marginal cost of abatement equals the price of a permit, which is the same for all firms.
C) firms facing a low marginal cost of abatement will not abate at all.
D) firms facing a high marginal cost of abatement will not abate at all.
E) firms facing a marginal cost of abatement lower than the permit price will not abate at all.
B
2
The marginal benefit of reducing pollution in some industry may be expected to
A) fall as the amount of pollution abatement undertaken rises.
B) rise as the level of pollution gets closer to zero.
C) remain constant for all levels of pollution control.
D) be always greater than the marginal cost of pollution reduction.
E) exceed the marginal cost of pollution reduction for all positive levels of pollution.
A
3
The major elements of the Kyoto Protocol were 1) an aggregate emissions- reductions target of 5 percent below the 1990 level of emissions by 2012;
2) clear policy guidelines for emissions reductions for each signatory country;
3) acceptance of a system of internationally tradable pollution permits.
A) 1 and 3
B) 3 only
C) 2 only
D) 1 only
E) 1 and 2
2) clear policy guidelines for emissions reductions for each signatory country;
3) acceptance of a system of internationally tradable pollution permits.
A) 1 and 3
B) 3 only
C) 2 only
D) 1 only
E) 1 and 2
A
4
The table below shows the marginal benefit and marginal cost of pollution abatement.
-Refer to Table 17- 1. Suppose a public authority has the mandate to maximize social welfare by choosing the appropriate amount of pollution abatement. The optimal amount of pollution abatement is _ units and implies a amount of pollution remaining.
A) 8; 0
B) 5; negative
C) 120; negative
D) 5; positive
E) 70; positive
Unlock Deck
Unlock for access to all 110 flashcards in this deck.
Unlock Deck
k this deck
5
The optimal amount of pollution abatement is generally less than 100 percent. Complete (100 percent ) abatement would be optimal if
A) the marginal cost of abatement is always zero.
B) the marginal cost of abatement exceeds the marginal benefit of abatement at all levels of abatement.
C) the marginal benefit of abatement is zero.
D) the marginal cost of abatement is positive but less than the marginal benefit of abatement.
E) none of the above -- we cannot even imagine a situation in which complete abatement would be optimal.
Unlock Deck
Unlock for access to all 110 flashcards in this deck.
Unlock Deck
k this deck
6
Economists generally view pollution as
A) a positive externality.
B) a negative externality.
C) a negative economy.
D) a non- excludable good.
E) a scourge on the earth.
A) a positive externality.
B) a negative externality.
C) a negative economy.
D) a non- excludable good.
E) a scourge on the earth.
Unlock Deck
Unlock for access to all 110 flashcards in this deck.
Unlock Deck
k this deck
7
The diagram below shows the market for tradable pollution permits. Figure 17- 7
Refer to Figure 17- 7, which depicts the market for tradable pollution permits. If there is an increase in firms' marginal cost of pollution abatement,
A) the price of pollution permits will fall.
B) firms decide to abate more pollution.
C) firms will demand fewer pollution permits.
D) firms will demand more pollution permits.
E) firms require exactly Q* permits.
Figure 17- 7Refer to Figure 17- 7, which depicts the market for tradable pollution permits. If there is an increase in firms' marginal cost of pollution abatement,
A) the price of pollution permits will fall.
B) firms decide to abate more pollution.
C) firms will demand fewer pollution permits.
D) firms will demand more pollution permits.
E) firms require exactly Q* permits.
Unlock Deck
Unlock for access to all 110 flashcards in this deck.
Unlock Deck
k this deck
8
The diagram below shows the marginal cost of pollution abatement for two firms, Firm X and Firm Y. FIGURE 17- 4
Refer to Figure 17- 4. Ignore the horizontal line at t. Suppose the government requires each firm to reduce pollution by the same amount, QR. The result will be
A) fair and just because both firms are facing the same requirements.
B) economically inefficient because Firm Y is then abating pollution at a higher marginal cost than Firm X.
C) economically efficient because the maximum amount of pollution will be abated.
D) economically efficient because even though their marginal costs of abatement differ, the marginal cost for the last unit of abatement is equal.
E) economically inefficient because Firm X is not producing as much pollution as Firm Y and therefore should not be faced with the same requirements.
FIGURE 17- 4Refer to Figure 17- 4. Ignore the horizontal line at t. Suppose the government requires each firm to reduce pollution by the same amount, QR. The result will be
A) fair and just because both firms are facing the same requirements.
B) economically inefficient because Firm Y is then abating pollution at a higher marginal cost than Firm X.
C) economically efficient because the maximum amount of pollution will be abated.
D) economically efficient because even though their marginal costs of abatement differ, the marginal cost for the last unit of abatement is equal.
E) economically inefficient because Firm X is not producing as much pollution as Firm Y and therefore should not be faced with the same requirements.
Unlock Deck
Unlock for access to all 110 flashcards in this deck.
Unlock Deck
k this deck
9
In a competitive market for tradable pollution permits, the quantity of permits (for a given amount of pollution) is set by and the equilibrium price is determined by _.
A) government policy; market forces
B) government policy; government policy
C) market forces; government policy
D) market forces; market forces
E) government policy; the average cost of pollution abatement
A) government policy; market forces
B) government policy; government policy
C) market forces; government policy
D) market forces; market forces
E) government policy; the average cost of pollution abatement
Unlock Deck
Unlock for access to all 110 flashcards in this deck.
Unlock Deck
k this deck
10
A pollution- control policy that, in principle, can perfectly internalize pollution externalities is
A) an emissions tax.
B) fines for "over- polluters".
C) emission limits.
D) moral suasion.
E) none of the above can internalize the externality.
A) an emissions tax.
B) fines for "over- polluters".
C) emission limits.
D) moral suasion.
E) none of the above can internalize the externality.
Unlock Deck
Unlock for access to all 110 flashcards in this deck.
Unlock Deck
k this deck
11
If a per- unit tax on a firm's output makes the marginal private cost of production equal to the marginal social cost, we can then say that
A) the firm will make losses as its costs have increased.
B) the firm will cease to damage the environment.
C) the firm will be forced by the extra cost burden to leave the industry.
D) the firm will not make any changes to its output decision.
E) the externality has been fully internalized for that firm.
Unlock Deck
Unlock for access to all 110 flashcards in this deck.
Unlock Deck
k this deck
12
Consider a coal- fired electric- power plant that is operating under a system of tradable pollution permits. If its marginal cost of pollution abatement is $100 per unit and the price of the permit is
$150 per unit, this firm will
A) sell permits and abate more pollution.
B) not buy any permits, since that would push up its costs.
C) buy permits and abate more pollution.
D) buy permits and abate less pollution.
E) not abate at all.
$150 per unit, this firm will
A) sell permits and abate more pollution.
B) not buy any permits, since that would push up its costs.
C) buy permits and abate more pollution.
D) buy permits and abate less pollution.
E) not abate at all.
Unlock Deck
Unlock for access to all 110 flashcards in this deck.
Unlock Deck
k this deck
13
One of the most promising strategies for efficiently addressing the market failure that leads to environmental pollution is
A) to develop "smarter" direct pollution controls.
B) the introduction by government of tradable pollution permits.
C) forcing polluters to clean up polluted water, earth, and air.
D) the elimination of government involvement.
E) government legislation banning pollution.
A) to develop "smarter" direct pollution controls.
B) the introduction by government of tradable pollution permits.
C) forcing polluters to clean up polluted water, earth, and air.
D) the elimination of government involvement.
E) government legislation banning pollution.
Unlock Deck
Unlock for access to all 110 flashcards in this deck.
Unlock Deck
k this deck
14
The diagram below shows the marginal costs of pollution abatement for two firms, Firm 1 and Firm 2. FIGURE 17- 5
Refer to Figure 17- 5. If the government requires each firm to abate Q3 units of pollution, the social costs of this abatement
A) could be reduced further if Firm 2 increased abatement and Firm 1 reduced its abatement by the same amount.
B) could be reduced further if each firm was required to abate more.
C) could be reduced further if each firm was allowed to pollute more.
D) would be minimized.
E) could be reduced further if Firm 1 increased its abatement and Firm 2 reduced its abatement by the same amount.
FIGURE 17- 5Refer to Figure 17- 5. If the government requires each firm to abate Q3 units of pollution, the social costs of this abatement
A) could be reduced further if Firm 2 increased abatement and Firm 1 reduced its abatement by the same amount.
B) could be reduced further if each firm was required to abate more.
C) could be reduced further if each firm was allowed to pollute more.
D) would be minimized.
E) could be reduced further if Firm 1 increased its abatement and Firm 2 reduced its abatement by the same amount.
Unlock Deck
Unlock for access to all 110 flashcards in this deck.
Unlock Deck
k this deck
15
The diagram below shows the marginal cost of abatement for each of two firms, A and B. Each firm is initially abating Q0 units of pollution. FIGURE 17- 6
Refer to Figure 17- 6. Suppose that a system of tradable pollution permits is introduced into this market and the equilibrium permit price is p*. Firm B will buy permits from Firm A because
A) its total cost of abating less (areas 1+2+3) exceeds the cost of buying the permits (areas 2+3).
B) Firm B can buy the permits at a lower price than Firm A.
C) its total savings from abating less (areas 1+2+3) exceed the cost of buying the permits (areas 2+3).
D) Firm B has lower costs of pollution abatement than Firm A.
E) its total savings from abating less (areas 1+2+3) exceed the total costs of Firm A abating more (area 6).
FIGURE 17- 6Refer to Figure 17- 6. Suppose that a system of tradable pollution permits is introduced into this market and the equilibrium permit price is p*. Firm B will buy permits from Firm A because
A) its total cost of abating less (areas 1+2+3) exceeds the cost of buying the permits (areas 2+3).
B) Firm B can buy the permits at a lower price than Firm A.
C) its total savings from abating less (areas 1+2+3) exceed the cost of buying the permits (areas 2+3).
D) Firm B has lower costs of pollution abatement than Firm A.
E) its total savings from abating less (areas 1+2+3) exceed the total costs of Firm A abating more (area 6).
Unlock Deck
Unlock for access to all 110 flashcards in this deck.
Unlock Deck
k this deck
16
When a farmer in Manitoba produces fertilizer run- off that pollutes the local water system,
A) the amount of farm output produced will be less than the efficient level.
B) the farm should stop producing agricultural products altogether.
C) the amount of farm output will not be profitable.
D) the amount of farm output produced will not be cost- effective.
E) the amount of farm output produced will exceed the efficient level.
Unlock Deck
Unlock for access to all 110 flashcards in this deck.
Unlock Deck
k this deck
17
The diagram below shows the marginal cost of abatement for each of two firms, A and B. Each firm is initially abating Q0 units of pollution. FIGURE 17- 6
Refer to Figure 17- 6. Suppose that a system of tradable pollution permits is introduced into this market and the equilibrium permit price is p×. Firm A will sell permits to Firm B because
A) Firm B has lower costs of pollution abatement than Firm A.
B) the revenue Firm A earns from selling permits (areas 5 + 6) is greater than the cost it incurs from abating more pollution (area 6).
C) Firm A can buy the permits at a lower price than Firm B.
D) Firm A's total cost of abating more pollution (area 6) is less than the revenue it earns from selling the permits (areas 4 + 5).
E) Firm A's total cost of abating more pollution (areas 5 + 6) is less than the revenue it earns from selling the permits (areas 4 + 5 + 6).
FIGURE 17- 6Refer to Figure 17- 6. Suppose that a system of tradable pollution permits is introduced into this market and the equilibrium permit price is p×. Firm A will sell permits to Firm B because
A) Firm B has lower costs of pollution abatement than Firm A.
B) the revenue Firm A earns from selling permits (areas 5 + 6) is greater than the cost it incurs from abating more pollution (area 6).
C) Firm A can buy the permits at a lower price than Firm B.
D) Firm A's total cost of abating more pollution (area 6) is less than the revenue it earns from selling the permits (areas 4 + 5).
E) Firm A's total cost of abating more pollution (areas 5 + 6) is less than the revenue it earns from selling the permits (areas 4 + 5 + 6).
Unlock Deck
Unlock for access to all 110 flashcards in this deck.
Unlock Deck
k this deck
18
Suppose a local meat packing company dumps waste into a river, causing a firm located downstream that uses the water to incur costs to restore the water quality. An efficient solution to this problem might involve:
1) forcing the meat- packing company to relocate near a different river;
2) forcing the meat- packing company to buy the downstream firm;
3) permitting the downstream firm to charge the meat- packing company.
A) 1 only
B) 2 only
C) 3 only
D) 2 or 3 only
E) 1 or 3 only
1) forcing the meat- packing company to relocate near a different river;
2) forcing the meat- packing company to buy the downstream firm;
3) permitting the downstream firm to charge the meat- packing company.
A) 1 only
B) 2 only
C) 3 only
D) 2 or 3 only
E) 1 or 3 only
Unlock Deck
Unlock for access to all 110 flashcards in this deck.
Unlock Deck
k this deck
19
If a negative externality is associated with the production of some good, then
A) marginal social cost minus marginal private cost is positive.
B) too little of the good is being produced by the firm.
C) the marginal social cost is less than the marginal social benefit.
D) the price is equal to firms' marginal private cost.
E) marginal social cost minus marginal private cost is negative.
Unlock Deck
Unlock for access to all 110 flashcards in this deck.
Unlock Deck
k this deck
20
The marginal benefit of reducing pollution and the marginal cost of reducing pollution are given by the following equations: MB = - 2U2 + 18, and MC = 2U2 + 2, where U is the number of units of pollution abatement. What is the level of pollution abatement after which there is no benefit whatsoever in reducing pollution?
A) 0
B) 1
C) 2
D) 3
E) 4
A) 0
B) 1
C) 2
D) 3
E) 4
Unlock Deck
Unlock for access to all 110 flashcards in this deck.
Unlock Deck
k this deck
21
A paper mill discharges chemicals into a river which washes the shores of a downstream resort area. The private cost, social cost, and marginal benefit associated with the production of paper are given by the following equations: PMC = 5 + Q, SMC = 10 + 2Q, and MB = 35 - 0.5Q. The marginal external cost is throughout the output range.
A) increasing
B) zero
C) decreasing
D) constant
E) negative
A) increasing
B) zero
C) decreasing
D) constant
E) negative
Unlock Deck
Unlock for access to all 110 flashcards in this deck.
Unlock Deck
k this deck
22
Federal regulation aimed at reducing greenhouse- gas emissions by setting some maximum level of emissions from each firm
A) will usually not produce the desired reduction in emissions at the lowest possible cost.
B) will achieve the largest but not the most efficient reduction in emissions.
C) will achieve the least reduction in emissions but be the most efficient.
D) is the best approach because the costs of reducing emissions are different for each firm.
E) is the best approach because firms will quickly reduce air pollution.
Unlock Deck
Unlock for access to all 110 flashcards in this deck.
Unlock Deck
k this deck
23
The diagram below show the private and social marginal costs and the social marginal benefits of producing disposable diapers. FIGURE 17- 2
Refer to Figure 17- 2. The allocatively efficient level of production and use of disposable diapers is
A) Q0, because that is where MCS equals MBS.
B) Q0, because that is where MCS exceeds MCP.
C) Q2, because that is where the externality is internalized.
D) Q1, because that is where MCP equals MBS.
E) Q1, because that is where MCS equals MBS.
FIGURE 17- 2Refer to Figure 17- 2. The allocatively efficient level of production and use of disposable diapers is
A) Q0, because that is where MCS equals MBS.
B) Q0, because that is where MCS exceeds MCP.
C) Q2, because that is where the externality is internalized.
D) Q1, because that is where MCP equals MBS.
E) Q1, because that is where MCS equals MBS.
Unlock Deck
Unlock for access to all 110 flashcards in this deck.
Unlock Deck
k this deck
24
The socially optimal level of output is the quantity where all marginal costs of production, private plus external, equal the
A) average benefit to society.
B) total benefit to society.
C) marginal cost of production.
D) marginal benefit to society.
E) marginal benefit to the firm.
A) average benefit to society.
B) total benefit to society.
C) marginal cost of production.
D) marginal benefit to society.
E) marginal benefit to the firm.
Unlock Deck
Unlock for access to all 110 flashcards in this deck.
Unlock Deck
k this deck
25
Consider the following equation:
Where GHG = world annual emissions of greenhouse gases Energy = world annual amount of energy consumed GDP = world's annual gross domestic product
Suppose GHG emissions increased by 10 percent between 2005 and 2010, a period when GDP increased by 5 percent and Energy/GDP was constant. We can conclude that GHG/Energy over the same period
A) increased by 5 percent.
B) was unchanged.
C) decreased by 10 percent.
D) increased by 10 percent.
E) decreased by 5 percent.
Unlock Deck
Unlock for access to all 110 flashcards in this deck.
Unlock Deck
k this deck
26
When an external cost associated with the production of some good has been internalized, it means that
A) the consumer must bear the net social benefits imposed by the producer.
B) the producer must bear the external costs imposed by production.
C) the private cost of production is borne by the producer.
D) the firm is ignoring social costs.
E) the opportunity cost of production is passed on to the consumer.
Unlock Deck
Unlock for access to all 110 flashcards in this deck.
Unlock Deck
k this deck
27
The diagram below shows the marginal cost of pollution abatement for two firms, Firm X and Firm Y. FIGURE 17- 4
Refer to Figure 17- 4. Firms X and Y have an emissions tax of $t imposed on each unit of pollution they produce. If Firm X chooses to abate QX units of pollution, the total cost of its abatement is
A) tax amount t multiplied by the level of pollution abatement, QX.
B) area beneath the marginal cost of pollution abatement curve.
C) area below the horizontal line at t and above the MC of pollution abatement curve.
D) area beneath the marginal cost of pollution abatement curve up to QX.
E) tax amount t multiplied by the maximum possible level of pollution abatement.
FIGURE 17- 4Refer to Figure 17- 4. Firms X and Y have an emissions tax of $t imposed on each unit of pollution they produce. If Firm X chooses to abate QX units of pollution, the total cost of its abatement is
A) tax amount t multiplied by the level of pollution abatement, QX.
B) area beneath the marginal cost of pollution abatement curve.
C) area below the horizontal line at t and above the MC of pollution abatement curve.
D) area beneath the marginal cost of pollution abatement curve up to QX.
E) tax amount t multiplied by the maximum possible level of pollution abatement.
Unlock Deck
Unlock for access to all 110 flashcards in this deck.
Unlock Deck
k this deck
28
When designing a policy to reduce polluting emissions, policymakers are unlikely to know with certainty what the marginal cost of abatement is for each firm. If an emissions tax ($t per unit of emissions) is imposed, then policymakers
A) know the per- unit cost imposed on firms but do not know what the reduction in emissions will be.
B) are uncertain about both the amount of emission reduction and the cost.
C) know what the reduction in emissions will be but do not know at what cost.
D) know with certainty what their tax revenues will be from the emissions tax.
E) know with certainty what the reduction in emissions will be and at what cost.
Unlock Deck
Unlock for access to all 110 flashcards in this deck.
Unlock Deck
k this deck
29
The diagram below show the private and social marginal costs and the social marginal benefits of producing disposable diapers. FIGURE 17- 2
Refer to Figure 17- 2. The net social benefit derived from the production and use of disposable diapers is
A) zero at Q0, because that is where MCS equals MBS.
B) at a maximum at Q1, because that is where MCS equals MBS.
C) at a minimum at Q0, because MCS exceeds MCP.
D) zero at Q2, because that is where the externality is internalized.
E) at a maximum at Q0, because that is where MCS equals MBS.
FIGURE 17- 2Refer to Figure 17- 2. The net social benefit derived from the production and use of disposable diapers is
A) zero at Q0, because that is where MCS equals MBS.
B) at a maximum at Q1, because that is where MCS equals MBS.
C) at a minimum at Q0, because MCS exceeds MCP.
D) zero at Q2, because that is where the externality is internalized.
E) at a maximum at Q0, because that is where MCS equals MBS.
Unlock Deck
Unlock for access to all 110 flashcards in this deck.
Unlock Deck
k this deck
30
The figure below shows the demand and supply curves for pollution abatement. FIGURE 17- 3
Refer to Figure 17- 3. The socially optimal amount of pollution is
A) Qt - Q*.
B) Q* + Qt.
C) 0.
D) Q*.
E) Qt.
FIGURE 17- 3Refer to Figure 17- 3. The socially optimal amount of pollution is
A) Qt - Q*.
B) Q* + Qt.
C) 0.
D) Q*.
E) Qt.
Unlock Deck
Unlock for access to all 110 flashcards in this deck.
Unlock Deck
k this deck
31
The main advantage of using market- based schemes for reducing pollution is that they
A) minimize the difference between total cost and total benefit.
B) maximize the difference between marginal cost and marginal benefit.
C) lead to a more efficient use of scarce resources.
D) improve the moral fibre of producers and consumers.
E) lead to greater fairness in the distribution of resources.
Unlock Deck
Unlock for access to all 110 flashcards in this deck.
Unlock Deck
k this deck
32
The diagram below shows the marginal cost of abatement for each of two firms, A and B. Each firm is initially abating Q0 units of pollution. FIGURE 17- 6
Refer to Figure 17- 6. Suppose that a system of tradable pollution permits is introduced into this market and the equilibrium permit price is p*. The effect will be that
A) Firm B will abate less pollution-the amount Q2, and Firm A will abate more pollution-the amount Q1.
B) Firms A and B will each abate Q0 units of pollution.
C) Firms A and B will each abate Q2 units of pollution.
D) there will be no change in the quantity of abatement by each firm.
E) Firm A will abate less pollution-the amount Q2, and Firm B will abate more pollution-the amount Q1.
FIGURE 17- 6Refer to Figure 17- 6. Suppose that a system of tradable pollution permits is introduced into this market and the equilibrium permit price is p*. The effect will be that
A) Firm B will abate less pollution-the amount Q2, and Firm A will abate more pollution-the amount Q1.
B) Firms A and B will each abate Q0 units of pollution.
C) Firms A and B will each abate Q2 units of pollution.
D) there will be no change in the quantity of abatement by each firm.
E) Firm A will abate less pollution-the amount Q2, and Firm B will abate more pollution-the amount Q1.
Unlock Deck
Unlock for access to all 110 flashcards in this deck.
Unlock Deck
k this deck
33
The use of emissions taxes as a method of reducing pollution
1) is more efficient than direct controls;
2) allows firms to select the most efficient abatement techniques;
3) forces firms to internalize the pollution externality.
A) 1 only
B) 1 and 2 only
C) 1 and 3 only
D) 2 and 3 only
E) 1, 2, and 3
1) is more efficient than direct controls;
2) allows firms to select the most efficient abatement techniques;
3) forces firms to internalize the pollution externality.
A) 1 only
B) 1 and 2 only
C) 1 and 3 only
D) 2 and 3 only
E) 1, 2, and 3
Unlock Deck
Unlock for access to all 110 flashcards in this deck.
Unlock Deck
k this deck
34
If the government imposes a tax for each unit of pollution that a firm produces, the firm will
A) ignore the tax and continue to produce the same amount of output.
B) reduce emissions until the marginal cost of any further reduction in pollution is equal to the price of the firm's product.
C) increase output such that the additional revenue can offset this additional tax payment.
D) stop producing altogether.
E) reduce emissions until the marginal cost of any further reduction in pollution is equal to or greater than the tax.
Unlock Deck
Unlock for access to all 110 flashcards in this deck.
Unlock Deck
k this deck
35
The optimal amount of pollution abatement is such that
A) there is no remaining pollution.
B) governments have successful anti- pollution legislation in effect.
C) the marginal private cost of reducing pollution is just equal to the profit of the polluting firms.
D) the marginal social cost of reducing pollution is just equal to the marginal social benefits from doing so.
E) none of the above; there is no optimal amount of pollution abatement .
Unlock Deck
Unlock for access to all 110 flashcards in this deck.
Unlock Deck
k this deck
36
A policy that puts a price on GHG emissions will help to reduce emissions because
A) energy intensity of GDP will increase.
B) it provides incentives for firms and consumers to switch to cleaner energy sources.
C) it will shift firms' marginal cost of abatement curves upward.
D) it will shift firms' marginal cost of abatement curves downward.
E) world energy intensity will increase.
Unlock Deck
Unlock for access to all 110 flashcards in this deck.
Unlock Deck
k this deck
37
Consider the following equation:
Where GHG = world annual emissions of greenhouse gases Energy = world annual amount of energy consumed GDP = world's annual gross domestic product
The ratio GHG/Energy describes
A) greenhouse gas emissions expressed as a percentage of carbon- based energy consumed.
B) the energy efficiency of greenhouse gas emissions.
C) the units of greenhouse gases emitted per unit of energy consumed.
D) the units of energy consumed per unit of greenhouse gases emitted.
E) the total units of greenhouse gases emitted annually.
Unlock Deck
Unlock for access to all 110 flashcards in this deck.
Unlock Deck
k this deck
38
Global GHG emission reductions are unlikely to be achieved through GDP reductions because
A) the rise in GDP in rich countries will be greater than the reductions in GDP in poor countries.
B) the growth rate of world GDP is negative.
C) the rise in GDP in poor countries will be greater than the reductions in GDP in rich countries.
D) GDP cannot be reduced.
E) ongoing population growth and per capita income growth are likely to drive GDP upward.
Unlock Deck
Unlock for access to all 110 flashcards in this deck.
Unlock Deck
k this deck
39
The figure below shows the marginal benefit to consumers, MB, the marginal cost to private firms, MCp, and the marginal cost to society, MCs, at each level of output of some good. FIGURE 17- 1
Refer to Figure 17- 1. The price that leads consumers to demand the socially optimal quantity of output is
A) P3.
B) P2.
C) P1.
D) zero.
E) not possible to know from the information given.
FIGURE 17- 1Refer to Figure 17- 1. The price that leads consumers to demand the socially optimal quantity of output is
A) P3.
B) P2.
C) P1.
D) zero.
E) not possible to know from the information given.
Unlock Deck
Unlock for access to all 110 flashcards in this deck.
Unlock Deck
k this deck
40
Direct pollution controls can be criticized from an economic viewpoint as
A) still allowing firms to pollute when a policy of "zero tolerance" is more appropriate.
B) being easy to circumvent.
C) not being efficient in allocating the costs of pollution reduction among various firms and plants.
D) being inequitable in their application.
E) being ultimately unsuccessful in reducing pollution.
Unlock Deck
Unlock for access to all 110 flashcards in this deck.
Unlock Deck
k this deck
41
A paper mill discharges chemicals into a river which washes the shores of a downstream resort area. The private cost, social cost, and marginal benefit associated with the production of paper are given by the following equations: PMC = 5 + Q, SMC = Z + 2Q, and MB = 35 - 0.5Q. What is the level of Z for which the marginal external cost at the competitive free- market equilibrium is zero?
A) - 15
B) - 10
C) 0
D) 15
E) 25
A) - 15
B) - 10
C) 0
D) 15
E) 25
Unlock Deck
Unlock for access to all 110 flashcards in this deck.
Unlock Deck
k this deck
42
The diagram below shows the marginal cost of pollution abatement for two firms, Firm X and Firm Y. FIGURE 17- 4
Refer to Figure 17- 4. Firms X and Y have an emissions tax of $t imposed on each unit of pollution they produce. Firm X will choose to abate pollution of units and Firm Y will choose to abate pollution of units.
A) QR; QY
B) QX; QR
C) QR; QR
D) 0; 0
E) QX; QY
FIGURE 17- 4Refer to Figure 17- 4. Firms X and Y have an emissions tax of $t imposed on each unit of pollution they produce. Firm X will choose to abate pollution of units and Firm Y will choose to abate pollution of units.
A) QR; QY
B) QX; QR
C) QR; QR
D) 0; 0
E) QX; QY
Unlock Deck
Unlock for access to all 110 flashcards in this deck.
Unlock Deck
k this deck
43
The diagram below shows the market for tradable pollution permits. Figure 17- 7
Refer to Figure 17- 7, which depicts the market for tradable pollution permits. Improvements in firms' abatement technology will be expected to
A) shift the demand curve to the left.
B) shift the supply curve to the right.
C) shift the supply curve to the left.
D) shift the demand curve to the right.
E) not have any impact on the equilibrium.
Figure 17- 7Refer to Figure 17- 7, which depicts the market for tradable pollution permits. Improvements in firms' abatement technology will be expected to
A) shift the demand curve to the left.
B) shift the supply curve to the right.
C) shift the supply curve to the left.
D) shift the demand curve to the right.
E) not have any impact on the equilibrium.
Unlock Deck
Unlock for access to all 110 flashcards in this deck.
Unlock Deck
k this deck
44
Consider the following equation:
Where GHG = world annual emissions of greenhouse gases Energy = world annual amount of energy consumed GDP = world's annual gross domestic product
Suppose GHG emissions decreased by 6 percent between 2010 and 2012, a period when GDP increased by 4 percent and Energy/GDP decreased by 2 percent. We can conclude that
A) decreased by 6 percent.
B) remain unchanged.
C) decreased by 4 percent.
D) decreased by 8 percent.
E) increased by 4 percent.
Unlock Deck
Unlock for access to all 110 flashcards in this deck.
Unlock Deck
k this deck
45
The table below shows the marginal benefit and marginal cost of pollution abatement.
-Refer to Table 17- 1. Suppose a public authority has the mandate to maximize social welfare by choosing the appropriate amount of pollution abatement. The total net benefit from the optimal amount of pollution abatement is
A) 0.
B) 120.
C) 155.
D) 275.
E) 330.
-Refer to Table 17- 1. Suppose a public authority has the mandate to maximize social welfare by choosing the appropriate amount of pollution abatement. The total net benefit from the optimal amount of pollution abatement is
A) 0.
B) 120.
C) 155.
D) 275.
E) 330.
Unlock Deck
Unlock for access to all 110 flashcards in this deck.
Unlock Deck
k this deck
46
If emissions permits are traded freely between profit- maximizing firms in the private market,
A) the amount of pollution abatement will be identical to that which the firms would have willingly undertaken on their own.
B) each firm will face identical costs of pollution abatement.
C) there will be more than the optimal amount of pollution.
D) all firms will use identical pollution abatement technologies.
E) marginal abatement costs will be equalized across firms.
Unlock Deck
Unlock for access to all 110 flashcards in this deck.
Unlock Deck
k this deck
47
The social marginal cost of the production of snowmobiles
A) does not include the carbon emissions from snowmobiles.
B) does not include the increased risk of accidents caused by the operation of snowmobiles.
C) is greater than the sum of the private marginal cost and external cost.
D) is less than the marginal external cost of production.
E) includes the noise pollution imposed on those living near snowmobile trails.
Unlock Deck
Unlock for access to all 110 flashcards in this deck.
Unlock Deck
k this deck
48
Between 1990 and 2004, Canada's greenhouse gas emissions by percent.
A) decreased; 1
B) increased; more than 25
C) increased; 6
D) increased; 15
E) decreased; 6
A) decreased; 1
B) increased; more than 25
C) increased; 6
D) increased; 15
E) decreased; 6
Unlock Deck
Unlock for access to all 110 flashcards in this deck.
Unlock Deck
k this deck
49
Automobile emissions standards are an example of
A) tradable emissions standards.
B) a market- based environmental policy.
C) emissions taxes.
D) market power.
E) direct pollution controls.
A) tradable emissions standards.
B) a market- based environmental policy.
C) emissions taxes.
D) market power.
E) direct pollution controls.
Unlock Deck
Unlock for access to all 110 flashcards in this deck.
Unlock Deck
k this deck
50
Consider a coal- fired electric- power plant that is operating under a cap and trade system. If its marginal cost of pollution abatement is $5 per unit and the price of the permit is $3 per unit, this firm will
A) not buy any permits, since that would push up its costs.
B) buy permits and abate less pollution.
C) buy permits and abate more pollution.
D) sell permits and abate more pollution.
E) not abate at all.
A) not buy any permits, since that would push up its costs.
B) buy permits and abate less pollution.
C) buy permits and abate more pollution.
D) sell permits and abate more pollution.
E) not abate at all.
Unlock Deck
Unlock for access to all 110 flashcards in this deck.
Unlock Deck
k this deck
51
A downward- sloping marginal benefit curve for pollution abatement means that
A) it is impossible to know the benefits from additional increments of pollution abatement.
B) the marginal cost of pollution reduction will exceed the marginal benefit.
C) the costs of pollution decrease as further amounts are abated.
D) there are decreasing incremental benefits to be realized from additional increments of pollution abatement.
E) society views additional increments of pollution abatement as unnecessary.
Unlock Deck
Unlock for access to all 110 flashcards in this deck.
Unlock Deck
k this deck
52
The figure below shows the marginal benefit to consumers, MB, the marginal cost to private firms, MCp, and the marginal cost to society, MCs, at each level of output of some good. FIGURE 17- 1
Refer to Figure 17- 1. The socially optimal level of output is
A) Q1.
B) Q3.
C) Q2.
D) zero.
E) none of the above; there is no optimal output level.
FIGURE 17- 1Refer to Figure 17- 1. The socially optimal level of output is
A) Q1.
B) Q3.
C) Q2.
D) zero.
E) none of the above; there is no optimal output level.
Unlock Deck
Unlock for access to all 110 flashcards in this deck.
Unlock Deck
k this deck
53
Consider two firms, A and B, that must engage in pollution abatement. If Firm A has a lower marginal cost of pollution abatement than Firm B, then
A) regardless of costs, it is equitable for both firms to face the same direct controls on their pollution.
B) reallocating some of Firm B's abatement activity to Firm A can keep total abatement constant but reduce the total cost of abatement.
C) reallocating all abatement activity to Firm A will reduce pollution and reduce the total cost of abatement.
D) reallocating some of Firm A's abatement activity to Firm B will keep total abatement constant but will reduce the total cost of abatement.
E) Firm B should lower its costs.
Unlock Deck
Unlock for access to all 110 flashcards in this deck.
Unlock Deck
k this deck
54
The diagram below shows the marginal costs of pollution abatement for two firms, Firm 1 and Firm 2. FIGURE 17- 5
Refer to Figure 17- 5. Suppose Firm 1 and Firm 2 are each abating Q3 units of pollution. If the government imposes an emissions tax of $20 per unit of emissions,
A) Firm 1 will increase abatement beyond Q3 and Firm 2 will abate less than Q3.
B) Firm 1 and Firm 2 will each increase abatement beyond Q3.
C) the level of pollution abatement will be optimal.
D) Firm 1 will abate less than Q3, and Firm 2 will not abate any pollution at all.
E) neither firm will abate any pollution.
FIGURE 17- 5Refer to Figure 17- 5. Suppose Firm 1 and Firm 2 are each abating Q3 units of pollution. If the government imposes an emissions tax of $20 per unit of emissions,
A) Firm 1 will increase abatement beyond Q3 and Firm 2 will abate less than Q3.
B) Firm 1 and Firm 2 will each increase abatement beyond Q3.
C) the level of pollution abatement will be optimal.
D) Firm 1 will abate less than Q3, and Firm 2 will not abate any pollution at all.
E) neither firm will abate any pollution.
Unlock Deck
Unlock for access to all 110 flashcards in this deck.
Unlock Deck
k this deck
55
All of the following are examples of direct pollution controls EXCEPT
A) a monetary fine in some communities for littering.
B) legislation requiring scrubbers on coal- fired power stations.
C) a ban on wood stoves in some communities.
D) auto emissions standards.
E) legislation imposing per- unit taxes on harmful emissions from a pulp and paper plant.
A) a monetary fine in some communities for littering.
B) legislation requiring scrubbers on coal- fired power stations.
C) a ban on wood stoves in some communities.
D) auto emissions standards.
E) legislation imposing per- unit taxes on harmful emissions from a pulp and paper plant.
Unlock Deck
Unlock for access to all 110 flashcards in this deck.
Unlock Deck
k this deck
56
A paper mill discharges chemicals into a river which washes the shores of a downstream resort area. The private cost, social cost, and marginal benefit associated with the production of paper are given by the following equations: PMC = 5 + Q, SMC = 10 + 2Q, and MB = 35 - 0.5Q. The allocatively efficient level of output is units.
A) 0
B) 10
C) 15
D) 25
E) 30
A) 0
B) 10
C) 15
D) 25
E) 30
Unlock Deck
Unlock for access to all 110 flashcards in this deck.
Unlock Deck
k this deck
57
In 2006, Professor Nicolas Stern of the United Kingdom stated "Climate change is the greatest market failure the world has ever seen." Which of the following statements describes the biggest challenge to efforts to begin correcting this market failure?
A) Policy design must be coordinated among all major governments of the world, as the problem is truly a global one.
B) Each government around the world must choose its own level of emissions.
C) Climate change is too large a problem to be compared to a market failure.
D) We do not have precise estimates of the costs of reducing greenhouse gas emissions.
E) We do not have precise estimates of the costs of increased levels of CO2e in the atmosphere.
Unlock Deck
Unlock for access to all 110 flashcards in this deck.
Unlock Deck
k this deck
58
The diagram below shows the marginal cost of pollution abatement for two firms, Firm X and Firm Y. FIGURE 17- 4
Refer to Figure 17- 4. Ignore the horizontal line at t. If the government wanted to impose an emissions tax, efficiency requires that it
A) impose the same tax on both firms and also fix the amount of pollution abatement at QR for each firm.
B) tax only the low- cost firm (Firm X) and fix the amount of pollution abatement for the high- cost firm (Firm Y).
C) choose a different tax rate for each firm so that each firm abates QR units of pollution.
D) levy a tax at the same rate to both firms.
E) tax only the high- cost firm (Firm Y) and fix the amount of pollution abatement for the low- cost firm (Firm X).
FIGURE 17- 4Refer to Figure 17- 4. Ignore the horizontal line at t. If the government wanted to impose an emissions tax, efficiency requires that it
A) impose the same tax on both firms and also fix the amount of pollution abatement at QR for each firm.
B) tax only the low- cost firm (Firm X) and fix the amount of pollution abatement for the high- cost firm (Firm Y).
C) choose a different tax rate for each firm so that each firm abates QR units of pollution.
D) levy a tax at the same rate to both firms.
E) tax only the high- cost firm (Firm Y) and fix the amount of pollution abatement for the low- cost firm (Firm X).
Unlock Deck
Unlock for access to all 110 flashcards in this deck.
Unlock Deck
k this deck
59
Suppose the government imposes an emissions tax of $t on each unit of pollution produced by a firm. Under which of the following circumstances would the tax rate be set too high to achieve allocative efficiency?
A) the firm could not afford to pay the tax
B) the tax rate is less than the marginal external cost of the pollution
C) the tax rate causes the firm's ATC curve to shift up
D) the tax rate is greater than the marginal external cost of the pollution
E) the tax rate is greater than the firm's private marginal cost of production
Unlock Deck
Unlock for access to all 110 flashcards in this deck.
Unlock Deck
k this deck
60
When designing a policy to reduce polluting emissions, policymakers are unlikely to know with certainty what the marginal cost of abatement is for each firm. If policymakers set an emissions cap of X units, and issue tradable permits for this amount, then they
A) know the per- unit cost imposed on firms but do not know what the reduction in emissions will be.
B) are uncertain about both the amount of emission reduction and the cost.
C) know with certainty what the equilibrium permit price will be.
D) know with certainty what the reduction in emissions will be and at what cost.
E) know what the reduction in emissions will be but do not know at what cost.
Unlock Deck
Unlock for access to all 110 flashcards in this deck.
Unlock Deck
k this deck
61
A paper mill discharges chemicals into a river which washes the shores of a downstream resort area. The private cost, social cost, and marginal benefit associated with the production of paper are given by the following equations: PMC = 5 + Q, SMC = 10 + 2Q, and MB = 35 - 0.5Q. The marginal external cost at the competitive free- market equilibrium is
A) 25.
B) 20
C) 15.
D) 10.
E) 5.
A) 25.
B) 20
C) 15.
D) 10.
E) 5.
Unlock Deck
Unlock for access to all 110 flashcards in this deck.
Unlock Deck
k this deck
62
The figure below shows the marginal benefit to consumers, MB, the marginal cost to private firms, MCp, and the marginal cost to society, MCs, at each level of output of some good. FIGURE 17- 1
Refer to Figure 17- 1. The price that would occur in a competitive market in the absence of government intervention is
A) P3.
B) P2.
C) P4.
D) P1.
E) not possible to know from the information given.
FIGURE 17- 1Refer to Figure 17- 1. The price that would occur in a competitive market in the absence of government intervention is
A) P3.
B) P2.
C) P4.
D) P1.
E) not possible to know from the information given.
Unlock Deck
Unlock for access to all 110 flashcards in this deck.
Unlock Deck
k this deck
63
Private and competitive markets could produce efficient levels of pollution if
A) the appropriate tax per unit of pollution were administered and enforced.
B) the producers were made aware of the pollution externality.
C) the worst polluting firms were closed down.
D) left alone by government regulators.
E) regulated by government through direct controls.
A) the appropriate tax per unit of pollution were administered and enforced.
B) the producers were made aware of the pollution externality.
C) the worst polluting firms were closed down.
D) left alone by government regulators.
E) regulated by government through direct controls.
Unlock Deck
Unlock for access to all 110 flashcards in this deck.
Unlock Deck
k this deck
64
A potential disadvantage of emissions taxes versus direct pollution controls is that
A) emissions taxes are more expensive to administer.
B) pollution becomes a part of each firm's profit- maximizing calculations, encouraging firms to find more efficient ways to pollute.
C) the authorities might have a better idea of the socially optimal level of pollution than of the optimal tax rate that would achieve it.
D) emissions taxes do not specify how the pollution is to be controlled, which leads to economic inefficiency in the implementation of the pollution restraint.
E) emissions taxes introduce distortions to the price system, whereas direct controls do not.
Unlock Deck
Unlock for access to all 110 flashcards in this deck.
Unlock Deck
k this deck
65
The figure below shows the marginal benefit to consumers, MB, the marginal cost to private firms, MCp, and the marginal cost to society, MCs, at each level of output of some good. FIGURE 17- 1
Refer to Figure 17- 1. The equilibrium output that would occur in a competitive market in the absence of government intervention is
A) zero.
B) Q3.
C) Q1.
D) Q2.
E) none of the above; there is no equilibrium output level.
FIGURE 17- 1Refer to Figure 17- 1. The equilibrium output that would occur in a competitive market in the absence of government intervention is
A) zero.
B) Q3.
C) Q1.
D) Q2.
E) none of the above; there is no equilibrium output level.
Unlock Deck
Unlock for access to all 110 flashcards in this deck.
Unlock Deck
k this deck
66
Consider the following equation:
Where GHG = world annual emissions of greenhouse gases Energy = world annual amount of energy consumed GDP = world's annual gross domestic product
The ratio Energy/GDP describes
A) the amount of energy per unit of GDP required to stabilize greenhouse gas emissions.
B) the energy efficiency of greenhouse gas emissions.
C) the number of units of carbon- based energy produced as a fraction of GDP.
D) the number of units of energy used per dollar of GDP produced.
E) the amount of energy used per unit of output in the energy- intensive sector of the economy.
Unlock Deck
Unlock for access to all 110 flashcards in this deck.
Unlock Deck
k this deck
67
In general, the economist's view on allocating resources to reduce pollution is that
A) government policies to reduce pollution have zero opportunity cost.
B) the reduction of pollution should proceed up to the point where the marginal cost of pollution reduction equals the marginal benefit to society.
C) all forms of water and air pollution should be eliminated.
D) the extent of pollution reduction should be based only on a comparison of total costs and total benefits to the environment.
E) it is not allocatively efficient to reduce pollution.
Unlock Deck
Unlock for access to all 110 flashcards in this deck.
Unlock Deck
k this deck
68
A paper mill discharges chemicals into a river which washes the shores of a downstream resort area. The private cost, social cost, and marginal benefit associated with the production of paper are given by the following equations: PMC = 5 + Q, SMC = 10 + 2Q, and MB = 35 - 0.5Q. The marginal external cost at the allocatively efficient level of output is
A) 0.
B) 5.
C) 10.
D) 15.
E) 20.
A) 0.
B) 5.
C) 10.
D) 15.
E) 20.
Unlock Deck
Unlock for access to all 110 flashcards in this deck.
Unlock Deck
k this deck
69
The diagram below shows the market for tradable pollution permits. Figure 17- 7
Refer to Figure 17- 7, which depicts the market for tradable pollution permits. The equilibrium price p*
A) is not a function of the abatement technology.
B) is always equal to the subsidy provided by the government.
C) equals the average abatement cost for firms.
D) is imposed by the government.
E) equals the marginal abatement cost for each profit- maximizing firm.
Figure 17- 7Refer to Figure 17- 7, which depicts the market for tradable pollution permits. The equilibrium price p*
A) is not a function of the abatement technology.
B) is always equal to the subsidy provided by the government.
C) equals the average abatement cost for firms.
D) is imposed by the government.
E) equals the marginal abatement cost for each profit- maximizing firm.
Unlock Deck
Unlock for access to all 110 flashcards in this deck.
Unlock Deck
k this deck
70
Two firms, A and B, are legally required to reduce their toxic emissions. If Firm A's marginal cost of abatement is $5 and Firm B's marginal cost of abatement is $5,
A) the socially optimal joint level of abatement is not being achieved.
B) their joint total cost of abatement is at a minimum.
C) Firm B should abate more and Firm A should abate less.
D) their joint total cost of abatement is at a maximum.
E) Firm A should abate more and Firm B should abate less.
A) the socially optimal joint level of abatement is not being achieved.
B) their joint total cost of abatement is at a minimum.
C) Firm B should abate more and Firm A should abate less.
D) their joint total cost of abatement is at a maximum.
E) Firm A should abate more and Firm B should abate less.
Unlock Deck
Unlock for access to all 110 flashcards in this deck.
Unlock Deck
k this deck
71
When comparing a system of emission taxes to a system of tradable pollution permits, the same amount of pollution could be abated in each as long as
A) the marginal cost of abatement was equal across all firms.
B) the cap on emissions was chosen such that the equilibrium price of the permits, p×, could rise over time.
C) the emission tax rate, t, was applied equally to all firms.
D) the marginal benefit of abatement curve was horizontal.
E) the cap on emissions was chosen such that the equilibrium price of the permits, p×, was equal to the emissions tax rate, t.
Unlock Deck
Unlock for access to all 110 flashcards in this deck.
Unlock Deck
k this deck
72
The marginal benefit of reducing pollution and the marginal cost of reducing pollution are given by the following equations: MB = - 2U2 + 18, and MC = 2U2 + 2, where U is the number of units of pollution abatement. What is the optimal level of pollution abatement?
A) 0
B) 1
C) 2
D) 3
E) 4
A) 0
B) 1
C) 2
D) 3
E) 4
Unlock Deck
Unlock for access to all 110 flashcards in this deck.
Unlock Deck
k this deck
73
Zero pollution is almost surely NOT a desirable social goal because
A) the totals costs of complete pollution elimination will be far greater than the total benefits.
B) the marginal benefit is equal to zero.
C) the total benefits of complete pollution elimination will be far greater than the total costs.
D) society benefits by employing people in the "pollution fighting" industry.
E) the marginal cost is equal to zero.
Unlock Deck
Unlock for access to all 110 flashcards in this deck.
Unlock Deck
k this deck
74
Direct pollution controls are usually inefficient because, for any given amount of pollution reduction, they
A) create new pollution as they eliminate existing pollution.
B) cost too much to enforce.
C) take into account differing marginal costs among firms.
D) do not minimize the total cost of pollution abatement.
E) are not complied with by firms.
A) create new pollution as they eliminate existing pollution.
B) cost too much to enforce.
C) take into account differing marginal costs among firms.
D) do not minimize the total cost of pollution abatement.
E) are not complied with by firms.
Unlock Deck
Unlock for access to all 110 flashcards in this deck.
Unlock Deck
k this deck
75
Given that different firms typically have different costs of pollution reduction,
A) tradable pollution permits will help to reduce the marginal costs of pollution.
B) there is a role for government to establish absolute limits on pollution.
C) the optimal emissions tax is thus easier to compute.
D) tradable pollution permits will help to reduce the total costs of pollution abatement.
E) it is clear that only a moral solution can actually achieve pollution reduction.
Unlock Deck
Unlock for access to all 110 flashcards in this deck.
Unlock Deck
k this deck
76
An upward- sloping marginal cost curve for pollution abatement means that
A) additional increments of pollution abatement will yield decreasing benefits.
B) it is impossible to know the benefits from additional increments of pollution reduction.
C) the marginal benefit of pollution reduction will increase with additional increments of pollution reduction.
D) the cost of an extra unit of pollution abatement will increase as the total amount of abatement rises.
E) society views additional increments of pollution reduction as absolutely necessary.
Unlock Deck
Unlock for access to all 110 flashcards in this deck.
Unlock Deck
k this deck
77
When the marginal costs of pollution abatement equal the marginal benefits of pollution abatement,
A) pollution has been entirely eliminated.
B) then firms are likely to increase output.
C) any further reductions in pollution will lower net social benefits.
D) then firms are likely to decrease output.
E) any further reductions in pollution will continue to increase net social benefits.
A) pollution has been entirely eliminated.
B) then firms are likely to increase output.
C) any further reductions in pollution will lower net social benefits.
D) then firms are likely to decrease output.
E) any further reductions in pollution will continue to increase net social benefits.
Unlock Deck
Unlock for access to all 110 flashcards in this deck.
Unlock Deck
k this deck
78
The diagram below shows the marginal costs of pollution abatement for two firms, Firm 1 and Firm 2. FIGURE 17- 5
Refer to Figure 17- 5. Suppose Firm 1 and Firm 2 are each abating Q3 units of pollution. If the government imposed an emissions tax of $40 per unit of emissions,
A) each firm would abate to Q3.
B) the level of pollution would be optimal.
C) each firm would abate to the same level.
D) Firm 2 would increase abatement beyond Q3 and Firm 1 would abate less than Q3.
E) Firm 1 would increase abatement beyond Q3 and Firm 2 would abate less than Q3.
FIGURE 17- 5Refer to Figure 17- 5. Suppose Firm 1 and Firm 2 are each abating Q3 units of pollution. If the government imposed an emissions tax of $40 per unit of emissions,
A) each firm would abate to Q3.
B) the level of pollution would be optimal.
C) each firm would abate to the same level.
D) Firm 2 would increase abatement beyond Q3 and Firm 1 would abate less than Q3.
E) Firm 1 would increase abatement beyond Q3 and Firm 2 would abate less than Q3.
Unlock Deck
Unlock for access to all 110 flashcards in this deck.
Unlock Deck
k this deck
79
The banning of wood- burning stoves and fireplaces is an example of
A) a market- based environmental policy.
B) tradable emissions standards.
C) safety regulations.
D) direct pollution controls.
E) emissions taxes.
A) a market- based environmental policy.
B) tradable emissions standards.
C) safety regulations.
D) direct pollution controls.
E) emissions taxes.
Unlock Deck
Unlock for access to all 110 flashcards in this deck.
Unlock Deck
k this deck
80
As a method of pollution control, tradable emissions permits, or "cap and trade",
A) allow pollution to continue unabated, but only at a huge price to polluting firms.
B) are more effective than emissions taxes when pollution is hard to measure.
C) are not a morally acceptable method of pollution control.
D) are an example of paternalistic social regulation.
E) have the advantage of decentralized decision making (like emissions taxes) while also setting the maximum permissible level of pollution (like direct controls).
Unlock Deck
Unlock for access to all 110 flashcards in this deck.
Unlock Deck
k this deck
Unlock Deck
Unlock for access to all 110 flashcards in this deck.


