Deck 15: Descriptive Statistics
Full screen (f)
Question
Question
Question
Question
Question
Question
Question
Question
Question
Question
Question
Question
Question
Question
Question
Question
Question
Question
Question
Question
Question
Question
Question
Question
Question
Question
Question
Question
Question
Question
Question
Question
Question
Question
Question
Question
Question
Question
Question
Question
Question
Question
Question
Question
Below are responses to six checklist questions.An "x" indicates an item was checked.Directions to the respondent said "Check all items that complete this sentence for you: The commercial made me feel …"
The first three items are considered negative,the second three items are considered positive.

What percentage of respondents expressed some opinion about the commercial?
The first three items are considered negative,the second three items are considered positive.
What percentage of respondents expressed some opinion about the commercial?
Question
Question
Question
The data below shows ratings after viewing a commercial.All measures are measured on a scale of "1" being the most positive to "5" being the least positive.

What percent of the sample found the commercial to be both Believable and Relevant?
What percent of the sample found the commercial to be both Believable and Relevant?
Question
An advertiser conducts a taste test of Cherry Coke versus Cherry Pepsi and Dr.Pepper.Ten respondents rate Coke and another ten rate Pepsi and another 10 rate Dr.Pepper.The scale used is:
Excellent taste (1)
Good taste (2)
Neither good nor bad taste (3)
Poor taste (4)
Very poor taste (5)
The ratings are shown below.
Denny,the researcher,concludes that reactions to Cherry Pepsi and Dr.Pepper are identical.Is this conclusion correct? Why?
Excellent taste (1)
Good taste (2)
Neither good nor bad taste (3)
Poor taste (4)
Very poor taste (5)
The ratings are shown below.
Denny,the researcher,concludes that reactions to Cherry Pepsi and Dr.Pepper are identical.Is this conclusion correct? Why?
Question
Below are responses to six checklist questions.An "x" indicates an item was checked.Directions to the respondent said "Check all items that complete this sentence for you: The commercial made me feel …"
The first three items are considered negative,the second three items are considered positive.

What percentage of respondents expressed some negative sentiment toward the commercial?
The first three items are considered negative,the second three items are considered positive.
What percentage of respondents expressed some negative sentiment toward the commercial?
Question
Question
Question
Question

Unlock Deck
Sign up to unlock the cards in this deck!
Unlock Deck
Unlock Deck
1/53
Play
Full screen (f)
Deck 15: Descriptive Statistics
1
On his last exam,Dennis answered 44 questions correctly out of 50 possible.What percentage of the questions did Dennis answer correctly?
A)44
B)64
C)88
D)94
A)44
B)64
C)88
D)94
C
2
Danny's teacher assigns grades as follows:
90% and over: A
80% to 89%: B
70% to 79%: C
69% or below: D
Danny answers 41 questions correctly out of 50 possible.What is Danny's grade?
A)A
B)B
C)C
D)D
90% and over: A
80% to 89%: B
70% to 79%: C
69% or below: D
Danny answers 41 questions correctly out of 50 possible.What is Danny's grade?
A)A
B)B
C)C
D)D
B
3
Three groups of individuals each see an ad (labeled Ad1,Ad2,and Ad3 below).Consider the responses (shown below)to a question that asks whether a respondent was positive or negative toward the ad viewed.
The mean on this measure for all three commercials is the same.This means that the standard deviation for all three commercials is also the same.
The mean on this measure for all three commercials is the same.This means that the standard deviation for all three commercials is also the same.
False
4
The ________ is the number that appears in the middle of an ordered set of data.
A)median
B)mode
C)standard score
A)median
B)mode
C)standard score
Unlock Deck
Unlock for access to all 53 flashcards in this deck.
Unlock Deck
k this deck
5
Fifty individuals responded to a survey.The percentage of men and women is shown below. How many survey respondents were men?
A)10
B)35
C)45
D)90
A)10
B)35
C)45
D)90
Unlock Deck
Unlock for access to all 53 flashcards in this deck.
Unlock Deck
k this deck
6
Which of the measures shown below is most sensitive to extreme values?
A)Mean
B)Median
C)Mode
A)Mean
B)Median
C)Mode
Unlock Deck
Unlock for access to all 53 flashcards in this deck.
Unlock Deck
k this deck
7
Eleven individuals respond to a survey question.They are asked to rate commercial relevance on a scale of 1 to 5.Their responses are: 2,3,5,4,2,4,2,2,1,1,2.The median in this set of scores is ________.
A)1
B)2
C)3
D)4
A)1
B)2
C)3
D)4
Unlock Deck
Unlock for access to all 53 flashcards in this deck.
Unlock Deck
k this deck
8
Francis has taken two exams in her advertising class.Both exams consisted of 100 questions.On the first exam,Francis answered 57 questions correctly.On the second exam,she answered 93 questions correctly.What is Francis' overall average?
A)70
B)75
C)93
D)150
A)70
B)75
C)93
D)150
Unlock Deck
Unlock for access to all 53 flashcards in this deck.
Unlock Deck
k this deck
9
Tom is trying to summarize the housing values in his neighborhood.There are ten houses in total which fall into the following value ranges: Which summary measure is most appropriate to summarize this data?
A)mean
B)median or mode
A)mean
B)median or mode
Unlock Deck
Unlock for access to all 53 flashcards in this deck.
Unlock Deck
k this deck
10
The mean and mode,versus an average,are better descriptors of a distribution when ________.
A)the sample is not randomly selected.
B)the survey question has fewer than five options.
C)there are over 2,000 respondents in the sample.
D)the distribution is highly skewed.
A)the sample is not randomly selected.
B)the survey question has fewer than five options.
C)there are over 2,000 respondents in the sample.
D)the distribution is highly skewed.
Unlock Deck
Unlock for access to all 53 flashcards in this deck.
Unlock Deck
k this deck
11
On his last exam,Dennis missed 12 questions out of 50 possible.What percentage of the questions did Dennis answer correctly?
A)24
B)62
C)72
D)76
A)24
B)62
C)72
D)76
Unlock Deck
Unlock for access to all 53 flashcards in this deck.
Unlock Deck
k this deck
12
Consider the survey question shown below. Thinking back to the commercial you just saw, how relevant or not relevant would you say the commercial's message was? Hould you say that it was ..
One hundred people answer the question after seeing Commercial A and a different 100 people answer this question after seeing Commercial B.The average relevance for Commercial A was 3.0 and the average relevance for Commercial B was 3.0.
This means that the percentage of individuals selecting "Extremely relevant" was identical for the two commercials.
Unlock Deck
Unlock for access to all 53 flashcards in this deck.
Unlock Deck
k this deck
13
A ________ distribution results in the same value for the mean,median and mode.
A)symmetrical
B)left-skewed
C)right-skewed
A)symmetrical
B)left-skewed
C)right-skewed
Unlock Deck
Unlock for access to all 53 flashcards in this deck.
Unlock Deck
k this deck
14
The ________ is a measure of a set of scores' dispersion.
A)mean
B)median
C)mode
D)standard deviation
A)mean
B)median
C)mode
D)standard deviation
Unlock Deck
Unlock for access to all 53 flashcards in this deck.
Unlock Deck
k this deck
15
Eleven individuals respond to a survey question.They are asked to rate commercial relevance on a scale of 1 to 5.Their responses are: 1,3,1,4,2,4,1,2,1,1,2.The mode in this set of scores is ________.
A)1
B)2
C)3
D)4
A)1
B)2
C)3
D)4
Unlock Deck
Unlock for access to all 53 flashcards in this deck.
Unlock Deck
k this deck
16
The data below shows the distribution of men and women responding to a survey. What percentage of the respondents were women?
A)17
B)33
C)34
D)66
A)17
B)33
C)34
D)66
Unlock Deck
Unlock for access to all 53 flashcards in this deck.
Unlock Deck
k this deck
17
A ________ distribution results in a median and mean higher than the mode.
A)symmetrical
B)left-skewed
C)right-skewed
A)symmetrical
B)left-skewed
C)right-skewed
Unlock Deck
Unlock for access to all 53 flashcards in this deck.
Unlock Deck
k this deck
18
Consider the responses to a question measuring commercial believability (shown below). What is the average believability rating?
A)1.5
B)2.5
C)2.8
D)28.0
A)1.5
B)2.5
C)2.8
D)28.0
Unlock Deck
Unlock for access to all 53 flashcards in this deck.
Unlock Deck
k this deck
19
The ________ is the number in a set of scores that appears most often.
A)median
B)mode
C)standard score
A)median
B)mode
C)standard score
Unlock Deck
Unlock for access to all 53 flashcards in this deck.
Unlock Deck
k this deck
20
The following question was asked on an advertising test: Thinking back to the commercial you just saw, how relevant or not relevant would you say the commercial's message was? Hould you say that it was ..
Ten people answer this question with the following responses: 1,2,3,2,3,3,2,1,5,5.What is the average relevance rating?
A)2.0
B)2.7
C)10.0
D)27.0
Ten people answer this question with the following responses: 1,2,3,2,3,3,2,1,5,5.What is the average relevance rating?
A)2.0
B)2.7
C)10.0
D)27.0
Unlock Deck
Unlock for access to all 53 flashcards in this deck.
Unlock Deck
k this deck
21
The table below shows the responses to a ranking question. What percentage should replace the question mark?
A)6
B)66
C)76
D)cannot be determined from the data provided
A)6
B)66
C)76
D)cannot be determined from the data provided
Unlock Deck
Unlock for access to all 53 flashcards in this deck.
Unlock Deck
k this deck
22
There are three patterns of response for a series of checklist items.A respondent can check: (1)all positive items,(2)all negative items,or (3)a mix of both positive and negative items.
Unlock Deck
Unlock for access to all 53 flashcards in this deck.
Unlock Deck
k this deck
23
You are examining the pattern of response on a survey prior to data analysis.The examination of the data on the question level should be followed by a review of each individual respondent's pattern of response.
Unlock Deck
Unlock for access to all 53 flashcards in this deck.
Unlock Deck
k this deck
24
Consider the data shown in the table below.The table shows responses to a classification question. What percent of the sample is not enrolled in any school?
A)9%
B)11%
C)55%
D)cannot be calculated from the data shown
A)9%
B)11%
C)55%
D)cannot be calculated from the data shown
Unlock Deck
Unlock for access to all 53 flashcards in this deck.
Unlock Deck
k this deck
25
Which of the following descriptive statistics is (are)appropriate for ordinal level measures?
A)percentages
B)averages
C)standard deviation
D)all three are appropriate ways to examine ordinal level measures
A)percentages
B)averages
C)standard deviation
D)all three are appropriate ways to examine ordinal level measures
Unlock Deck
Unlock for access to all 53 flashcards in this deck.
Unlock Deck
k this deck
26
An initial review of data quality entails examining the percentage distribution for each question to see if there is anything "odd" in the pattern of response.
Unlock Deck
Unlock for access to all 53 flashcards in this deck.
Unlock Deck
k this deck
27
Which of the following descriptive statistics is (are)appropriate for ranking questions?
A)percentages
B)averages
C)standard deviation
D)all three are appropriate ways to examine responses to ranking questions
A)percentages
B)averages
C)standard deviation
D)all three are appropriate ways to examine responses to ranking questions
Unlock Deck
Unlock for access to all 53 flashcards in this deck.
Unlock Deck
k this deck
28
Which of the following descriptive statistics is (are)appropriate for nominal level measures?
A)percentages
B)averages
C)standard deviation
D)all three are appropriate ways to examine nominal level measures
A)percentages
B)averages
C)standard deviation
D)all three are appropriate ways to examine nominal level measures
Unlock Deck
Unlock for access to all 53 flashcards in this deck.
Unlock Deck
k this deck
29
Two commercials are tested.Commercial A uses a five-point scale to measure believability while Commercial B uses a seven-point scale to measure believability.The different number of scale options prevents a comparison of the two scales' standard deviations.
Unlock Deck
Unlock for access to all 53 flashcards in this deck.
Unlock Deck
k this deck
30
Three groups of individuals each see an ad (labeled Ad1,Ad2,and Ad3 below).Consider the responses (shown below)to a question that asks whether a respondent was positive or negative toward the ad viewed.. Which commercial,if any,will have the largest standard deviation?
A)1
B)2
C)3
D)The standard deviation for all three commercials will be the same.
A)1
B)2
C)3
D)The standard deviation for all three commercials will be the same.
Unlock Deck
Unlock for access to all 53 flashcards in this deck.
Unlock Deck
k this deck
31
You are examining the patterns of response on a survey prior to data analysis.As a general rule of thumb,you should closely examine any question that has a relatively low overall completion rate.
Unlock Deck
Unlock for access to all 53 flashcards in this deck.
Unlock Deck
k this deck
32
Which of the following descriptive statistics is (are)appropriate for checklist questions?
A)percentages
B)averages
C)standard deviation
D)all three are appropriate ways to examine checklist data
A)percentages
B)averages
C)standard deviation
D)all three are appropriate ways to examine checklist data
Unlock Deck
Unlock for access to all 53 flashcards in this deck.
Unlock Deck
k this deck
33
After examining each individual's responses to a survey,you find that one respondent has failed to answer most of the questions.What is your best course of action?
A)Substitute the mean response on each question for the missing data
B)Recontact the respondent and obtain the missing information
C)Eliminate the respondent from the sample
A)Substitute the mean response on each question for the missing data
B)Recontact the respondent and obtain the missing information
C)Eliminate the respondent from the sample
Unlock Deck
Unlock for access to all 53 flashcards in this deck.
Unlock Deck
k this deck
34
Consider the survey question shown below. Thinking back to the commercial you just saw, how relevant or not relevant would you say the commercial's message was? Hould you say that it was ..
One hundred people answer the question after seeing Commercial A and a different 100 people answer this question after seeing Commercial B.The mean response on this measure for both commercials is 2.3.The standard deviation for Commercial A is 1.1 and the standard deviation for Commercial B is 1.9.
This means that dispersal of scores for Commercial B is larger than the dispersal of scores for Commercial A.
Unlock Deck
Unlock for access to all 53 flashcards in this deck.
Unlock Deck
k this deck
35
A key component of the formula used to compute standard deviation is the subtraction of the overall mean from each individual score.
Unlock Deck
Unlock for access to all 53 flashcards in this deck.
Unlock Deck
k this deck
36
At the end of your survey,you ask a classification question regarding respondent gender.The response options are "male (coded 1)" and "female (coded 2)." Which of the following descriptive statistics is (are)appropriate for this question?
A)percentages
B)averages
C)standard deviation
D)all three are appropriate ways to examine responses to this question
A)percentages
B)averages
C)standard deviation
D)all three are appropriate ways to examine responses to this question
Unlock Deck
Unlock for access to all 53 flashcards in this deck.
Unlock Deck
k this deck
37
Consider the data shown in the table below.The table shows responses to a checklist question. What percent of the respondents found the commercial valuable?
A)29%
B)49%
C)145%
D)cannot be determined from the data provided
A)29%
B)49%
C)145%
D)cannot be determined from the data provided
Unlock Deck
Unlock for access to all 53 flashcards in this deck.
Unlock Deck
k this deck
38
You are examining the patterns of response on a survey prior to data analysis.You find one question where 100% of the respondents indicated that they "strongly agreed" that the commercial just viewed was entertaining.Since this is a positive finding,no further examination of the responses to this question is necessary.
Unlock Deck
Unlock for access to all 53 flashcards in this deck.
Unlock Deck
k this deck
39
Consider the data shown in the table below.The table shows responses to a classification question. What percent of the sample is currently enrolled in college at the undergraduate or advanced degree level?
A)45%
B)64%
C)320%
D)cannot be calculated from the data shown
A)45%
B)64%
C)320%
D)cannot be calculated from the data shown
Unlock Deck
Unlock for access to all 53 flashcards in this deck.
Unlock Deck
k this deck
40
The first step in preparing data for analysis is to compute the mean for each appropriate measure.
Unlock Deck
Unlock for access to all 53 flashcards in this deck.
Unlock Deck
k this deck
41
Which of the following descriptive statistics is (are)appropriate for interval level measures?
A)percentages
B)averages
C)standard deviation
D)all three are appropriate ways to examine interval level measures
A)percentages
B)averages
C)standard deviation
D)all three are appropriate ways to examine interval level measures
Unlock Deck
Unlock for access to all 53 flashcards in this deck.
Unlock Deck
k this deck
42
Why is it important to examine the data prior to starting formal data analysis?
Unlock Deck
Unlock for access to all 53 flashcards in this deck.
Unlock Deck
k this deck
43
Which of the following descriptive statistics is (are)appropriate for rating scales?
A)percentages
B)averages
C)standard deviation
D)all three are appropriate ways to examine responses to a rating scale
A)percentages
B)averages
C)standard deviation
D)all three are appropriate ways to examine responses to a rating scale
Unlock Deck
Unlock for access to all 53 flashcards in this deck.
Unlock Deck
k this deck
44
Below are responses to six checklist questions.An "x" indicates an item was checked.Directions to the respondent said "Check all items that complete this sentence for you: The commercial made me feel …"
The first three items are considered negative,the second three items are considered positive.
What percentage of respondents expressed some opinion about the commercial?
The first three items are considered negative,the second three items are considered positive.
What percentage of respondents expressed some opinion about the commercial?
Unlock Deck
Unlock for access to all 53 flashcards in this deck.
Unlock Deck
k this deck
45
Which of the following descriptive statistics is (are)appropriate for ratio level measures?
A)percentages
B)averages
C)standard deviation
D)all three are appropriate ways to examine responses to ratio level measures
A)percentages
B)averages
C)standard deviation
D)all three are appropriate ways to examine responses to ratio level measures
Unlock Deck
Unlock for access to all 53 flashcards in this deck.
Unlock Deck
k this deck
46
Think about a constant sum question.When determining the average number of points allocated to a particular object,you divide the total number of points given to that object (by all respondents)by the number of respondents answering the question.
A)True
B)False
A)True
B)False
Unlock Deck
Unlock for access to all 53 flashcards in this deck.
Unlock Deck
k this deck
47
The data below shows ratings after viewing a commercial.All measures are measured on a scale of "1" being the most positive to "5" being the least positive.
What percent of the sample found the commercial to be both Believable and Relevant?
What percent of the sample found the commercial to be both Believable and Relevant?
Unlock Deck
Unlock for access to all 53 flashcards in this deck.
Unlock Deck
k this deck
48
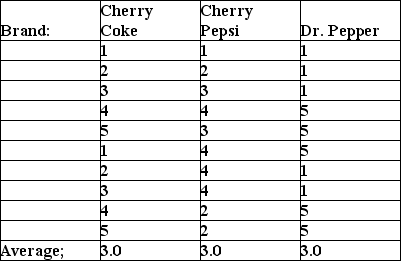
An advertiser conducts a taste test of Cherry Coke versus Cherry Pepsi and Dr.Pepper.Ten respondents rate Coke and another ten rate Pepsi and another 10 rate Dr.Pepper.The scale used is:
Excellent taste (1)
Good taste (2)
Neither good nor bad taste (3)
Poor taste (4)
Very poor taste (5)
The ratings are shown below.
Denny,the researcher,concludes that reactions to Cherry Pepsi and Dr.Pepper are identical.Is this conclusion correct? Why?
Excellent taste (1)
Good taste (2)
Neither good nor bad taste (3)
Poor taste (4)
Very poor taste (5)
The ratings are shown below.
Denny,the researcher,concludes that reactions to Cherry Pepsi and Dr.Pepper are identical.Is this conclusion correct? Why?
Unlock Deck
Unlock for access to all 53 flashcards in this deck.
Unlock Deck
k this deck
49
Below are responses to six checklist questions.An "x" indicates an item was checked.Directions to the respondent said "Check all items that complete this sentence for you: The commercial made me feel …"
The first three items are considered negative,the second three items are considered positive.
What percentage of respondents expressed some negative sentiment toward the commercial?
The first three items are considered negative,the second three items are considered positive.
What percentage of respondents expressed some negative sentiment toward the commercial?
Unlock Deck
Unlock for access to all 53 flashcards in this deck.
Unlock Deck
k this deck
50
The following two statements refer to subgroup analysis.
I.Subgroup analyses are not necessary when the overall research findings
Are positive or reinforce pre-existing beliefs.
II.An analysis of subgroup data often provides deeper insights into data trends.
Which,if any,of these statements is (are)true?
A)I only
B)II only
C)I and II are both true
D)Neither I nor II is true
Unlock Deck
Unlock for access to all 53 flashcards in this deck.
Unlock Deck
k this deck
51
Which of the following descriptive statistics is (are)appropriate for constant sum questions?
A)percentages
B)averages
C)standard deviation
D)all three are appropriate ways to examine responses to a constant sum
A)percentages
B)averages
C)standard deviation
D)all three are appropriate ways to examine responses to a constant sum
Unlock Deck
Unlock for access to all 53 flashcards in this deck.
Unlock Deck
k this deck
52
Consider the ranking data shown in the table below. What is the "net best ranking" for Sprint?
A)-30%
B)-2%
C)2%
D)30%
A)-30%
B)-2%
C)2%
D)30%
Unlock Deck
Unlock for access to all 53 flashcards in this deck.
Unlock Deck
k this deck
53
When presenting rating scale data,it is never permissible to combine several response options,that is,to create a new category "agree" composed of those who "strongly agree" and "slightly agree."
Unlock Deck
Unlock for access to all 53 flashcards in this deck.
Unlock Deck
k this deck
Unlock Deck
Unlock for access to all 53 flashcards in this deck.


