Deck 16: Predictive Analytics Ii: Logistic Regression, Discriminate Analysis,
Full screen (f)
Question
Question
Question
Question
Question
Question
Question
Question
Question
Question
Question
Question
Question
Question
Question
Question
Question
Question
Question
Question
Question
Question
Question
Question
Question
Question
Question
Question
Question
Question
Question
Question
Question
Question
Question
Question
Question
Question
Question
Question
Question
Question
Question
Question
Question
Question
Question
Question
Question
Question
Question
Question
Question
Question
Question
Question
Question
Question
Question
Question
Question
Question
The chart provided shows the probability that a customer will use a coupon offered in a local paper by Lucky Shirts Store. Compute the odds ratio for the BankOne variable x2 = 1, holding annual spending constant at x1 = 4000. Annual Spending at Lucky Shirts Store

A) 1.3787
B) .4594
C) 1.4845
D) .3148
A) 1.3787
B) .4594
C) 1.4845
D) .3148
Question
Below gives the data concerning (1) the dependent variable Default which equals 1 if a customer defaults on their loan and 0 if they do not; (2) the independent variable Price of Home, which is the price of the home (in tens) and (3) the independent variable First Purchase which equals 0 if the customer has owned a home before and 1 if this is their first home. Identify and interpret the odds ratio estimate for First Purchase. 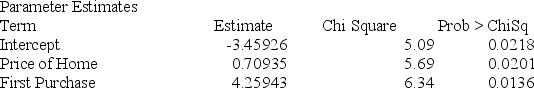

A) Odds ratio: 10.8675; a first-time home buyer is 10 times less likely to default than a buyer who has bought a home before.
B) Odds ratio: 10.8675; a first-time home buyer is 11 times more likely to default than a buyer who has bought a home before.
C) Odds ratio: 10.8675; a first-time home buyer is 10% times more likely to default than a buyer who has bought a home before.
D) Odds ratio: 10.8675; a first-time home buyer is 11% times more likely to default than a buyer who has bought a home before.
Question
Below gives the data concerning (1) the dependent variable Default which equals 1 if a customer defaults on their loan and 0 if they do not; (2) the independent variable Price of Home, which is the price of the home (in tens) and (3) the independent variable First Purchase which equals 1 if the customer has owned a home before and 0 if this is their first home. Estimate the probability that a buyer who spent $135,000 on their first home purchase will default. 


A) .8529
B) .8501
C) .8674
D) .8754
A) .8529
B) .8501
C) .8674
D) .8754
Question
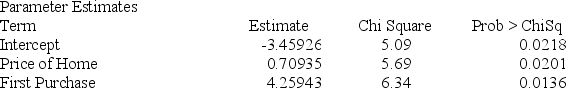
Below gives the data concerning (1) the dependent variable Default which equals 1 if a customer defaults on their loan and 0 if they do not; (2) the independent variable Price of Home, which is the price of the home (in hundred tens) and (3) the independent variable First Purchase which equals 0 if the customer has owned a home before and 1 if this is their first home. Evaluate the significance of each independent variable in the model. 
A) Intercept = −3.4592 significant, price of home = .70935 significant
B) Intercept = −3.492 not significant, first purchase of home = .70935 not significant
C) Price of home is significant p-value = .0201, first purchase is significant p-value = .0136
D) Price of home is significant p-value = .0136, first purchase is significant p-value = .201
Question
Below gives the data concerning (1) the dependent variable Default which equals 1 if a customer defaults on their loan and 0 if they do not; (2) the independent variable Price of Home, which is the price of the home (in tens) and (3) the independent variable First Purchase which equals 1 if the customer has owned a home before and 0 if this is their first home. Estimate the probability that a buyer who spent $435,000 on their first home purchase will default. 


A) .99636
B) .9899
C) .9768
D) .9695
A) .99636
B) .9899
C) .9768
D) .9695
Question
Below gives the data concerning (1) the dependent variable Default which equals 1 if a customer defaults on their loan and 0 if they do not; (2) the independent variable Price of Home, which is the price of the home (in tens) and (3) the independent variable First Purchase which equals 0 if the customer has owned a home before and 1 if this is their first home. Identify and interpret the odds ratio estimate for Price of Home. 

A) Odds ratio: 4.56789; for each addition $10 spent on a home, the odds of a person defaulting increased 4.56%
B) Odds ratio: 4.56789; for each addition $100 spent on a home, the odds of a person defaulting increased 4.56%
C) Odds ratio: 4.56789; for each addition $10 spent on a home, a default is 4 times more likely
D) Odds ratio: 4.56789; for each addition $1000 spent on a home, a default is 4 times less likely for each additional $1,000 spent
Question
The chart provided shows the probability that a customer will use a coupon offered in a local paper by Lucky Shirts Store. Using this information, compute the odds that a customer will use the coupon, who spends $4,000 and does NOT bank at BankOne. Annual Spending at Lucky Shirts Store
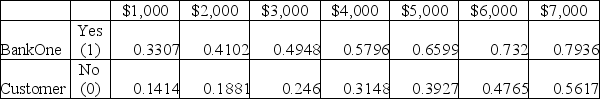
A) .4594
B) .3148
C) 1.4845
D) .7742
A) .4594
B) .3148
C) 1.4845
D) .7742
Question
Below gives the data concerning (1) the dependent variable Default which equals 1 if a customer defaults on their loan and 0 if they do not; (2) the independent variable Price of Home, which is the price of the home (in tens) and (3) the independent variable First Purchase which equals 0 if the customer has owned a home before and 1 if this is their first home. Interpret the confusion matrix. 


A) The misclassification rate for defaulters is .08 and the misclassification for non-defaulters is .1290.
B) The misclassification rate for defaulters is .08 and the misclassification for non-defaulters is .1482.
C) The misclassification rate for defaulters is .1290 and the misclassification for non-defaulters is .1111.
D) The misclassification rate for defaulters is .1482 and the misclassification for non-defaulters is .0870.
Question
Question
Question
Below gives the data concerning (1) the dependent variable Default which equals 1 if a customer defaults on their loan and 0 if they do not; (2) the independent variable Price of Home, which is the price of the home (in tens) and (3) the independent variable First Purchase which equals 0 if the customer has owned a home before and 1 if this is their first home. Estimate the probability that a buyer who spent $678,700 on their first home will default. 

A) .9832
B) .99636
C) .9998
D) .9345
A) .9832
B) .99636
C) .9998
D) .9345
Question
Below gives the data concerning (1) the dependent variable Default which equals 1 if a customer defaults on their loan and 0 if they do not; (2) the independent variable Price of Home, which is the price of the home (in hundred tens) and (3) the independent variable First Purchase which equals 0 if the customer has owned a home before and 1 if this is their first home. Identify the independent variables in this equation. 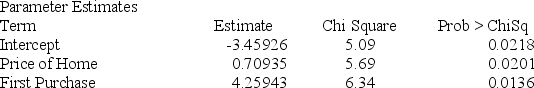
A) Price of Home and Default
B) Default
C) Price of Home, First Purchase, Default
D) Price of Home and First Purchase
A) Price of Home and Default
B) Default
C) Price of Home, First Purchase, Default
D) Price of Home and First Purchase
Question
Question
Question
Below gives the data concerning (1) the dependent variable Default which equals 1 if a customer defaults on their loan and 0 if they do not; (2) the independent variable Price of Home, which is the price of the home (in tens) and (3) the independent variable First Purchase which equals 1 if the customer has owned a home before and 0 if this is their first home. Estimate the probability that a buyer who spent $535,600 on their fourth home purchase will default. 


A) .5842
B) .5674
C) .9834
D) .9465
A) .5842
B) .5674
C) .9834
D) .9465
Question
The number of dummy variables required if a categorical variable has k levels is:
A) k − 1
B) b.k
C) k + 1
D) !
!
A) k − 1
B) b.k
C) k + 1
D)
! Question
Question
Question

Unlock Deck
Sign up to unlock the cards in this deck!
Unlock Deck
Unlock Deck
1/101
Play
Full screen (f)
Deck 16: Predictive Analytics Ii: Logistic Regression, Discriminate Analysis,
1
The natural logarithm of the odds is called the logit.
True
2
Linear discriminate analysis does not assume that for each particular category being considered, the joint probability distribution of the predictor variables is a multivariate normal distribution.
False
3
The penalty weight used in the neural network models controls the trade-off between overfitting and underfitting.
True
4
It is not possible to apply a logistic regression using a neural network algorithm.
Unlock Deck
Unlock for access to all 101 flashcards in this deck.
Unlock Deck
k this deck
5
A regression technique for analyzing large data sets is neural network modeling.
Unlock Deck
Unlock for access to all 101 flashcards in this deck.
Unlock Deck
k this deck
6
Forward selection with simultaneous validation is when one predictor variable is added at a time to a model where the variable added to the model has the smallest p-value when added to the model.
Unlock Deck
Unlock for access to all 101 flashcards in this deck.
Unlock Deck
k this deck
7
Linear discriminate analysis can classify accurately even when the assumptions are not valid.
Unlock Deck
Unlock for access to all 101 flashcards in this deck.
Unlock Deck
k this deck
8
A major drawback of neural network modeling is that its parameters are usually uninterpretable.
Unlock Deck
Unlock for access to all 101 flashcards in this deck.
Unlock Deck
k this deck
9
In logistic regression the goal is to predict the true value of the independent variable.
Unlock Deck
Unlock for access to all 101 flashcards in this deck.
Unlock Deck
k this deck
10
The odds of an event occurring is the probability that the event will not occur divided by the probability that the event will occur.
Unlock Deck
Unlock for access to all 101 flashcards in this deck.
Unlock Deck
k this deck
11
The logistic regression equation involves the exponential function and it estimates the probability that an observation described by a specified set of predictor variable values will fall into a particular class.
Unlock Deck
Unlock for access to all 101 flashcards in this deck.
Unlock Deck
k this deck
12
A neural network is nonlinear.
Unlock Deck
Unlock for access to all 101 flashcards in this deck.
Unlock Deck
k this deck
13
A dummy variable is a continuous variable.
Unlock Deck
Unlock for access to all 101 flashcards in this deck.
Unlock Deck
k this deck
14
A single-layer perceptron neural network model consists of only one layer called the hidden layer.
Unlock Deck
Unlock for access to all 101 flashcards in this deck.
Unlock Deck
k this deck
15
The confusion matrix helps you assess your model's accuracy and avoid overfitting.
Unlock Deck
Unlock for access to all 101 flashcards in this deck.
Unlock Deck
k this deck
16
Linear regression requires the assumptions of independence, linearity, normality, homogeneity of variance and non-multicollinearity.
Unlock Deck
Unlock for access to all 101 flashcards in this deck.
Unlock Deck
k this deck
17
If the outcome variable is quantitative and all explanatory variables take values 0 or 1, a logistic regression model is appropriate.
Unlock Deck
Unlock for access to all 101 flashcards in this deck.
Unlock Deck
k this deck
18
To avoid overfitting in the neural network model, the parameter estimates that are used minimize the least squares criterion.
Unlock Deck
Unlock for access to all 101 flashcards in this deck.
Unlock Deck
k this deck
19
The AIC never penalizes the model for the number of model coefficients; therefore we do not favor a minimum AIC value.
Unlock Deck
Unlock for access to all 101 flashcards in this deck.
Unlock Deck
k this deck
20
Neural network modeling represents the response variable as a linear function of the predictor variables.
Unlock Deck
Unlock for access to all 101 flashcards in this deck.
Unlock Deck
k this deck
21
In logistic regression, ________ is used as a goodness-of-fit test.
A) deviance
B) Pearson
C) Hosmer-Lemeshow
D) All of the choices are correct.
A) deviance
B) Pearson
C) Hosmer-Lemeshow
D) All of the choices are correct.
Unlock Deck
Unlock for access to all 101 flashcards in this deck.
Unlock Deck
k this deck
22
Neural networks are common for large data mining projects to analyze a data set involving millions of observations.
Unlock Deck
Unlock for access to all 101 flashcards in this deck.
Unlock Deck
k this deck
23
After calculating the squared differences in linear discriminate analysis, you can estimate the probability of how that specific observation fares with regard to the categorical outcome.
Unlock Deck
Unlock for access to all 101 flashcards in this deck.
Unlock Deck
k this deck
24
In linear discriminate analysis we calculate the means of the predictor variable values for the observations belonging to both categories that are in the data set.
Unlock Deck
Unlock for access to all 101 flashcards in this deck.
Unlock Deck
k this deck
25
In logistic regression,
A) the dependent variable is continuous.
B) the dependent variable is divided into two equal subcategories.
C) the dependent variable is categorical.
D) there is no dependent variable.
A) the dependent variable is continuous.
B) the dependent variable is divided into two equal subcategories.
C) the dependent variable is categorical.
D) there is no dependent variable.
Unlock Deck
Unlock for access to all 101 flashcards in this deck.
Unlock Deck
k this deck
26
In logistic regression, deviance is a measure of difference between a ________ model and the ________ model.
A) saturated, fitted
B) fitted, saturated
A) saturated, fitted
B) fitted, saturated
Unlock Deck
Unlock for access to all 101 flashcards in this deck.
Unlock Deck
k this deck
27
The dependent variable in logistic regression can take on values of 0 and 1.
Unlock Deck
Unlock for access to all 101 flashcards in this deck.
Unlock Deck
k this deck
28
The probability of a new employee passing a test is .20. What are the odds of the employee passing the test?
A) .20
B) .25
C) .80
D) .75
A) .20
B) .25
C) .80
D) .75
Unlock Deck
Unlock for access to all 101 flashcards in this deck.
Unlock Deck
k this deck
29
When we compare the squared differences in linear discriminate analysis we are looking for the larger value to predict the outcome of that data point.
Unlock Deck
Unlock for access to all 101 flashcards in this deck.
Unlock Deck
k this deck
30
The odds of an event occurring is the probability that the event will occur divided by the probability that the event will not occur.
Unlock Deck
Unlock for access to all 101 flashcards in this deck.
Unlock Deck
k this deck
31
Since the neural network model employs many parameters, there is a danger that we will overfit the model.
Unlock Deck
Unlock for access to all 101 flashcards in this deck.
Unlock Deck
k this deck
32
In linear discriminate analysis we compare squared differences to see where a particular data point lies in relation to the categorical outcome.
Unlock Deck
Unlock for access to all 101 flashcards in this deck.
Unlock Deck
k this deck
33
Squared distances can be used in two different ways in linear discriminate analysis.
Unlock Deck
Unlock for access to all 101 flashcards in this deck.
Unlock Deck
k this deck
34
Which of the following methods do we use to best fit the data in logistic regression?
A) Least square error
B) Maximum likelihood
C) Exponential decay
D) Both least square error and exponential decay
A) Least square error
B) Maximum likelihood
C) Exponential decay
D) Both least square error and exponential decay
Unlock Deck
Unlock for access to all 101 flashcards in this deck.
Unlock Deck
k this deck
35
The ________ regression method is used when the response variable is a qualitative or a categorical variable.
A) quadratic
B) logistic
C) multiple
D) simple
A) quadratic
B) logistic
C) multiple
D) simple
Unlock Deck
Unlock for access to all 101 flashcards in this deck.
Unlock Deck
k this deck
36
Which of the following tests can be used to assess whether the logistic regression model is a good fit?
A) Homer-Lemeshow test
B) Pearson
C) ROC curve
D) All of the choices are correct.
A) Homer-Lemeshow test
B) Pearson
C) ROC curve
D) All of the choices are correct.
Unlock Deck
Unlock for access to all 101 flashcards in this deck.
Unlock Deck
k this deck
37
In logistic regression, the goal is to find
A) the actual value of the dependent variable.
B) the odds of the dependent variable.
C) the log of the dependent variable.
D) None of the choices are correct.
A) the actual value of the dependent variable.
B) the odds of the dependent variable.
C) the log of the dependent variable.
D) None of the choices are correct.
Unlock Deck
Unlock for access to all 101 flashcards in this deck.
Unlock Deck
k this deck
38
A soccer player takes a shot on goal 15 times and scores a goal 3 of those attempts. What are the odds of the soccer player scoring a goal?
A) 3/15
B) 5
C) 4
D) 3/12
A) 3/15
B) 5
C) 4
D) 3/12
Unlock Deck
Unlock for access to all 101 flashcards in this deck.
Unlock Deck
k this deck
39
The hidden node function in neural networks is usually linear.
Unlock Deck
Unlock for access to all 101 flashcards in this deck.
Unlock Deck
k this deck
40
Logistic regression is used when you want to
A) predict a categorical variable from continuous or categorical variables.
B) predict a continuous variable from categorical variables.
C) predict any categorical variable from other categorical variables.
D) predict a continuous variable from a categorical variable.
A) predict a categorical variable from continuous or categorical variables.
B) predict a continuous variable from categorical variables.
C) predict any categorical variable from other categorical variables.
D) predict a continuous variable from a categorical variable.
Unlock Deck
Unlock for access to all 101 flashcards in this deck.
Unlock Deck
k this deck
41
Maximum likelihood estimation is an advanced statistical procedure which provides point estimates, and it is typically
A) ahead of the logistic regression.
B) a part of the logistic regression.
C) after the logistic regression to ensure statistical accuracy.
D) a simple process, completed to provide comparison estimates.
A) ahead of the logistic regression.
B) a part of the logistic regression.
C) after the logistic regression to ensure statistical accuracy.
D) a simple process, completed to provide comparison estimates.
Unlock Deck
Unlock for access to all 101 flashcards in this deck.
Unlock Deck
k this deck
42
Logistic regression analysis can answer what three major questions about a dataset?
A) Causal analysis, forecasting of an outcome, and trend forecasting
B) Causal analysis, odds of success, and trend forecasting
C) Odds of success, trend forecasting, and the confusion matrix
D) Maximum likelihood, causal analysis, and odds of success
A) Causal analysis, forecasting of an outcome, and trend forecasting
B) Causal analysis, odds of success, and trend forecasting
C) Odds of success, trend forecasting, and the confusion matrix
D) Maximum likelihood, causal analysis, and odds of success
Unlock Deck
Unlock for access to all 101 flashcards in this deck.
Unlock Deck
k this deck
43
Which method will we use to best fit the data in logistic regression?
A) Maximum likelihood
B) Least effect likelihood
C) Least square error
D) Jaccard distance
A) Maximum likelihood
B) Least effect likelihood
C) Least square error
D) Jaccard distance
Unlock Deck
Unlock for access to all 101 flashcards in this deck.
Unlock Deck
k this deck
44
An example of a dummy variable is used in categorical data applications and might include
A) assigning the number 1 to Democrats and 2 to Republicans.
B) assigning the number 1 to the first place runner, and 2 to the second place runner.
C) assigning a 0 to students who can run a 10-minute mile, and a number 1 to students who run a 7-minute mile.
D) assigning a 1 to the probability of the customer receiving a $10 gift card and a 0 to the customer receiving a $20 gift card, when 10 of each denomination are being sent to a random sample of customers.
Unlock Deck
Unlock for access to all 101 flashcards in this deck.
Unlock Deck
k this deck
45
One of the very good methods to analyze the performance of logistic regression is AIC, which is similar to R-squared in Linear Regression. Which of the following is true about AIC?
A) Model with minimum AIC value
B) Model with maximum AIC value
C) Both but depends on the situation
D) Both regardless of the situation
A) Model with minimum AIC value
B) Model with maximum AIC value
C) Both but depends on the situation
D) Both regardless of the situation
Unlock Deck
Unlock for access to all 101 flashcards in this deck.
Unlock Deck
k this deck
46
In a neural network, the penalty weight controls the trade-off between ________ and ________.
A) overfitting; underfitting
B) overfitting; not fitting
C) underfitting; fitting
D) fitting; not fitting
A) overfitting; underfitting
B) overfitting; not fitting
C) underfitting; fitting
D) fitting; not fitting
Unlock Deck
Unlock for access to all 101 flashcards in this deck.
Unlock Deck
k this deck
47
Deviance, Pearson and Hosmer-Lemeshow are all ________ that can be used in ________.
A) goodness of fit tests; logistic regression
B) predictive analysis tests; logistic regression
C) probability tests; neural network modeling
D) goodness of fit tests; neural network modeling
A) goodness of fit tests; logistic regression
B) predictive analysis tests; logistic regression
C) probability tests; neural network modeling
D) goodness of fit tests; neural network modeling
Unlock Deck
Unlock for access to all 101 flashcards in this deck.
Unlock Deck
k this deck
48
You want to add new features to data to which you applied a logistic regression model and got a training accuracy of X and a testing accuracy of Y. Which options are correct, if you consider the remaining parameters are the same?
A) Training accuracy increases and testing accuracy increases or remains the same.
B) Training accuracy increases or remains the same.
C) Testing accuracy decreases and training accuracy remains the same.
D) Testing accuracy increases or remains the same and training accuracy decreases.
A) Training accuracy increases and testing accuracy increases or remains the same.
B) Training accuracy increases or remains the same.
C) Testing accuracy decreases and training accuracy remains the same.
D) Testing accuracy increases or remains the same and training accuracy decreases.
Unlock Deck
Unlock for access to all 101 flashcards in this deck.
Unlock Deck
k this deck
49
What is the natural logarithm of the odds called?
A) The logit
B) The odds logarithm
C) The odds logit
D) The natural odds
A) The logit
B) The odds logarithm
C) The odds logit
D) The natural odds
Unlock Deck
Unlock for access to all 101 flashcards in this deck.
Unlock Deck
k this deck
50
In a neural network model, the ________ is a nonlinear function of the linear predictor values.
A) response variable
B) null variable
C) predictor variable
D) quantitative response variable
A) response variable
B) null variable
C) predictor variable
D) quantitative response variable
Unlock Deck
Unlock for access to all 101 flashcards in this deck.
Unlock Deck
k this deck
51
Which type of predictive analytic would be used to determine whether players on a football team, either historical or future, would perform successfully or unsuccessfully in a certain position on the field?
A) Linear discriminate
B) Logistic regression
C) Neural networks
D) Any of the choices could be used.
A) Linear discriminate
B) Logistic regression
C) Neural networks
D) Any of the choices could be used.
Unlock Deck
Unlock for access to all 101 flashcards in this deck.
Unlock Deck
k this deck
52
Consider the following model for logistic regression: P (y = 1|x, h) = g(h0 + h1x) where g(z) is the logistic function. In the preceding equation the P (y = 1|x; h) , viewed as a function of x, that we can get by changing the parameters h. What would be the range of P in such case?
A) (0, 1)
B) (0, infinity)
C) (−infinity, 0)
D) (−infinity, infinity)
A) (0, 1)
B) (0, infinity)
C) (−infinity, 0)
D) (−infinity, infinity)
Unlock Deck
Unlock for access to all 101 flashcards in this deck.
Unlock Deck
k this deck
53
In logistic regression, the difference between a fitted model and the saturated model can be measured with what test?
A) Deviance
B) Pearson
C) Hosmer-Lemeshow
D) All of the choices are correct.
A) Deviance
B) Pearson
C) Hosmer-Lemeshow
D) All of the choices are correct.
Unlock Deck
Unlock for access to all 101 flashcards in this deck.
Unlock Deck
k this deck
54
A logistic curve initially grows exponentially and
A) is theoretical.
B) is a summary of the probabilities.
C) is a consistent curve regardless of the data.
D) reflects the confidence intervals.
A) is theoretical.
B) is a summary of the probabilities.
C) is a consistent curve regardless of the data.
D) reflects the confidence intervals.
Unlock Deck
Unlock for access to all 101 flashcards in this deck.
Unlock Deck
k this deck
55
What are used to avoid overfitting in the neural network model, and are used to minimize a penalized least squares criterion?
A) Parameter estimates
B) Least squares estimates
C) Probability estimates
D) Any of the choice could be used.
A) Parameter estimates
B) Least squares estimates
C) Probability estimates
D) Any of the choice could be used.
Unlock Deck
Unlock for access to all 101 flashcards in this deck.
Unlock Deck
k this deck
56
The odds of an event occurring is: A. The probability that the event will occur divided by the probability that the event will not occur.
B. The probability that the event will not occur divided by the probability that the event will occur.
C. The probability that the event will occur divided by the total of the probability that it will occur, plus the probability of the event not occurring.
A) Option A
B) Option B
C) Option C
D) Either option A or B would create the same outcome.
Unlock Deck
Unlock for access to all 101 flashcards in this deck.
Unlock Deck
k this deck
57
A ________ consists of three layers: input, hidden, and output.
A) single-layer perceptron neural network model
B) double-layer perceptron neural network model
C) triple-layer perceptron neural network model
D) neural network model
A) single-layer perceptron neural network model
B) double-layer perceptron neural network model
C) triple-layer perceptron neural network model
D) neural network model
Unlock Deck
Unlock for access to all 101 flashcards in this deck.
Unlock Deck
k this deck
58
If the odds of a student passing a class are .25, what is the probability that the student will pass the class?
A) .20
B) .25
C) .75
D) .80
A) .20
B) .25
C) .75
D) .80
Unlock Deck
Unlock for access to all 101 flashcards in this deck.
Unlock Deck
k this deck
59
Parametric predictive analysis can be used to classify qualitative variables into several groups. The processes might include:
A) logistic regression.
B) simple regression.
C) vertical discriminate analysis.
D) stratification and clustering techniques.
A) logistic regression.
B) simple regression.
C) vertical discriminate analysis.
D) stratification and clustering techniques.
Unlock Deck
Unlock for access to all 101 flashcards in this deck.
Unlock Deck
k this deck
60
What is a major drawback of the neural network modeling?
A) The parameters are typically uninterpretable.
B) The model is not easily utilized with existing data sets.
C) The parameters minimize the least squares criterion.
D) This model only uses a single-layer perceptron.
A) The parameters are typically uninterpretable.
B) The model is not easily utilized with existing data sets.
C) The parameters minimize the least squares criterion.
D) This model only uses a single-layer perceptron.
Unlock Deck
Unlock for access to all 101 flashcards in this deck.
Unlock Deck
k this deck
61
Even if a residual may be unusually large, the standardized residual rule might not identify the observation as being an outlier. How can this difficulty be circumvented?
A) by using studentized deleted residuals
B) by performing a logistic regression
C) through linear discriminate analysis
D) It cannot be circumvented and should be considered a component of the validation process.
A) by using studentized deleted residuals
B) by performing a logistic regression
C) through linear discriminate analysis
D) It cannot be circumvented and should be considered a component of the validation process.
Unlock Deck
Unlock for access to all 101 flashcards in this deck.
Unlock Deck
k this deck
62
The chart provided shows the probability that a customer will use a coupon offered in a local paper by Lucky Shirts Store. Compute the odds ratio for the BankOne variable x2 = 1, holding annual spending constant at x1 = 4000. Annual Spending at Lucky Shirts Store
A) 1.3787
B) .4594
C) 1.4845
D) .3148
A) 1.3787
B) .4594
C) 1.4845
D) .3148
Unlock Deck
Unlock for access to all 101 flashcards in this deck.
Unlock Deck
k this deck
63
Below gives the data concerning (1) the dependent variable Default which equals 1 if a customer defaults on their loan and 0 if they do not; (2) the independent variable Price of Home, which is the price of the home (in tens) and (3) the independent variable First Purchase which equals 0 if the customer has owned a home before and 1 if this is their first home. Identify and interpret the odds ratio estimate for First Purchase.
A) Odds ratio: 10.8675; a first-time home buyer is 10 times less likely to default than a buyer who has bought a home before.
B) Odds ratio: 10.8675; a first-time home buyer is 11 times more likely to default than a buyer who has bought a home before.
C) Odds ratio: 10.8675; a first-time home buyer is 10% times more likely to default than a buyer who has bought a home before.
D) Odds ratio: 10.8675; a first-time home buyer is 11% times more likely to default than a buyer who has bought a home before.
Unlock Deck
Unlock for access to all 101 flashcards in this deck.
Unlock Deck
k this deck
64
Below gives the data concerning (1) the dependent variable Default which equals 1 if a customer defaults on their loan and 0 if they do not; (2) the independent variable Price of Home, which is the price of the home (in tens) and (3) the independent variable First Purchase which equals 1 if the customer has owned a home before and 0 if this is their first home. Estimate the probability that a buyer who spent $135,000 on their first home purchase will default.
A) .8529
B) .8501
C) .8674
D) .8754
A) .8529
B) .8501
C) .8674
D) .8754
Unlock Deck
Unlock for access to all 101 flashcards in this deck.
Unlock Deck
k this deck
65
Below gives the data concerning (1) the dependent variable Default which equals 1 if a customer defaults on their loan and 0 if they do not; (2) the independent variable Price of Home, which is the price of the home (in hundred tens) and (3) the independent variable First Purchase which equals 0 if the customer has owned a home before and 1 if this is their first home. Evaluate the significance of each independent variable in the model.
A) Intercept = −3.4592 significant, price of home = .70935 significant
B) Intercept = −3.492 not significant, first purchase of home = .70935 not significant
C) Price of home is significant p-value = .0201, first purchase is significant p-value = .0136
D) Price of home is significant p-value = .0136, first purchase is significant p-value = .201
Unlock Deck
Unlock for access to all 101 flashcards in this deck.
Unlock Deck
k this deck
66
Below gives the data concerning (1) the dependent variable Default which equals 1 if a customer defaults on their loan and 0 if they do not; (2) the independent variable Price of Home, which is the price of the home (in tens) and (3) the independent variable First Purchase which equals 1 if the customer has owned a home before and 0 if this is their first home. Estimate the probability that a buyer who spent $435,000 on their first home purchase will default.
A) .99636
B) .9899
C) .9768
D) .9695
A) .99636
B) .9899
C) .9768
D) .9695
Unlock Deck
Unlock for access to all 101 flashcards in this deck.
Unlock Deck
k this deck
67
Below gives the data concerning (1) the dependent variable Default which equals 1 if a customer defaults on their loan and 0 if they do not; (2) the independent variable Price of Home, which is the price of the home (in tens) and (3) the independent variable First Purchase which equals 0 if the customer has owned a home before and 1 if this is their first home. Identify and interpret the odds ratio estimate for Price of Home.
A) Odds ratio: 4.56789; for each addition $10 spent on a home, the odds of a person defaulting increased 4.56%
B) Odds ratio: 4.56789; for each addition $100 spent on a home, the odds of a person defaulting increased 4.56%
C) Odds ratio: 4.56789; for each addition $10 spent on a home, a default is 4 times more likely
D) Odds ratio: 4.56789; for each addition $1000 spent on a home, a default is 4 times less likely for each additional $1,000 spent
Unlock Deck
Unlock for access to all 101 flashcards in this deck.
Unlock Deck
k this deck
68
The chart provided shows the probability that a customer will use a coupon offered in a local paper by Lucky Shirts Store. Using this information, compute the odds that a customer will use the coupon, who spends $4,000 and does NOT bank at BankOne. Annual Spending at Lucky Shirts Store
A) .4594
B) .3148
C) 1.4845
D) .7742
A) .4594
B) .3148
C) 1.4845
D) .7742
Unlock Deck
Unlock for access to all 101 flashcards in this deck.
Unlock Deck
k this deck
69
Below gives the data concerning (1) the dependent variable Default which equals 1 if a customer defaults on their loan and 0 if they do not; (2) the independent variable Price of Home, which is the price of the home (in tens) and (3) the independent variable First Purchase which equals 0 if the customer has owned a home before and 1 if this is their first home. Interpret the confusion matrix.
A) The misclassification rate for defaulters is .08 and the misclassification for non-defaulters is .1290.
B) The misclassification rate for defaulters is .08 and the misclassification for non-defaulters is .1482.
C) The misclassification rate for defaulters is .1290 and the misclassification for non-defaulters is .1111.
D) The misclassification rate for defaulters is .1482 and the misclassification for non-defaulters is .0870.
Unlock Deck
Unlock for access to all 101 flashcards in this deck.
Unlock Deck
k this deck
70
What is a major drawback of neural network modeling?
A) The parameters are typically uninterpretable.
B) The parameters are typically interpretable.
C) The independent variables cannot be defined.
D) The level of significance is below .05, making the results invalid.
A) The parameters are typically uninterpretable.
B) The parameters are typically interpretable.
C) The independent variables cannot be defined.
D) The level of significance is below .05, making the results invalid.
Unlock Deck
Unlock for access to all 101 flashcards in this deck.
Unlock Deck
k this deck
71
Which predictive analytic technique would be best suited to an analysis of Facebook users, age 50-59, who purchase items on Amazon?
A) Neural network modeling due to the large data set with many observations.
B) Logistic regression, since the dependent variable is age.
C) Logistic regression, since the dependent variable is purchase items on Amazon, or does not purchase items on Amazon.
D) Either neural network modeling or logistic regression would work, depending on how close you want your p-value to .05.
Unlock Deck
Unlock for access to all 101 flashcards in this deck.
Unlock Deck
k this deck
72
Below gives the data concerning (1) the dependent variable Default which equals 1 if a customer defaults on their loan and 0 if they do not; (2) the independent variable Price of Home, which is the price of the home (in tens) and (3) the independent variable First Purchase which equals 0 if the customer has owned a home before and 1 if this is their first home. Estimate the probability that a buyer who spent $678,700 on their first home will default.
A) .9832
B) .99636
C) .9998
D) .9345
A) .9832
B) .99636
C) .9998
D) .9345
Unlock Deck
Unlock for access to all 101 flashcards in this deck.
Unlock Deck
k this deck
73
Below gives the data concerning (1) the dependent variable Default which equals 1 if a customer defaults on their loan and 0 if they do not; (2) the independent variable Price of Home, which is the price of the home (in hundred tens) and (3) the independent variable First Purchase which equals 0 if the customer has owned a home before and 1 if this is their first home. Identify the independent variables in this equation.
A) Price of Home and Default
B) Default
C) Price of Home, First Purchase, Default
D) Price of Home and First Purchase
A) Price of Home and Default
B) Default
C) Price of Home, First Purchase, Default
D) Price of Home and First Purchase
Unlock Deck
Unlock for access to all 101 flashcards in this deck.
Unlock Deck
k this deck
74
Neural networks have developed due to:
A) large amounts of data with huge numbers of observations.
B) increasingly unavailable data sets at reasonable costs for researchers.
C) work more effectively with data sets having fewer than 1000 observations.
D) have a clear and simple equation to use with very large data sets.
A) large amounts of data with huge numbers of observations.
B) increasingly unavailable data sets at reasonable costs for researchers.
C) work more effectively with data sets having fewer than 1000 observations.
D) have a clear and simple equation to use with very large data sets.
Unlock Deck
Unlock for access to all 101 flashcards in this deck.
Unlock Deck
k this deck
75
Your supervisor has asked you to analyze all of the sales receipts for your company for the entire year to determine the average sales per customer, depending on whether the customer used a credit card, or another form of payment. What would your dependent variable be in this case and how would you label it?
A) Credit card = 1, other payment method = 0
B) Average sales = 1 and credit card = 0
C) Credit card = 1, cash = 2, debit card = 0
D) We cannot determine which variable is dependent from the information provided.
A) Credit card = 1, other payment method = 0
B) Average sales = 1 and credit card = 0
C) Credit card = 1, cash = 2, debit card = 0
D) We cannot determine which variable is dependent from the information provided.
Unlock Deck
Unlock for access to all 101 flashcards in this deck.
Unlock Deck
k this deck
76
Below gives the data concerning (1) the dependent variable Default which equals 1 if a customer defaults on their loan and 0 if they do not; (2) the independent variable Price of Home, which is the price of the home (in tens) and (3) the independent variable First Purchase which equals 1 if the customer has owned a home before and 0 if this is their first home. Estimate the probability that a buyer who spent $535,600 on their fourth home purchase will default.
A) .5842
B) .5674
C) .9834
D) .9465
A) .5842
B) .5674
C) .9834
D) .9465
Unlock Deck
Unlock for access to all 101 flashcards in this deck.
Unlock Deck
k this deck
77
The number of dummy variables required if a categorical variable has k levels is:
A) k − 1
B) b.k
C) k + 1
D) !
A) k − 1
B) b.k
C) k + 1
D)
! Unlock Deck
Unlock for access to all 101 flashcards in this deck.
Unlock Deck
k this deck
78
A confusion matrix helps:
A) To give misclassification rates of the model
B) To assign p-values for independent variables in the model
C) Both "To give misclassification rates of the model" and "To assign p-values for independent variables in the model"
D) None of the choices are correct.
A) To give misclassification rates of the model
B) To assign p-values for independent variables in the model
C) Both "To give misclassification rates of the model" and "To assign p-values for independent variables in the model"
D) None of the choices are correct.
Unlock Deck
Unlock for access to all 101 flashcards in this deck.
Unlock Deck
k this deck
79
What is a method that can be used to minimize the penalized least squares criterion when using neural network modeling?
A) Fit the model 10-50 times using differing sets of randomly selected starter values to each fit.
B) Fit the model once with a predetermined starter value.
C) Use the set of parameters that yields the largest value of the penalized least squares.
D) Fit the model hundreds of times using differing sets of randomly selected starter values to each fit, to mimic using the entire population of data.
Unlock Deck
Unlock for access to all 101 flashcards in this deck.
Unlock Deck
k this deck
80
What is a positive attribute of linear discriminate analysis?
A) The model is interpretable and prediction is easy.
B) It can be used with a constant p-value less than .05, so significance is implied.
C) It can be used in place of logistic and simple regression techniques in most cases.
D) It used the cubed distance between predictor variables, creating validation of the data.
Unlock Deck
Unlock for access to all 101 flashcards in this deck.
Unlock Deck
k this deck
Unlock Deck
Unlock for access to all 101 flashcards in this deck.


