Deck 2: The Production Possibility Model, Trade and Globalization
Full screen (f)
Question
Question
Question
Below is a picture of a production possibilities curve that shows two products Professor Colander (your textbook author) might produce during any given day. 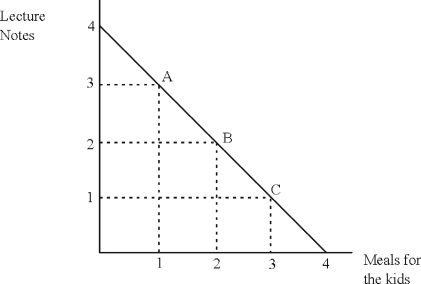 Does this PPC illustrate the principle of increasing marginal opportunity cost? Explain.
Does this PPC illustrate the principle of increasing marginal opportunity cost? Explain. Question
Question
Question
Question
Question
Question
Question
Below is the production possibilities table for the country of Lavaland. 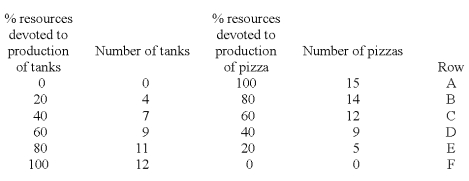 (a) Use the information in the table to draw the production possibilities curve (PPC) for Lavaland. Put tanks on the horizontal axis.
(b) What is the cost to Lavaland of moving from point A to point B on its PPC? And of moving from point E to point F?
(c) What general economic principle is being illustrated by your answers to part (b) above? Explain.
(a) Use the information in the table to draw the production possibilities curve (PPC) for Lavaland. Put tanks on the horizontal axis.(b) What is the cost to Lavaland of moving from point A to point B on its PPC? And of moving from point E to point F?
(c) What general economic principle is being illustrated by your answers to part (b) above? Explain.
Question
Question
Question
Question
Question
Question
Question
Question
Question
Question
The table below is a production possibility table for the fictional country of Myopia. Use it to construct the corresponding production possibility curve in the quadrant below. (Label the axes.) 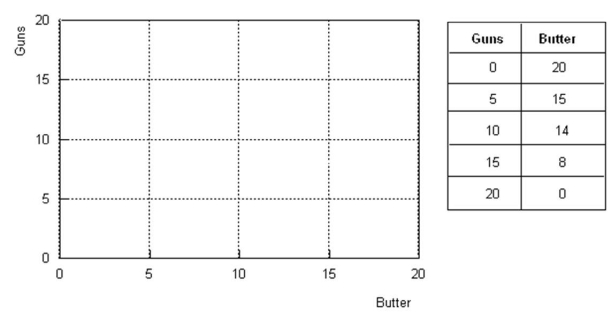 (a) Explain the meaning of a production possibilities curve.
(b) What is assumed to be constant when we draw that curve?
(c) How is a point on the curve different from (1) a point inside the curve or (2) a point outside the curve?
(d) How does this curve illustrate the concept of opportunity cost?
(e) How does it illustrate the principle of increasing marginal opportunity cost?
(a) Explain the meaning of a production possibilities curve.(b) What is assumed to be constant when we draw that curve?
(c) How is a point on the curve different from (1) a point inside the curve or (2) a point outside the curve?
(d) How does this curve illustrate the concept of opportunity cost?
(e) How does it illustrate the principle of increasing marginal opportunity cost?
Question
Question
The Bahamas and India produce both pineapple and rice (both measured in tons). The table below illustrates their production possibilities. 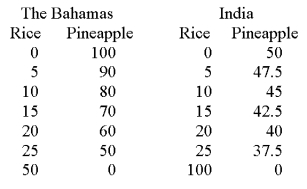 (a) In the Bahamas, what is the opportunity cost of a ton of pineapples, and of a ton of rice?
(b) In India, what is the opportunity cost of a ton of pineapple, and of a ton of rice?
(c) Which country has a comparative advantage in the production of pineapple?
(d) Show how if each country specialized in that good for which it has a comparative advantage and split the resulting production, each would be able to consume more than if they did not trade.
(a) In the Bahamas, what is the opportunity cost of a ton of pineapples, and of a ton of rice?(b) In India, what is the opportunity cost of a ton of pineapple, and of a ton of rice?
(c) Which country has a comparative advantage in the production of pineapple?
(d) Show how if each country specialized in that good for which it has a comparative advantage and split the resulting production, each would be able to consume more than if they did not trade.

Unlock Deck
Sign up to unlock the cards in this deck!
Unlock Deck
Unlock Deck
1/22
Play
Full screen (f)
Deck 2: The Production Possibility Model, Trade and Globalization
1
Consider a farmer's production possibilities curve, with corn measured on the vertical axis, and soybeans on the horizontal axis. Describe the impact of each of the following on the curve:
(a) The farmer buys or rents more land.
(b) A higher yielding variety of corn seed is developed.
(c) A hailstorm wipes out half of whatever crops the farmer has planted
(d) The government raises price supports for soybeans.
(a) The farmer buys or rents more land.
(b) A higher yielding variety of corn seed is developed.
(c) A hailstorm wipes out half of whatever crops the farmer has planted
(d) The government raises price supports for soybeans.
(a) The entire curve should shift out, since more land could presumably be used to grow either crop.
(b) The vertical intercept will shift up, as greater amounts of corn can now be grown, but the amount of potential soybean crop remains unchanged.
(c) The entire curve will shift in towards the origin, though not necessarily by one-half, since the farmer may be able to work the surviving crops more intensively and thus suffer a loss in output of less than 50 percent.
(d) No effect, since it has changed neither the amount of inputs available nor the technology. If one wishes to argue that the increased price supports change the existing institutions, namely they provide farmers with greater incentives to grow soybeans. Then the curve would shift further out along the horizontal axis, with no change in the vertical intercept.
2
What is the principle of increasing marginal opportunity cost?
The principle of increasing marginal opportunity cost states that in order to get more of something, one must give up ever-increasing quantities of something else.
3
Below is a picture of a production possibilities curve that shows two products Professor Colander (your textbook author) might produce during any given day. Does this PPC illustrate the principle of increasing marginal opportunity cost? Explain.
Does this PPC illustrate the principle of increasing marginal opportunity cost? Explain.This PPC does not illustrate the principle of increasing marginal opportunity cost. To see why not, think about moving along the PPC from points A to B and then from points B to C. For a movement from A to B, the opportunity cost of notes is 1 lecture. For a movement from B to C, the opportunity cost of notes is also 1 lecture. Thus this PPC illustrates a constant opportunity cost. This example demonstrates that the nature (or type) of opportunity cost is directly related to the shape of the PPC.
4
Why do marginal opportunity costs increase as you produce more of a specific good?
Unlock Deck
Unlock for access to all 22 flashcards in this deck.
Unlock Deck
k this deck
5
Assume that Belgium and Pakistan have linear production possibilities curves as shown in the graph below. Explain how they can both consume a combination of textiles and chocolate that lies outside their individual production possibility curves.
Unlock Deck
Unlock for access to all 22 flashcards in this deck.
Unlock Deck
k this deck
6
What is a production possibilities curve?
Unlock Deck
Unlock for access to all 22 flashcards in this deck.
Unlock Deck
k this deck
7
What is productive efficiency? Illustrate it with a production possibilities curve.
Unlock Deck
Unlock for access to all 22 flashcards in this deck.
Unlock Deck
k this deck
8
What does a production possibilities table demonstrate?
Unlock Deck
Unlock for access to all 22 flashcards in this deck.
Unlock Deck
k this deck
9
What two lessons can you learn from a production possibilities curve?
Unlock Deck
Unlock for access to all 22 flashcards in this deck.
Unlock Deck
k this deck
10
Below is the production possibilities table for the country of Lavaland. (a) Use the information in the table to draw the production possibilities curve (PPC) for Lavaland. Put tanks on the horizontal axis.
(b) What is the cost to Lavaland of moving from point A to point B on its PPC? And of moving from point E to point F?
(c) What general economic principle is being illustrated by your answers to part (b) above? Explain.
(a) Use the information in the table to draw the production possibilities curve (PPC) for Lavaland. Put tanks on the horizontal axis.(b) What is the cost to Lavaland of moving from point A to point B on its PPC? And of moving from point E to point F?
(c) What general economic principle is being illustrated by your answers to part (b) above? Explain.
Unlock Deck
Unlock for access to all 22 flashcards in this deck.
Unlock Deck
k this deck
11
What is the argument for laissez faire policy in the context of benefits from trade?
Unlock Deck
Unlock for access to all 22 flashcards in this deck.
Unlock Deck
k this deck
12
Can a country gain comparative advantage in some product? Can a country lose that advantage?
Unlock Deck
Unlock for access to all 22 flashcards in this deck.
Unlock Deck
k this deck
13
What does it mean when we say that a country has comparative advantage in a specific good?
Unlock Deck
Unlock for access to all 22 flashcards in this deck.
Unlock Deck
k this deck
14
In what way does the notion of comparative advantage help to explain that production possibility curves are bowed outward (the principle of increasing opportunity cost)? Explain your answer in the context of the tradeoff between guns and butter.
Unlock Deck
Unlock for access to all 22 flashcards in this deck.
Unlock Deck
k this deck
15
Most advanced nations have both agricultural sectors and armaments industries. They do not completely specialize in one industry or the other; but generally produce some of both commodities.
(a) State the principle of increasing marginal opportunity cost.
(b) Is this incomplete specialization consistent with the principle of increasing opportunity costs? Explain your answer in the context of the tradeoff between guns and butter.
(a) State the principle of increasing marginal opportunity cost.
(b) Is this incomplete specialization consistent with the principle of increasing opportunity costs? Explain your answer in the context of the tradeoff between guns and butter.
Unlock Deck
Unlock for access to all 22 flashcards in this deck.
Unlock Deck
k this deck
16
Draw a production possibilities curve that indicates how you might divide up 10 hours of study time between your economics and accounting midterm exams. Put expected grade in economics on the horizontal axis and expected grade in accounting on the vertical axis. If you don't study at all, you expect to make a 70 on both exams. For every one additional hour of studying economics, your exam grade rises by 3 points. The same is true for accounting.
a. What is the opportunity cost of studying one extra hour for your economics exam?
b. What is the opportunity cost of studying one extra hour for your accounting exam?
c. Can the production possibility curve shift? Explain.
a. What is the opportunity cost of studying one extra hour for your economics exam?
b. What is the opportunity cost of studying one extra hour for your accounting exam?
c. Can the production possibility curve shift? Explain.
Unlock Deck
Unlock for access to all 22 flashcards in this deck.
Unlock Deck
k this deck
17
What is the "law of one price"? Explain how outsourcing is part of a global process guided by the law of one price.
Unlock Deck
Unlock for access to all 22 flashcards in this deck.
Unlock Deck
k this deck
18
Does the production possibilities curve tell us if goods are distributed efficiently in a society? Explain.
Unlock Deck
Unlock for access to all 22 flashcards in this deck.
Unlock Deck
k this deck
19
Under what assumption(s) is the production possibilities curve a representation of efficiency points?
Unlock Deck
Unlock for access to all 22 flashcards in this deck.
Unlock Deck
k this deck
20
The table below is a production possibility table for the fictional country of Myopia. Use it to construct the corresponding production possibility curve in the quadrant below. (Label the axes.) (a) Explain the meaning of a production possibilities curve.
(b) What is assumed to be constant when we draw that curve?
(c) How is a point on the curve different from (1) a point inside the curve or (2) a point outside the curve?
(d) How does this curve illustrate the concept of opportunity cost?
(e) How does it illustrate the principle of increasing marginal opportunity cost?
(a) Explain the meaning of a production possibilities curve.(b) What is assumed to be constant when we draw that curve?
(c) How is a point on the curve different from (1) a point inside the curve or (2) a point outside the curve?
(d) How does this curve illustrate the concept of opportunity cost?
(e) How does it illustrate the principle of increasing marginal opportunity cost?
Unlock Deck
Unlock for access to all 22 flashcards in this deck.
Unlock Deck
k this deck
21
Using production possibilities curves, demonstrate increasing marginal opportunity cost and constant marginal opportunity cost.
Unlock Deck
Unlock for access to all 22 flashcards in this deck.
Unlock Deck
k this deck
22
The Bahamas and India produce both pineapple and rice (both measured in tons). The table below illustrates their production possibilities. (a) In the Bahamas, what is the opportunity cost of a ton of pineapples, and of a ton of rice?
(b) In India, what is the opportunity cost of a ton of pineapple, and of a ton of rice?
(c) Which country has a comparative advantage in the production of pineapple?
(d) Show how if each country specialized in that good for which it has a comparative advantage and split the resulting production, each would be able to consume more than if they did not trade.
(a) In the Bahamas, what is the opportunity cost of a ton of pineapples, and of a ton of rice?(b) In India, what is the opportunity cost of a ton of pineapple, and of a ton of rice?
(c) Which country has a comparative advantage in the production of pineapple?
(d) Show how if each country specialized in that good for which it has a comparative advantage and split the resulting production, each would be able to consume more than if they did not trade.
Unlock Deck
Unlock for access to all 22 flashcards in this deck.
Unlock Deck
k this deck
Unlock Deck
Unlock for access to all 22 flashcards in this deck.


