Deck 10: Patterns in Species Richness
Full screen (f)
Question
Question
In Figure 10.14b,which of the following statements is accurate? 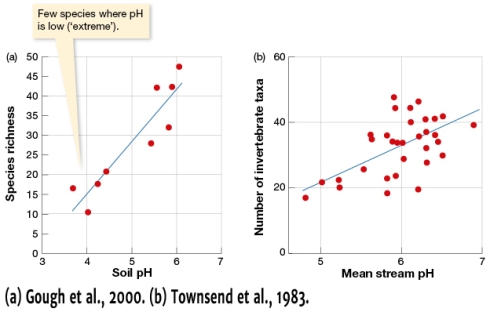
A) Between pH 5 to 7, the number of invertebrate taxa is positively associated with mean stream pH .
B) Between pH 5 to 7, the number of invertebrate taxa is negatively associated with mean stream pH.
C) Number of invertebrate taxa is not associated with mean stream pH.
D) Species richness is greatest at the lowest mean stream pH.
Question
Question
Question
Question
Question
Question
Question
Question
Question
Question
Question
Question
Question
Question
Question
Question
Question
Question
Question
Question
Question
Question
Question
Question
Question
Question
Question
Question
Question
Question
Question
Question
Question
Question
Question
Question
Question
Question
Question
Question
Question
Question
Question
Question
Question
Question
Question
Question

Unlock Deck
Sign up to unlock the cards in this deck!
Unlock Deck
Unlock Deck
1/50
Play
Full screen (f)
Deck 10: Patterns in Species Richness
1
Which of the following explains what species richness is?
A) Species richness is the number of species in a community and how evenly they are distributed amongst other species.
B) Species richness is the number of species in a community.
C) Species richness is the number of resources each species has in a community.
D) Species richness is the number of endangered species in a community.
B
2
In Figure 10.14b,which of the following statements is accurate?
A) Between pH 5 to 7, the number of invertebrate taxa is positively associated with mean stream pH .
B) Between pH 5 to 7, the number of invertebrate taxa is negatively associated with mean stream pH.
C) Number of invertebrate taxa is not associated with mean stream pH.
D) Species richness is greatest at the lowest mean stream pH.
A
3
Which of the following choices is a term that refers to diversity between communities?
A) Alpha diversity
B) Beta diversity
C) Kappa diversity
D) Gamma diversity
A) Alpha diversity
B) Beta diversity
C) Kappa diversity
D) Gamma diversity
B
4
You are interested in comparing diversity between two different regions each with many communities.Which term would you use to describe this?
A) Beta diversity
B) Gamma diversity
C) Kappa diversity
D) Alpha diversity
A) Beta diversity
B) Gamma diversity
C) Kappa diversity
D) Alpha diversity
Unlock Deck
Unlock for access to all 50 flashcards in this deck.
Unlock Deck
k this deck
5
Assume that resources for a community of species are available on a continuum.A common species of bird utilizes a particular portion of this continuum.What term defines the length of the portion of resources that this bird uses?
A) Module
B) Niche breadth
C) H
D) Pi
A) Module
B) Niche breadth
C) H
D) Pi
Unlock Deck
Unlock for access to all 50 flashcards in this deck.
Unlock Deck
k this deck
6
An organism has been discovered that appears to forego metabolizing phosphorous to instead metabolize arsenic.Phosphorous is essential to all living things.Why might this organism have evolved a way to metabolize arsenic in place of phosphorous?
A) Because they differentiated and randomly mutated a way to exploit a resource all other organisms were not consuming.
B) The organism experienced a bottleneck event.
C) The organism evolved in a harsh environment that selected for this biochemical mechanism.
D) It is a morphological trait that protects it from predators since many organisms will die if they eat arsenic.
Unlock Deck
Unlock for access to all 50 flashcards in this deck.
Unlock Deck
k this deck
7
You are assigned the task of determining species richness in a given area.The lead researcher has told you that the number of samples you have to take is not limited.As you collect data,what pattern should you expect to see?
A) All the species in this space will be identified by a time period that is related to the number of search hours divided by the area
B) As you collect data, species richness will decrease
C) The most common species in this space will likely be identified first, followed by more rare species.
D) All the species in this space will be identified by a time period that is related to the product of the square root of number of search and total area.
Unlock Deck
Unlock for access to all 50 flashcards in this deck.
Unlock Deck
k this deck
8
Using a simple model of species richness based on a one dimensional continuum,what is one hypothetical way that species richness could increase?
A) Each species overlaps less with its neighbors.
B) The range of resource in the community expands.
C) If each species is less specialized.
D) The complexity of community is low.
A) Each species overlaps less with its neighbors.
B) The range of resource in the community expands.
C) If each species is less specialized.
D) The complexity of community is low.
Unlock Deck
Unlock for access to all 50 flashcards in this deck.
Unlock Deck
k this deck
9
Species richness can be influenced by climatic factors that vary spatially.One hypothesis explains how environmental temperature may affect a community of organisms.Which hypothesis is this?
A) The productivity hypothesis
B) The growth differentiation balance hypothesis
C) The intermediate disturbance hypothesis
D) The energy hypothesis
A) The productivity hypothesis
B) The growth differentiation balance hypothesis
C) The intermediate disturbance hypothesis
D) The energy hypothesis
Unlock Deck
Unlock for access to all 50 flashcards in this deck.
Unlock Deck
k this deck
10
Which of the following is a measure of atmospheric energy?
A) Plant respiration
B) Gamma diversity
C) Potential evapotranspiration
D) Solar plexus
A) Plant respiration
B) Gamma diversity
C) Potential evapotranspiration
D) Solar plexus
Unlock Deck
Unlock for access to all 50 flashcards in this deck.
Unlock Deck
k this deck
11
You have assessed species richness in the tropics using 15 plots,each approximately 10 km by 10 km,spread over an entire region.Let us assume each plot is a community.Which of the following statements is likely correct?
A) Productivity is high in the tropics. The alpha diversity of the 15 tropic plots should be low.
B) Productivity is high in the tropics. The alpha diversity of the 15 tropic plots will be the same as the gamma diversity.
C) Productivity is low in the tropics. The alpha diversity of the 15 tropic plots will be the same as the gamma diversity
D) Productivity is high in the tropics. The alpha diversity of each of the 15 plots should be high.
Unlock Deck
Unlock for access to all 50 flashcards in this deck.
Unlock Deck
k this deck
12
If a phylogenetic analysis shows that an assemblage of species is closely related,but only one of the species has evolved drastically different morphology that is known to be extremely costly,then why might this one species have evolved such a distinct trait?
A) This organism mutated and differentiated quickly due to density-dependent selection.
B) This organism likely speciated and evolved in a community where predator mediated coexistence was favored.
C) Evolution is a mystery. Who knows?
D) This organism likely evolved in a much more harsh environment.
Unlock Deck
Unlock for access to all 50 flashcards in this deck.
Unlock Deck
k this deck
13
Experiments performed in the rocky intertidal zone by Robert Paine showed that the experimental removal of a predator had dramatic consequences to the structure of the community.What was the ultimate conclusion of this study?
A) That predators can prey so heavily that they eventually reduce species richness to nearly zero. As a result species richness is reduced.
B) That prey need spatial and temporal fluctuations to coexist, otherwise the community structure will collapse. When fluctuations do not occur, then species richness is significantly reduced.
C) That predators have no impact on the structure of lower trophic levels.
D) That predators can mediate coexistence by reducing the number of individuals of a species in the community that tend to dominate and as a result increase species richness more than if they were not present.
Unlock Deck
Unlock for access to all 50 flashcards in this deck.
Unlock Deck
k this deck
14
You are comparing species richness across 10 square meter plots over an entire region of Indiana.Your data show that individual communities are not diverse and that the communities in the region do not differ.Of the following choices,which is the best conclusion?
A) The beta diversity is extremely high
B) The alpha diversity is extremely high
C) You cannot conclude anything from these data
D) The gamma diversity is extremely low
A) The beta diversity is extremely high
B) The alpha diversity is extremely high
C) You cannot conclude anything from these data
D) The gamma diversity is extremely low
Unlock Deck
Unlock for access to all 50 flashcards in this deck.
Unlock Deck
k this deck
15
If you wanted to provide the most data for an audience about the species composition of a community and how it changes over time,which of the following would you use and why?
A) Use species richness because it shows the audience one how many species are present in a community.
B) Use a diversity index because it shows the audience the species present and how common or rare those species are in that community.
C) Use niche breadth because it shows the audience how many niches are in use in a community and the number of species using them.
D) Use a rank-abundance diagram because it shows the audience about relative abundances, changes to relative abundances, number of species, and how the number of species changes over time.
Unlock Deck
Unlock for access to all 50 flashcards in this deck.
Unlock Deck
k this deck
16
In which of the two examples of a community is species richness greater: A community with 100 species that can all be found equally within a 25 km radius of the area,or a community spread across the same area that has 100 species,in which 5% of the individuals are rare species.
A) The community where species can be found equally.
B) The species richness is the same.
C) The community where species are not found equally.
D) There is not enough information to answer this question.
A) The community where species can be found equally.
B) The species richness is the same.
C) The community where species are not found equally.
D) There is not enough information to answer this question.
Unlock Deck
Unlock for access to all 50 flashcards in this deck.
Unlock Deck
k this deck
17
Deep sea communities of gastropods and bivalve mollusk species rely on which of the following as a resource?
A) Particulate organic carbon
B) Ultraviolet radiation
C) Photosynthetic plants for habitat and coverage
D) None of the above
A) Particulate organic carbon
B) Ultraviolet radiation
C) Photosynthetic plants for habitat and coverage
D) None of the above
Unlock Deck
Unlock for access to all 50 flashcards in this deck.
Unlock Deck
k this deck
18
You have counted the number of amphibians and reptiles in the same experimental 1 km by 1 km area over the last five years.You also have a control plot of the same size nearby that is part of your sampling each year.Every year you have reviewed your data to understand which species were common or rare,and whether equal numbers of individuals were counted in those categories.What your data show is that in the experimental plot more species become rare to encounter and a large percentage of species that you do encounter tends to be more common from year one to year five.However,this is not the case in the control plot,which shows no change from year one to year five.You now plan to plot these data for a presentation.You now plan to plot these data for a presentation.What will a graph of rank-abundance for the control and non-control plots look like?
A) It will show species rank on the x axis and relative abundance on the y axis. The trend lines for each will be flat.
B) The graph will show a flat trend line for the control plot and a steep trend line for the non-control plot.
C) There are not enough data to determine what the graph will look like.
D) The graph will show a very steep line in the experimental plot by the end of year five and a much less steep line for the control plot for all five years.
Unlock Deck
Unlock for access to all 50 flashcards in this deck.
Unlock Deck
k this deck
19
What is one way to define a harsh environment?
A) An environment that humans cannot survive
B) An environment where many organisms once occupied
C) An environment that is dominated by an extreme abiotic factor
D) None of the above.
A) An environment that humans cannot survive
B) An environment where many organisms once occupied
C) An environment that is dominated by an extreme abiotic factor
D) None of the above.
Unlock Deck
Unlock for access to all 50 flashcards in this deck.
Unlock Deck
k this deck
20
You have counted the number of amphibians and reptiles in the same experimental 1 km by 1 km area over the last five years.You also have a control plot of the same size nearby that is part of your sampling each year.Every year you have reviewed your data to understand which species were common or rare,and whether equal numbers of individuals were counted in those categories.What your data show is that in the experimental plot more species become rare to encounter and a large percentage of species that you do encounter tends to be more common from year one to year five.However,this is not the case in the control plot,which shows no change from year one to year five.You now plan to plot these data for a presentation.What will your diversity indices look like?
A) The graphs will show that species diversity (H) is negatively associated with time in the control plot and positively associated with time in the 1 x 1 km plot.
B) You cannot graph these data.
C) The graphs will show that species diversity (H) is not affected by time in the control plot and negatively associated with time in the experimental plot.
D) Species rank will be on the x axis and species diversity will be on the y axis. The two lines will be parallel.
Unlock Deck
Unlock for access to all 50 flashcards in this deck.
Unlock Deck
k this deck
21
In some tropical mountains,ecologists have noticed bird species diversity declining in recent years despite seeing normally low elevation species beginning to appear in higher elevations.They blame climate change and increasing temperatures.What might be going on?
A) As temperatures increase, upper elevation conditions become increasingly favorable to lower elevation species.
B) Increasing temperatures at high elevations are driving high elevation species lower to seek cooler temperatures.
C) Lower elevation species are moving up the mountain and out competing the species traditionally found there.
D) As temperatures decrease, upper elevation conditions become increasingly favorable to lower elevation species.
Unlock Deck
Unlock for access to all 50 flashcards in this deck.
Unlock Deck
k this deck
22
According to the predictions that make up the theory of island biogeography,how long does it take for species to reach equilibrium?
A) The time to reach equilibrium is determined by the number of colonizers.
B) The time to reach equilibrium is determined by the product of number of species and island area.
C) There is no set time for an island to reach equilibrium.
D) An island will always reach equilibrium within the first 30 days.
Unlock Deck
Unlock for access to all 50 flashcards in this deck.
Unlock Deck
k this deck
23
The intermediate disturbance hypothesis was originally proposed to account for patterns of species richness where?
A) In lakes and streams
B) In desserts and prairies
C) In tropical rain forests and coral reefs
D) In tropical rain forests and jungles
A) In lakes and streams
B) In desserts and prairies
C) In tropical rain forests and coral reefs
D) In tropical rain forests and jungles
Unlock Deck
Unlock for access to all 50 flashcards in this deck.
Unlock Deck
k this deck
24
Vascular plants:
A) Can have a hump shaped relationship between species richness and productivity.
B) Usually have a U shaped relationship between species richness and productivity
C) Sometimes have no relationship between species richness and productivity.
D) Show several different relationships between species richness and productivity.
Unlock Deck
Unlock for access to all 50 flashcards in this deck.
Unlock Deck
k this deck
25
The explanation(s)for the trend in greater species richness near the tropics than near the poles is:
A) Variation in energy input.
B) Greater evolutionary age of the tropics.
C) Decrease in habitat fragmentation.
D) Increase in trade winds.
A) Variation in energy input.
B) Greater evolutionary age of the tropics.
C) Decrease in habitat fragmentation.
D) Increase in trade winds.
Unlock Deck
Unlock for access to all 50 flashcards in this deck.
Unlock Deck
k this deck
26
Which scientists are credited with the theory of island biogeography?
A) Edward O. Wilson
B) Charles Darwin
C) Robert H. MacArthur
D) Sewall G. Wright
A) Edward O. Wilson
B) Charles Darwin
C) Robert H. MacArthur
D) Sewall G. Wright
Unlock Deck
Unlock for access to all 50 flashcards in this deck.
Unlock Deck
k this deck
27
When looking at a simple model of species richness based on a single resource,species richness may be determined by?
A) The range of available resource.
B) The level of specialization of each species on the resource.
C) The level of overlap of the usage of the resource by each species.
D) The level of interspecific competition.
A) The range of available resource.
B) The level of specialization of each species on the resource.
C) The level of overlap of the usage of the resource by each species.
D) The level of interspecific competition.
Unlock Deck
Unlock for access to all 50 flashcards in this deck.
Unlock Deck
k this deck
28
Diversity indices take into account
A) Species competitive abilities.
B) Species richness.
C) Available energy.
D) Evenness of species.
A) Species competitive abilities.
B) Species richness.
C) Available energy.
D) Evenness of species.
Unlock Deck
Unlock for access to all 50 flashcards in this deck.
Unlock Deck
k this deck
29
Under which scenario would the predicted number of resident species immigrating to an island be at the lowest according to the theory of island biogeography?
A) An island that is 300 km from mainland
B) An island that is 3 km from the mainland
C) An island that is 30 km from the mainland
D) An island that is 3 m from the mainland
A) An island that is 300 km from mainland
B) An island that is 3 km from the mainland
C) An island that is 30 km from the mainland
D) An island that is 3 m from the mainland
Unlock Deck
Unlock for access to all 50 flashcards in this deck.
Unlock Deck
k this deck
30
You would expect to see the greatest species richness in reptiles at:
A) 10 degrees North latitude.
B) 70 degrees South latitude.
C) 10 degrees South latitude.
D) 70 degrees North latitude.
A) 10 degrees North latitude.
B) 70 degrees South latitude.
C) 10 degrees South latitude.
D) 70 degrees North latitude.
Unlock Deck
Unlock for access to all 50 flashcards in this deck.
Unlock Deck
k this deck
31
Where mean annual temperatures are highest in China you see this level of vertebrate species richness compared to the rest of the country _______.
A) Lowest.
B) Highest.
C) Intermediate.
A) Lowest.
B) Highest.
C) Intermediate.
Unlock Deck
Unlock for access to all 50 flashcards in this deck.
Unlock Deck
k this deck
32
According to the theory of island biogeography,how would the number of species found on a small island far from mainland compare to a larger island or a similar sized island that is closer to mainland?
A) The number of species will be directly proportional to the size of the island and the number of colonizers that inhabit the island in the first 90 days.
B) The theory of island biogeography makes no predictions about a relationship between number of species and size of island or its distance from mainland.
C) The turnover rate will be positively associated with time to first colonization event, distance from mainland, number of competitors, and area of the island.
D) The number of species will be less than a larger island and any similar sized island that is closer to the mainland.
Unlock Deck
Unlock for access to all 50 flashcards in this deck.
Unlock Deck
k this deck
33
The number of species in a lake 300 m in diameter is greater than the number of species in a lake 150 m in diameter.Additionally,a lake that is 50 m in diameter has the least number of species of the three lakes.What term describes this relationship?
A) It is a quadratic relationship
B) It is a density-dependent relationship
C) It is a frequency-dependent relationship
D) It is a species-area relationship
A) It is a quadratic relationship
B) It is a density-dependent relationship
C) It is a frequency-dependent relationship
D) It is a species-area relationship
Unlock Deck
Unlock for access to all 50 flashcards in this deck.
Unlock Deck
k this deck
34
Which of the following would be considered an island where species diversity would be limited by area?
A) A lake
B) An island in the Pacific ocean
C) A gap of forest cleared
D) Soil that has much less phosphorous and nitrogen than the soil surrounding it
A) A lake
B) An island in the Pacific ocean
C) A gap of forest cleared
D) Soil that has much less phosphorous and nitrogen than the soil surrounding it
Unlock Deck
Unlock for access to all 50 flashcards in this deck.
Unlock Deck
k this deck
35
What is the relationship between number of island species and island area?
A) As island area increases the number of island species decreases because of increased interspecific competition.
B) There is a positive relationship between number of species and area of an island.
C) There is a negative relationship between number of species and area of an island.
D) There actually is no relationship between the number of island species and island area.
Unlock Deck
Unlock for access to all 50 flashcards in this deck.
Unlock Deck
k this deck
36
Are the results of research by Joseph Connell,which led him to develop the intermediate disturbance hypothesis,universal in the sense that the greatest amounts of species richness are always at intermediate frequencies of disturbance?
A) Yes, this is a universal rule and there are no biomes where species richness peaks occur at low or high frequencies of disturbance.
B) No, this is not a universal rule and it cannot be demonstrated that it applies to any other communities.
C) Yes, this is a law in ecology that has allowed researchers to understand that reality is not so complex and that disturbance is the preeminent abiotic force structuring communities.
D) No, this is not a universal rule because in some communities diversity will peak at intermediate frequencies of disturbance, but this is not the case in all communities.
Unlock Deck
Unlock for access to all 50 flashcards in this deck.
Unlock Deck
k this deck
37
Species richness of fish in lakes:
A) May be related to primary productivity.
B) May be connected to phytoplankton.
C) Is usually highest at shallow depths than intermediate depths.
D) Is usually highest at the bottom of the lake.
A) May be related to primary productivity.
B) May be connected to phytoplankton.
C) Is usually highest at shallow depths than intermediate depths.
D) Is usually highest at the bottom of the lake.
Unlock Deck
Unlock for access to all 50 flashcards in this deck.
Unlock Deck
k this deck
38
What term characterizes the equilibrium point for species richness of an island?
A) R
B) H
C) S*
D) N
A) R
B) H
C) S*
D) N
Unlock Deck
Unlock for access to all 50 flashcards in this deck.
Unlock Deck
k this deck
39
You are fishing in a large lake.You are not after any particular species you just want to catch fish.You would choose a fishing lure that:
A) Dives to the bottom of the lake.
B) Stays at the surface of the lake.
C) Goes to intermediate lake depths.
D) Goes to a depth where the lure would still be illuminated and thus visible to fish.
A) Dives to the bottom of the lake.
B) Stays at the surface of the lake.
C) Goes to intermediate lake depths.
D) Goes to a depth where the lure would still be illuminated and thus visible to fish.
Unlock Deck
Unlock for access to all 50 flashcards in this deck.
Unlock Deck
k this deck
40
According to Joseph Connell's theory regarding disturbance,when would communities be expected to contain the most species?
A) When the frequency of disturbance is at the lowest levels.
B) When the frequency of disturbance is at intermediate levels.
C) When the frequency of disturbance is at highest levels.
D) When there is no disturbance.
A) When the frequency of disturbance is at the lowest levels.
B) When the frequency of disturbance is at intermediate levels.
C) When the frequency of disturbance is at highest levels.
D) When there is no disturbance.
Unlock Deck
Unlock for access to all 50 flashcards in this deck.
Unlock Deck
k this deck
41
When there is high diversity within a community it is referred to as _______ diversity.
A) Beta
B) Alpha
C) Productivity based
D) Gamma
A) Beta
B) Alpha
C) Productivity based
D) Gamma
Unlock Deck
Unlock for access to all 50 flashcards in this deck.
Unlock Deck
k this deck
42
For the most part,meadows in Europe are not very species rich because artificial additions of nutrients have allowed some species to ____________.
A) Alter microhabitats for other species.
B) Competitively exclude other species
C) Prey on other species.
D) Parasitize other species.
A) Alter microhabitats for other species.
B) Competitively exclude other species
C) Prey on other species.
D) Parasitize other species.
Unlock Deck
Unlock for access to all 50 flashcards in this deck.
Unlock Deck
k this deck
43
Medium sized intertidal boulders are tumbled about by waves less than small boulders but more than large boulders.They also show the greatest diversity of intertidal invertebrates inhabiting them compared to small and large boulders.This illustrates the ____________________________ hypothesis.
A) Cascade effect.
B) Predator mediated coexistence.
C) Niche width
D) Intermediate disturbance
A) Cascade effect.
B) Predator mediated coexistence.
C) Niche width
D) Intermediate disturbance
Unlock Deck
Unlock for access to all 50 flashcards in this deck.
Unlock Deck
k this deck
44
The fact that there are more species of beetles in Florida than there are in Canada supports the concept of ______________?
A) Latitudinal gradients.
B) Altitudinal gradients.
C) Community succession.
D) Niche breadth.
A) Latitudinal gradients.
B) Altitudinal gradients.
C) Community succession.
D) Niche breadth.
Unlock Deck
Unlock for access to all 50 flashcards in this deck.
Unlock Deck
k this deck
45
Functionally predation can act on a community to increase diversity.This affect on communities is similar to what we have seen with intermediate _____________.
A) Competition
B) Parasitism
C) Resources
D) Disturbances
A) Competition
B) Parasitism
C) Resources
D) Disturbances
Unlock Deck
Unlock for access to all 50 flashcards in this deck.
Unlock Deck
k this deck
46
In theory,the number of plant species _____________ as the size of islands increases.
A) Increases.
B) Stays the same.
C) Decreases.
D) Fluctuates.
A) Increases.
B) Stays the same.
C) Decreases.
D) Fluctuates.
Unlock Deck
Unlock for access to all 50 flashcards in this deck.
Unlock Deck
k this deck
47
It would be most difficult for a species to invade a community where the resource utilization of current resident species ________________.
A) Does not overlap.
B) Overlaps.
A) Does not overlap.
B) Overlaps.
Unlock Deck
Unlock for access to all 50 flashcards in this deck.
Unlock Deck
k this deck
48
The classic study demonstrating that the Pisaster sea star promoted predator-mediated coexistence was conducted by _________?
A) Robert Paine
B) Joseph Connell
C) Jared Diamond
D) David Tilman
A) Robert Paine
B) Joseph Connell
C) Jared Diamond
D) David Tilman
Unlock Deck
Unlock for access to all 50 flashcards in this deck.
Unlock Deck
k this deck
49
As vegetation productivity goes up in China,vertebrate richness _______.
A) Increases.
B) Decreases.
C) Remains the same.
A) Increases.
B) Decreases.
C) Remains the same.
Unlock Deck
Unlock for access to all 50 flashcards in this deck.
Unlock Deck
k this deck
50
Wildfires in Southern California occur much more frequently today than they did hundreds of years ago.This is thought to be decreasing local plant diversity.The theory that might best support this observation is ____________.
A) Island biogeography.
B) Intermediate disturbance.
C) Trophic cascade.
D) Exploiter-mediated.
A) Island biogeography.
B) Intermediate disturbance.
C) Trophic cascade.
D) Exploiter-mediated.
Unlock Deck
Unlock for access to all 50 flashcards in this deck.
Unlock Deck
k this deck
Unlock Deck
Unlock for access to all 50 flashcards in this deck.


