Deck 18: Who Gets What the Distribution of Income
Full screen (f)
Question
Question
Question
Question
Question
Question
Question
Question
Question
Question
Question
Question
Question
Question
Question
Question
Question
Question
Question
Question
Question
Question
Refer to the graph shown. 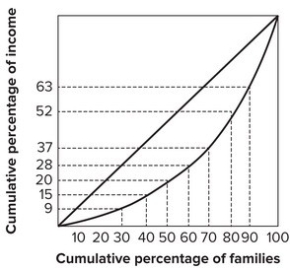 The richest 10 percent of the families earn:
A)37 percent of the income.
B)48 percent of the income.
C)52 percent of the income.
D)63 percent of the income.
The richest 10 percent of the families earn:A)37 percent of the income.
B)48 percent of the income.
C)52 percent of the income.
D)63 percent of the income.
Question
Which of the following statements contradicts the evidence shown in the graph shown? 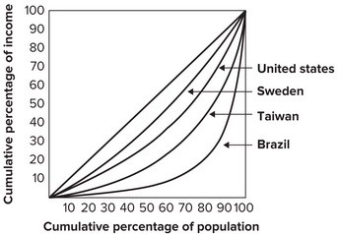
A)Income is more equally distributed in Sweden than it is in Brazil.
B)Income is more equally distributed in Taiwan than it is in the United States.
C)Income is more equally distributed in Sweden than it is in Taiwan.
D)Income is more equally distributed in the United States than it is in Brazil.
A)Income is more equally distributed in Sweden than it is in Brazil.
B)Income is more equally distributed in Taiwan than it is in the United States.
C)Income is more equally distributed in Sweden than it is in Taiwan.
D)Income is more equally distributed in the United States than it is in Brazil.
Question
Refer to the graph shown.  The poorest 30 percent of the families earn:
A)2 percent of the income.
B)5 percent of the income.
C)9 percent of the income.
D)15 percent of the income.
The poorest 30 percent of the families earn:A)2 percent of the income.
B)5 percent of the income.
C)9 percent of the income.
D)15 percent of the income.
Question
Question
Question
Refer to the graph shown.  The poorest 50 percent of the families earn:
A)6 percent of the income.
B)19 percent of the income.
C)36 percent of the income.
D)64 percent of the income.
The poorest 50 percent of the families earn:A)6 percent of the income.
B)19 percent of the income.
C)36 percent of the income.
D)64 percent of the income.
Question
Refer to the graph shown. 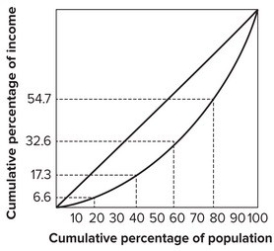 The bottom 20 percent of the families earn:
A)6.6 percent of the income.
B)17.3 percent of the income.
C)10.7 percent of the income.
D)20 percent of the income.
The bottom 20 percent of the families earn:A)6.6 percent of the income.
B)17.3 percent of the income.
C)10.7 percent of the income.
D)20 percent of the income.
Question
Question
Refer to the graph shown.  The 25 percent of the families with the highest income earn:
A)6 percent of the income.
B)19 percent of the income.
C)36 percent of the income.
D)64 percent of the income.
The 25 percent of the families with the highest income earn:A)6 percent of the income.
B)19 percent of the income.
C)36 percent of the income.
D)64 percent of the income.
Question
Refer to the graph shown. 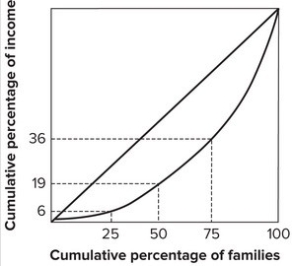 The poorest 25 percent of the families earn:
A)6 percent of the income.
B)19 percent of the income.
C)36 percent of the income.
D)64 percent of the income.
The poorest 25 percent of the families earn:A)6 percent of the income.
B)19 percent of the income.
C)36 percent of the income.
D)64 percent of the income.
Question
Refer to the graph shown.  The Lorenz curve showing the most income inequality is
A)A.
B)B.
C)C.
D)D.
The Lorenz curve showing the most income inequality isA)A.
B)B.
C)C.
D)D.
Question
Question
Refer to the graph shown. 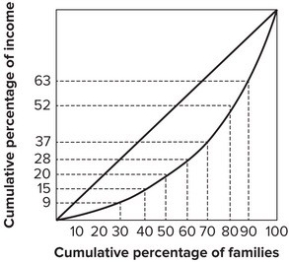 The fourth quintile (a quintile is a fifth)of the families earn:
A)52 percent of the income.
B)28 percent of the income.
C)24 percent of the income.
D)20 percent of the income.
The fourth quintile (a quintile is a fifth)of the families earn:A)52 percent of the income.
B)28 percent of the income.
C)24 percent of the income.
D)20 percent of the income.
Question
Question
Refer to the graph shown. 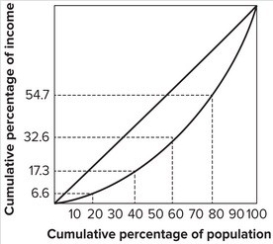 The middle quintile (the middle fifth)of families earn:
A)10.7 percent of the income.
B)15.3 percent of the income.
C)22.1 percent of the income.
D)32.6 percent of the income.
The middle quintile (the middle fifth)of families earn:A)10.7 percent of the income.
B)15.3 percent of the income.
C)22.1 percent of the income.
D)32.6 percent of the income.
Question
Refer to the graph shown. 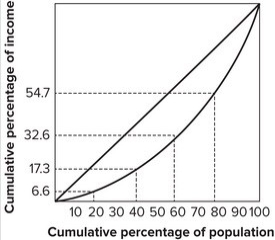 The top 20 percent of the families earn:
A)32.6 percent of the income.
B)45.3 percent of the income.
C)54.7 percent of the income.
D)67.4 percent of the income.
The top 20 percent of the families earn:A)32.6 percent of the income.
B)45.3 percent of the income.
C)54.7 percent of the income.
D)67.4 percent of the income.
Question
Question
Refer to the graph shown. 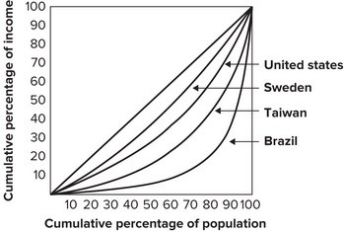 The country with the most unequal distribution of income is:
A)Sweden.
B)Taiwan.
C)the United States.
D)Brazil.
The country with the most unequal distribution of income is:A)Sweden.
B)Taiwan.
C)the United States.
D)Brazil.
Question
Refer to the graph shown. 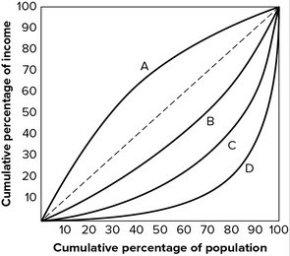 The Lorenz curve showing the most income equality is:
A)A.
B)B.
C)C.
D)D.
The Lorenz curve showing the most income equality is:A)A.
B)B.
C)C.
D)D.
Question
Question
Question
Question
Refer to the following graph. 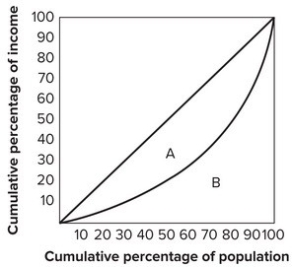 The Gini coefficient is calculated as area:
A)B divided by area A.
B)A divided by area A + B.
C)A divided by area B.
D)A + B divided by area B.
The Gini coefficient is calculated as area:A)B divided by area A.
B)A divided by area A + B.
C)A divided by area B.
D)A + B divided by area B.
Question
Question
Question
Question
Question
Question
Question
Question
Question
Question
Question
Question
Question
Question
Question
Question
Question
Question
Question
Question
Question
Question
Question
Question
Question
Question
Question
Question
Question
Question
Question
Question
Question
Question
Question
Question

Unlock Deck
Sign up to unlock the cards in this deck!
Unlock Deck
Unlock Deck
1/131
Play
Full screen (f)
Deck 18: Who Gets What the Distribution of Income
1
Attempts to reduce income inequality may lead to greater income inequality.
True
2
On its horizontal axis, a Lorenz curve measures:
A)cumulative percentage of family income.
B)amount of family income.
C)cumulative percentage of families.
D)demand of families.
A)cumulative percentage of family income.
B)amount of family income.
C)cumulative percentage of families.
D)demand of families.
cumulative percentage of families.
3
Economic theory tells us that inequality in income is unfair if differences in opportunity leads to inequality of income.
False
4
The United States has the least income inequality of all the nations in the world.
Unlock Deck
Unlock for access to all 131 flashcards in this deck.
Unlock Deck
k this deck
5
U.S. poverty figures do not include in-kind transfers or underreporting of income.
Unlock Deck
Unlock for access to all 131 flashcards in this deck.
Unlock Deck
k this deck
6
If a nation's Lorenz curve lies on the 45-degree line of income equality:
A)proportionately more of the nation's income is received by the lowest 20 percent of families than by the highest 20 percent.
B)income is unequally distributed.
C)proportionately more of the nation's income is received by the highest 20 percent of families than by the lowest 20 percent.
D)the income received by each 20 percent of families is 20 percent of the total income.
Unlock Deck
Unlock for access to all 131 flashcards in this deck.
Unlock Deck
k this deck
7
The recession that began with a housing market crash in 2007 had the effect of reducing income inequality.
Unlock Deck
Unlock for access to all 131 flashcards in this deck.
Unlock Deck
k this deck
8
Share distribution of income is the relative division of total income among:
A)capitalists, workers, and landowners.
B)income groupings.
C)socioeconomic groupings.
D)nationality groupings.
A)capitalists, workers, and landowners.
B)income groupings.
C)socioeconomic groupings.
D)nationality groupings.
Unlock Deck
Unlock for access to all 131 flashcards in this deck.
Unlock Deck
k this deck
9
On the Lorenz curve, a perfectly equal distribution of income would be represented by:
A)a line with a slope of 1.
B)a horizontal line.
C)a vertical line.
D)an upward-shaped curve.
A)a line with a slope of 1.
B)a horizontal line.
C)a vertical line.
D)an upward-shaped curve.
Unlock Deck
Unlock for access to all 131 flashcards in this deck.
Unlock Deck
k this deck
10
All real-world Lorenz curves are below the diagonal line because income is always distributed unequally in the real world.
Unlock Deck
Unlock for access to all 131 flashcards in this deck.
Unlock Deck
k this deck
11
Income is more unequally distributed than wealth in the United States.
Unlock Deck
Unlock for access to all 131 flashcards in this deck.
Unlock Deck
k this deck
12
An example of share distribution of income is how much:
A)the top 10 percent of a population gets.
B)Black people get relative to white people.
C)two-parent households get relative to single-parent households.
D)the young get relative to the old.
A)the top 10 percent of a population gets.
B)Black people get relative to white people.
C)two-parent households get relative to single-parent households.
D)the young get relative to the old.
Unlock Deck
Unlock for access to all 131 flashcards in this deck.
Unlock Deck
k this deck
13
Income inequality increased in the United States from 1929 to 1970 and decreased thereafter.
Unlock Deck
Unlock for access to all 131 flashcards in this deck.
Unlock Deck
k this deck
14
Most economists believe that it is impossible for government programs that benefit the rich to also benefit the poor.
Unlock Deck
Unlock for access to all 131 flashcards in this deck.
Unlock Deck
k this deck
15
All of the following are examples of socioeconomic distribution of income except how much:
A)the top 10 percent of a population gets.
B)Black people get relative to white people.
C)two-parent households get relative to single-parent households.
D)the young get relative to the old.
A)the top 10 percent of a population gets.
B)Black people get relative to white people.
C)two-parent households get relative to single-parent households.
D)the young get relative to the old.
Unlock Deck
Unlock for access to all 131 flashcards in this deck.
Unlock Deck
k this deck
16
Positive economics is concerned with justifying a particular distribution of income.
Unlock Deck
Unlock for access to all 131 flashcards in this deck.
Unlock Deck
k this deck
17
Poverty is defined by the U.S. government as having an income equal to or less than three times an average family's minimum food expenditure as calculated by the U.S. Department of Agriculture.
Unlock Deck
Unlock for access to all 131 flashcards in this deck.
Unlock Deck
k this deck
18
A Lorenz curve is a geometric representation of the:
A)level of income earned by a given family in a given country at a given time.
B)share distribution of income among families in a given country at a given time.
C)behavior of income over time.
D)behavior of income across countries.
A)level of income earned by a given family in a given country at a given time.
B)share distribution of income among families in a given country at a given time.
C)behavior of income over time.
D)behavior of income across countries.
Unlock Deck
Unlock for access to all 131 flashcards in this deck.
Unlock Deck
k this deck
19
If there were no income inequality in a nation, its Lorenz curve would be:
A)convex.
B)concave.
C)an upward-sloping straight line with slope of 1.
D)a horizontal line.
A)convex.
B)concave.
C)an upward-sloping straight line with slope of 1.
D)a horizontal line.
Unlock Deck
Unlock for access to all 131 flashcards in this deck.
Unlock Deck
k this deck
20
The Lorenz curve would be a diagonal line if income were distributed equally.
Unlock Deck
Unlock for access to all 131 flashcards in this deck.
Unlock Deck
k this deck
21
Real income will fall whenever:
A)prices and wages increase at the same rate.
B)wages increase faster than prices.
C)prices increase faster than wages.
D)wages increase and prices stay the same.
A)prices and wages increase at the same rate.
B)wages increase faster than prices.
C)prices increase faster than wages.
D)wages increase and prices stay the same.
Unlock Deck
Unlock for access to all 131 flashcards in this deck.
Unlock Deck
k this deck
22
Refer to the graph shown. The richest 10 percent of the families earn:
A)37 percent of the income.
B)48 percent of the income.
C)52 percent of the income.
D)63 percent of the income.
The richest 10 percent of the families earn:A)37 percent of the income.
B)48 percent of the income.
C)52 percent of the income.
D)63 percent of the income.
Unlock Deck
Unlock for access to all 131 flashcards in this deck.
Unlock Deck
k this deck
23
Which of the following statements contradicts the evidence shown in the graph shown?
A)Income is more equally distributed in Sweden than it is in Brazil.
B)Income is more equally distributed in Taiwan than it is in the United States.
C)Income is more equally distributed in Sweden than it is in Taiwan.
D)Income is more equally distributed in the United States than it is in Brazil.
A)Income is more equally distributed in Sweden than it is in Brazil.
B)Income is more equally distributed in Taiwan than it is in the United States.
C)Income is more equally distributed in Sweden than it is in Taiwan.
D)Income is more equally distributed in the United States than it is in Brazil.
Unlock Deck
Unlock for access to all 131 flashcards in this deck.
Unlock Deck
k this deck
24
Refer to the graph shown. The poorest 30 percent of the families earn:
A)2 percent of the income.
B)5 percent of the income.
C)9 percent of the income.
D)15 percent of the income.
The poorest 30 percent of the families earn:A)2 percent of the income.
B)5 percent of the income.
C)9 percent of the income.
D)15 percent of the income.
Unlock Deck
Unlock for access to all 131 flashcards in this deck.
Unlock Deck
k this deck
25
The Lorenz curve:
A)is an absolute measure of income inequality.
B)is a relative measure of income inequality.
C)takes into account changes in the standard of living.
D)has elements of absolute and relative measures.
A)is an absolute measure of income inequality.
B)is a relative measure of income inequality.
C)takes into account changes in the standard of living.
D)has elements of absolute and relative measures.
Unlock Deck
Unlock for access to all 131 flashcards in this deck.
Unlock Deck
k this deck
26
The trend back toward greater inequality in the 1970s and 1980s was caused by:
A)a movement toward progressive taxation.
B)a fall in the real income of the poor.
C)an increase in government funding for social programs.
D)a rise in the real income of the poor.
A)a movement toward progressive taxation.
B)a fall in the real income of the poor.
C)an increase in government funding for social programs.
D)a rise in the real income of the poor.
Unlock Deck
Unlock for access to all 131 flashcards in this deck.
Unlock Deck
k this deck
27
Refer to the graph shown. The poorest 50 percent of the families earn:
A)6 percent of the income.
B)19 percent of the income.
C)36 percent of the income.
D)64 percent of the income.
The poorest 50 percent of the families earn:A)6 percent of the income.
B)19 percent of the income.
C)36 percent of the income.
D)64 percent of the income.
Unlock Deck
Unlock for access to all 131 flashcards in this deck.
Unlock Deck
k this deck
28
Refer to the graph shown. The bottom 20 percent of the families earn:
A)6.6 percent of the income.
B)17.3 percent of the income.
C)10.7 percent of the income.
D)20 percent of the income.
The bottom 20 percent of the families earn:A)6.6 percent of the income.
B)17.3 percent of the income.
C)10.7 percent of the income.
D)20 percent of the income.
Unlock Deck
Unlock for access to all 131 flashcards in this deck.
Unlock Deck
k this deck
29
Which of the following statements is true?
A)Income distribution became less equal from 1929 to 1970.
B)Income distribution became less equal from 1970 to today.
C)The income of the bottom fifth of families rose 10 percent from 1970 to today.
D)The income of the bottom fifth of families fell 10 percent from 1929 to today.
A)Income distribution became less equal from 1929 to 1970.
B)Income distribution became less equal from 1970 to today.
C)The income of the bottom fifth of families rose 10 percent from 1970 to today.
D)The income of the bottom fifth of families fell 10 percent from 1929 to today.
Unlock Deck
Unlock for access to all 131 flashcards in this deck.
Unlock Deck
k this deck
30
Refer to the graph shown. The 25 percent of the families with the highest income earn:
A)6 percent of the income.
B)19 percent of the income.
C)36 percent of the income.
D)64 percent of the income.
The 25 percent of the families with the highest income earn:A)6 percent of the income.
B)19 percent of the income.
C)36 percent of the income.
D)64 percent of the income.
Unlock Deck
Unlock for access to all 131 flashcards in this deck.
Unlock Deck
k this deck
31
Refer to the graph shown. The poorest 25 percent of the families earn:
A)6 percent of the income.
B)19 percent of the income.
C)36 percent of the income.
D)64 percent of the income.
The poorest 25 percent of the families earn:A)6 percent of the income.
B)19 percent of the income.
C)36 percent of the income.
D)64 percent of the income.
Unlock Deck
Unlock for access to all 131 flashcards in this deck.
Unlock Deck
k this deck
32
Refer to the graph shown. The Lorenz curve showing the most income inequality is
A)A.
B)B.
C)C.
D)D.
The Lorenz curve showing the most income inequality isA)A.
B)B.
C)C.
D)D.
Unlock Deck
Unlock for access to all 131 flashcards in this deck.
Unlock Deck
k this deck
33
Other things equal, tax cuts favoring the rich and reductions in funding for government programs favoring the poor would be expected to:
A)increase income inequality, causing the Lorenz curve to bend toward the diagonal line.
B)decrease income inequality, causing the Lorenz curve to bend toward the diagonal line.
C)increase income inequality, causing the Lorenz curve to bend away from the diagonal line.
D)decrease income inequality, causing the Lorenz curve to bend away from the diagonal line.
Unlock Deck
Unlock for access to all 131 flashcards in this deck.
Unlock Deck
k this deck
34
Refer to the graph shown. The fourth quintile (a quintile is a fifth)of the families earn:
A)52 percent of the income.
B)28 percent of the income.
C)24 percent of the income.
D)20 percent of the income.
The fourth quintile (a quintile is a fifth)of the families earn:A)52 percent of the income.
B)28 percent of the income.
C)24 percent of the income.
D)20 percent of the income.
Unlock Deck
Unlock for access to all 131 flashcards in this deck.
Unlock Deck
k this deck
35
A Lorenz curve that becomes less bowed out implies:
A)a change in income distribution toward more inequality.
B)no change in income distribution.
C)a change in income distribution toward more equality.
D)an increase in poverty.
A)a change in income distribution toward more inequality.
B)no change in income distribution.
C)a change in income distribution toward more equality.
D)an increase in poverty.
Unlock Deck
Unlock for access to all 131 flashcards in this deck.
Unlock Deck
k this deck
36
Refer to the graph shown. The middle quintile (the middle fifth)of families earn:
A)10.7 percent of the income.
B)15.3 percent of the income.
C)22.1 percent of the income.
D)32.6 percent of the income.
The middle quintile (the middle fifth)of families earn:A)10.7 percent of the income.
B)15.3 percent of the income.
C)22.1 percent of the income.
D)32.6 percent of the income.
Unlock Deck
Unlock for access to all 131 flashcards in this deck.
Unlock Deck
k this deck
37
Refer to the graph shown. The top 20 percent of the families earn:
A)32.6 percent of the income.
B)45.3 percent of the income.
C)54.7 percent of the income.
D)67.4 percent of the income.
The top 20 percent of the families earn:A)32.6 percent of the income.
B)45.3 percent of the income.
C)54.7 percent of the income.
D)67.4 percent of the income.
Unlock Deck
Unlock for access to all 131 flashcards in this deck.
Unlock Deck
k this deck
38
The U.S. official poverty threshold is:
A)three times the U.S. Department of Agriculture's minimum food budget.
B)three times the U.S. Department of Housing's minimum housing allowance.
C)the level of income earned by a person receiving minimum wage.
D)the level of welfare benefits received by an eligible family.
A)three times the U.S. Department of Agriculture's minimum food budget.
B)three times the U.S. Department of Housing's minimum housing allowance.
C)the level of income earned by a person receiving minimum wage.
D)the level of welfare benefits received by an eligible family.
Unlock Deck
Unlock for access to all 131 flashcards in this deck.
Unlock Deck
k this deck
39
Refer to the graph shown. The country with the most unequal distribution of income is:
A)Sweden.
B)Taiwan.
C)the United States.
D)Brazil.
The country with the most unequal distribution of income is:A)Sweden.
B)Taiwan.
C)the United States.
D)Brazil.
Unlock Deck
Unlock for access to all 131 flashcards in this deck.
Unlock Deck
k this deck
40
Refer to the graph shown. The Lorenz curve showing the most income equality is:
A)A.
B)B.
C)C.
D)D.
The Lorenz curve showing the most income equality is:A)A.
B)B.
C)C.
D)D.
Unlock Deck
Unlock for access to all 131 flashcards in this deck.
Unlock Deck
k this deck
41
According to official statistics in the United States, a family is considered to live in poverty if its money income:
A)is below three times an average family's minimum food budget.
B)is below the income earned by 90 percent of all Americans.
C)is below the income earned by 80 percent of all Americans.
D)and all government transfers are below three times an average family's minimum food budget.
A)is below three times an average family's minimum food budget.
B)is below the income earned by 90 percent of all Americans.
C)is below the income earned by 80 percent of all Americans.
D)and all government transfers are below three times an average family's minimum food budget.
Unlock Deck
Unlock for access to all 131 flashcards in this deck.
Unlock Deck
k this deck
42
Wealth is defined as the:
A)total amount of income earned in a one-year period.
B)value of all assets minus the money that is owed.
C)value of assets that can be converted to cash on short notice.
D)value of monetary assets.
A)total amount of income earned in a one-year period.
B)value of all assets minus the money that is owed.
C)value of assets that can be converted to cash on short notice.
D)value of monetary assets.
Unlock Deck
Unlock for access to all 131 flashcards in this deck.
Unlock Deck
k this deck
43
Over 17 million American households had a net worth over $1 million. This means:
A)their assets minus liabilities were greater than $1 million.
B)their total income minus expenses was greater than $1 million.
C)more than $1 million flowed through the accounts of over 17 million households.
D)the Lorenz curve would show $1 million for over 17 million households.
A)their assets minus liabilities were greater than $1 million.
B)their total income minus expenses was greater than $1 million.
C)more than $1 million flowed through the accounts of over 17 million households.
D)the Lorenz curve would show $1 million for over 17 million households.
Unlock Deck
Unlock for access to all 131 flashcards in this deck.
Unlock Deck
k this deck
44
Refer to the following graph. The Gini coefficient is calculated as area:
A)B divided by area A.
B)A divided by area A + B.
C)A divided by area B.
D)A + B divided by area B.
The Gini coefficient is calculated as area:A)B divided by area A.
B)A divided by area A + B.
C)A divided by area B.
D)A + B divided by area B.
Unlock Deck
Unlock for access to all 131 flashcards in this deck.
Unlock Deck
k this deck
45
The price of food relative to other goods has:
A)fallen, making it easier to live on less income.
B)fallen, making it harder to live on less income because other goods cost so much.
C)increased, making it harder to live on less income.
D)increased, making it easier to live on less income because other goods cost less.
A)fallen, making it easier to live on less income.
B)fallen, making it harder to live on less income because other goods cost so much.
C)increased, making it harder to live on less income.
D)increased, making it easier to live on less income because other goods cost less.
Unlock Deck
Unlock for access to all 131 flashcards in this deck.
Unlock Deck
k this deck
46
In the United States, the income distribution is shaped like a:
A)pyramid.
B)diamond.
C)square.
D)pentagon.
A)pyramid.
B)diamond.
C)square.
D)pentagon.
Unlock Deck
Unlock for access to all 131 flashcards in this deck.
Unlock Deck
k this deck
47
A curve that shows the wealth distribution for the United States would be:
A)equal to the Lorenz curve for income.
B)below the Lorenz curve for income.
C)above the Lorenz curve for income.
D)above the diagonal line.
A)equal to the Lorenz curve for income.
B)below the Lorenz curve for income.
C)above the Lorenz curve for income.
D)above the diagonal line.
Unlock Deck
Unlock for access to all 131 flashcards in this deck.
Unlock Deck
k this deck
48
Society as a whole likely benefits from a decrease in poverty because:
A)social programs to help the poor are a small portion of the U.S. government budget.
B)increased assistance to those in poverty raises their incentives to work.
C)if there are fewer families in poverty, there will be less demand for childcare.
D)if there are fewer people in poverty, the incentive to commit crimes falls.
Unlock Deck
Unlock for access to all 131 flashcards in this deck.
Unlock Deck
k this deck
49
Since the minimum food budget used to determine the poverty line is not adjusted for changes in the standard of living, it is, in principle:
A)an absolute measure of poverty.
B)a relative measure of poverty.
C)an inaccurate measure of poverty.
D)an optimal measure of poverty.
A)an absolute measure of poverty.
B)a relative measure of poverty.
C)an inaccurate measure of poverty.
D)an optimal measure of poverty.
Unlock Deck
Unlock for access to all 131 flashcards in this deck.
Unlock Deck
k this deck
50
An important element that is excluded from U.S. poverty figures is:
A)income tax.
B)earned income.
C)in-kind transfers such as food stamps and housing assistance.
D)interest income.
A)income tax.
B)earned income.
C)in-kind transfers such as food stamps and housing assistance.
D)interest income.
Unlock Deck
Unlock for access to all 131 flashcards in this deck.
Unlock Deck
k this deck
51
Which of the following Gini coefficients represents the income distribution closest to being equal?
A)0.02
B)0.10
C)0.50
D)0.98
A)0.02
B)0.10
C)0.50
D)0.98
Unlock Deck
Unlock for access to all 131 flashcards in this deck.
Unlock Deck
k this deck
52
The official poverty income threshold in the United States is:
A)adjusted for changes in the basket of food purchased by the average family.
B)not adjusted for the effects of inflation.
C)adjusted for inflation.
D)adjusted for increases in standard of living.
A)adjusted for changes in the basket of food purchased by the average family.
B)not adjusted for the effects of inflation.
C)adjusted for inflation.
D)adjusted for increases in standard of living.
Unlock Deck
Unlock for access to all 131 flashcards in this deck.
Unlock Deck
k this deck
53
One study of the distribution of wealth indicates that the bottom 40 percent of households hold 1 percent or less of total marketable wealth in the United States. Which of the following people is most likely to be in the bottom 40 percent?
A)Ann is 29 years old, earns $120,000 a year, has no financial assets, but still has student loans of $4,000.
B)Betty is 29 years old, earns $40,000 a year, has $80,000 in a savings account, and has credit card debt of $4,000.
C)Carol is 69 years old, is disabled, and is living on Social Security and dividends from her $500,000 of mutual funds. She has no debt.
D)Debra is 45 years old, and the only money she gets is $40,000 of rental payments from an apartment building she owns that is worth $250,000. She owes the bank $50,000.
Unlock Deck
Unlock for access to all 131 flashcards in this deck.
Unlock Deck
k this deck
54
Today, the Gini coefficient of income inequality for the United States is about .5. In 1975, it had been about .4. What do these numbers tell us?
A)Wealth is distributed less equally than income.
B)The number of rich people has fallen.
C)Income has become more unequally distributed.
D)The official definition of poverty has changed.
A)Wealth is distributed less equally than income.
B)The number of rich people has fallen.
C)Income has become more unequally distributed.
D)The official definition of poverty has changed.
Unlock Deck
Unlock for access to all 131 flashcards in this deck.
Unlock Deck
k this deck
55
A Gini coefficient of 1 denotes:
A)zero income.
B)infinite income.
C)perfect inequality of income distribution.
D)perfect equality of income distribution.
A)zero income.
B)infinite income.
C)perfect inequality of income distribution.
D)perfect equality of income distribution.
Unlock Deck
Unlock for access to all 131 flashcards in this deck.
Unlock Deck
k this deck
56
The Gini coefficient for Algeria is about 0.4. How would this number be shown on a Lorenz curve?
A)It cannot be shown; the Lorenz curve and the Gini coefficient are alternative ways of measuring inequality.
B)The area between the Lorenz curve and the line of absolute equality is 40 percent of the total area under the line of equality.
C)The area between the Lorenz curve and the x-axis is 40 percent of the total area below the line of equality.
D)The length of the Lorenz curve is 40 percent longer than the line of equality.
Unlock Deck
Unlock for access to all 131 flashcards in this deck.
Unlock Deck
k this deck
57
If the Lorenz curve becomes more outwardly bowed, it is also true that the number of families living in poverty:
A)must have risen.
B)must have fallen.
C)could have risen or fallen.
D)must have remained the same.
A)must have risen.
B)must have fallen.
C)could have risen or fallen.
D)must have remained the same.
Unlock Deck
Unlock for access to all 131 flashcards in this deck.
Unlock Deck
k this deck
58
For the purpose of determining whether a family is officially considered to be living in poverty, poverty figures do not include:
A)after-tax income of the poor.
B)food stamps.
C)earned income.
D)profits of a small business owner.
A)after-tax income of the poor.
B)food stamps.
C)earned income.
D)profits of a small business owner.
Unlock Deck
Unlock for access to all 131 flashcards in this deck.
Unlock Deck
k this deck
59
The minimum food budget used to determine the poverty line was determined in the:
A)1960s but has been recalculated every decade to account for rising standards of living.
B)1960s and is not recalculated to account for rising standards of living.
C)1930s but has been recalculated every decade to account for rising standards of living.
D)1930s and is not recalculated to account for rising standards of living.
Unlock Deck
Unlock for access to all 131 flashcards in this deck.
Unlock Deck
k this deck
60
One study of the distribution of wealth indicates that the bottom 40 percent of households hold 1 percent or less of total marketable wealth in the United States and the top 1 percent owns close to 40 percent of it. An economist might observe that these data do not include the value of human capital: the value of labor and skills embodied in a person. If we were to include human capital, which of the following people's net worth would change the most?
A)Debra, who recently received a $25,000 bonus from her job that she has spent on an around-the-world trip
B)Carol, who has just bought an apartment for $500,000 using savings and bank loans
C)Betty, who has just retired but expects to live well because her retirement account is worth $1,000,000
D)Alice, who has just completed her education as a medical doctor and now has student loans of $100,000
Unlock Deck
Unlock for access to all 131 flashcards in this deck.
Unlock Deck
k this deck
61
When a tax is progressive, the average tax rate:
A)decreases with income.
B)is constant with income.
C)increases with income.
D)first increases with income, then decreases with income.
A)decreases with income.
B)is constant with income.
C)increases with income.
D)first increases with income, then decreases with income.
Unlock Deck
Unlock for access to all 131 flashcards in this deck.
Unlock Deck
k this deck
62
The three problems with determining whether an equal income distribution is fair include all of the following except:
A)people don't start from equivalent positions.
B)people's needs differ.
C)income differences and wealth differences are not the same.
D)people's efforts differ.
A)people don't start from equivalent positions.
B)people's needs differ.
C)income differences and wealth differences are not the same.
D)people's efforts differ.
Unlock Deck
Unlock for access to all 131 flashcards in this deck.
Unlock Deck
k this deck
63
To remedy unfairness in the distribution of income, many Americans look to all of the following except:
A)affirmative action laws.
B)comparable worth laws.
C)social welfare programs.
D)regressive taxes.
A)affirmative action laws.
B)comparable worth laws.
C)social welfare programs.
D)regressive taxes.
Unlock Deck
Unlock for access to all 131 flashcards in this deck.
Unlock Deck
k this deck
64
Because income differs so much by type of job, some economists argue that a new class distinction has emerged between:
A)union and nonunion workers.
B)workers and capitalists.
C)professionals and nonprofessionals.
D)salaried workers and the self-employed.
A)union and nonunion workers.
B)workers and capitalists.
C)professionals and nonprofessionals.
D)salaried workers and the self-employed.
Unlock Deck
Unlock for access to all 131 flashcards in this deck.
Unlock Deck
k this deck
65
The underclass in the United States has expanded over the last several decades as a fraction of the overall population partly because:
A)there are more people in the United States.
B)there has been a substantial movement of Black people into the middle class.
C)there has been a substantial amount of well-educated immigrants from Southeast Asia.
D)there has been a substantial amount of illegal immigration.
A)there are more people in the United States.
B)there has been a substantial movement of Black people into the middle class.
C)there has been a substantial amount of well-educated immigrants from Southeast Asia.
D)there has been a substantial amount of illegal immigration.
Unlock Deck
Unlock for access to all 131 flashcards in this deck.
Unlock Deck
k this deck
66
For U.S. workers in tradable sectors such as manufacturing, the effect of globalization has been:
A)to push wages up relative to those in nontradable sectors such as government or service workers.
B)to cause greater upward mobility for those workers while reducing downward mobility.
C)to push wages down or leave them unemployed.
D)to reduce unemployment in this group while leaving wage rates about the same.
Unlock Deck
Unlock for access to all 131 flashcards in this deck.
Unlock Deck
k this deck
67
If redistribution is a public bad, rather than a public good, redistributing income to the poor makes others feel that society is:
A)unjust and therefore decreases their utility.
B)unjust and therefore increases their utility.
C)more just and therefore decreases their utility.
D)more just and therefore increases their utility.
A)unjust and therefore decreases their utility.
B)unjust and therefore increases their utility.
C)more just and therefore decreases their utility.
D)more just and therefore increases their utility.
Unlock Deck
Unlock for access to all 131 flashcards in this deck.
Unlock Deck
k this deck
68
Friedrich Nietzsche's views on income distribution and fairness can best be described by the statement:
A)The lesser individuals' duty should be to work for the well-being of the brightest individuals.
B)A high level of income inequality is necessary to sustain the arts, beauty, education, and civilization.
C)Society's goal should be to maximize the welfare of the least well-off, but some inequality is necessary to meet this goal.
D)An efficiently operating marketplace will generate an equal distribution of income without government intervention.
Unlock Deck
Unlock for access to all 131 flashcards in this deck.
Unlock Deck
k this deck
69
Bertrand de Juvenal's views on income distribution and fairness can best be described by the statement:
A)The lesser individuals' duty should be to work for the well-being of the brightest individuals.
B)A high level of income inequality is necessary to sustain the arts, beauty, education, and civilization.
C)Society's goal should be to maximize the welfare of the least well-off, but some inequality is necessary to meet this goal.
D)Property rights should be equally distributed, and the market should determine the distribution of income.
Unlock Deck
Unlock for access to all 131 flashcards in this deck.
Unlock Deck
k this deck
70
When most people talk about believing in equality of income, they mean they believe in equality of:
A)effort for comparably endowed individuals.
B)opportunity for comparably endowed individuals.
C)after-tax income for comparably endowed individuals.
D)before-tax income for comparably endowed individuals.
A)effort for comparably endowed individuals.
B)opportunity for comparably endowed individuals.
C)after-tax income for comparably endowed individuals.
D)before-tax income for comparably endowed individuals.
Unlock Deck
Unlock for access to all 131 flashcards in this deck.
Unlock Deck
k this deck
71
Which of the following is not one of the side effects economists have found in programs to redistribute income?
A)The incentive effects of a tax may result in a switch from labor to leisure.
B)The effects of taxes may include attempts to avoid or evade taxes, leading to a decrease in measured income.
C)The incentive effects of distributing money may cause people to make themselves look needier than they really are.
D)The incentive effects of distributing money may cause people to avoid government assistance programs.
Unlock Deck
Unlock for access to all 131 flashcards in this deck.
Unlock Deck
k this deck
72
John Rawls's views on income distribution and fairness can best be described by the statement:
A)The lesser individuals' duty should be to work for the well-being of the brightest individuals.
B)A high level of income inequality is necessary to sustain the arts, beauty, education, and civilization.
C)Society's goal should be to maximize the welfare of the least well-off, but some inequality is necessary to meet this goal.
D)Property rights should be equally distributed, and the market should determine the distribution of income.
Unlock Deck
Unlock for access to all 131 flashcards in this deck.
Unlock Deck
k this deck
73
In most developed countries, the class system:
A)is the same as in underdeveloped countries.
B)has been completely eliminated.
C)is a pyramid with the largest group being the lower class.
D)is diamond-shaped with the largest group being the middle class.
A)is the same as in underdeveloped countries.
B)has been completely eliminated.
C)is a pyramid with the largest group being the lower class.
D)is diamond-shaped with the largest group being the middle class.
Unlock Deck
Unlock for access to all 131 flashcards in this deck.
Unlock Deck
k this deck
74
Some economists believe that:
A)giving benefits to the poor will reduce aggregate demand, improving business so that wealthy stockholders are better off.
B)giving benefits to the rich will expand aggregate output and thus help the poor.
C)taxing the poor will cause them to increase their work efforts.
D)taxing the rich will cause them to increase their work efforts.
Unlock Deck
Unlock for access to all 131 flashcards in this deck.
Unlock Deck
k this deck
75
An increase in the tax rate can cause total tax collections to fall if:
A)higher taxes cause individuals to substitute leisure for labor.
B)higher taxes cause individuals to substitute labor for leisure.
C)the tax is regressive.
D)the tax is progressive.
A)higher taxes cause individuals to substitute leisure for labor.
B)higher taxes cause individuals to substitute labor for leisure.
C)the tax is regressive.
D)the tax is progressive.
Unlock Deck
Unlock for access to all 131 flashcards in this deck.
Unlock Deck
k this deck
76
In the United States:
A)the upper class has become the largest class.
B)the lower class has become the largest class.
C)the middle class has become the largest class.
D)all three classes are the same size.
A)the upper class has become the largest class.
B)the lower class has become the largest class.
C)the middle class has become the largest class.
D)all three classes are the same size.
Unlock Deck
Unlock for access to all 131 flashcards in this deck.
Unlock Deck
k this deck
77
In the United States, the class system is a:
A)triangle, and in most developing countries the class system is a triangle.
B)pentagon, and in most developing countries the class system is a diamond.
C)pentagon, and in most developing countries the class system is a triangle.
D)triangle, and in most developing countries the class system is a diamond.
Unlock Deck
Unlock for access to all 131 flashcards in this deck.
Unlock Deck
k this deck
78
Which of the following statements is a correct interpretation of some economists' views?
A)When the incomes of the poor are increased, the poor purchase more goods and services, and this causes lower profits.
B)When the government gives income to the head of a household, other members of the household remain in need.
C)When the rich do well, the total pie is increased so much that the benefits that trickle down to the poor are greater than the proceeds they would get from redistribution.
D)When the rich do well, the total pie is decreased, so that the poor are worse off than they were before.
Unlock Deck
Unlock for access to all 131 flashcards in this deck.
Unlock Deck
k this deck
79
The democratic system of one person/one vote:
A)necessarily leads to a political system that favors the poor because there are more poor voters than there are rich voters.
B)necessarily leads to a political system that favors the poor because the poor organize themselves into groups that can deliver votes to politicians.
C)does not necessarily lead to a political system that favors the poor, because many of the poor do not vote, believing that their individual votes cannot make a difference.
D)does not necessarily lead to a political system that favors the poor because many of the poor are illiterate and unable to vote.
Unlock Deck
Unlock for access to all 131 flashcards in this deck.
Unlock Deck
k this deck
80
A higher tax rate could result in lower tax revenues if:
A)attempts to avoid or evade taxes increase.
B)individuals switch from leisure to labor.
C)fewer people qualify for government assistance.
D)the tax has no incentive effects.
A)attempts to avoid or evade taxes increase.
B)individuals switch from leisure to labor.
C)fewer people qualify for government assistance.
D)the tax has no incentive effects.
Unlock Deck
Unlock for access to all 131 flashcards in this deck.
Unlock Deck
k this deck
Unlock Deck
Unlock for access to all 131 flashcards in this deck.


