Deck 12: Production and Cost Analysis II
Full screen (f)
Question
Question
Question
Question
Question
Question
Question
Question
Question
Question
Question
Question
Question
Question
Question
Question
Question
Question
Question
Question
Question
Question
Question
Question
Question
Refer to the graph shown. Given the long-run average cost curve, a seller must produce 18 units just to break even if the price the seller expects is roughly: 
A)$50.
B)$52.
C)$54.
D)$58.
A)$50.
B)$52.
C)$54.
D)$58.
Question
Refer to the graph shown. Given the long-run average cost curve, the minimum efficient scale of production is: 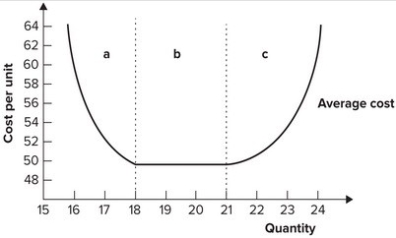
A)16.
B)18 to 21.
C)21.
D)23.
A)16.
B)18 to 21.
C)21.
D)23.
Question
Question
Question
Question
Question
Question
Question
Question
Question
Question
Refer to the graph shown. If the seller expects a price of $52, the minimum amount the firm must produce to be profitable is: 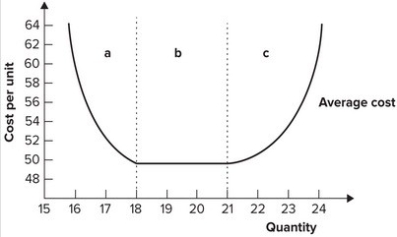
A)15.
B)16.
C)17.
D)18.
A)15.
B)16.
C)17.
D)18.
Question
Question
Question
Question
Question
The graph shown exhibits diseconomies of scale: 
A)in region a.
B)in region b.
C)in region c.
D)over the entire range of output.
A)in region a.
B)in region b.
C)in region c.
D)over the entire range of output.
Question
Question
Refer to the graph shown. If the seller expects a price of $48: 
A)it is not economically feasible to produce any level of output.
B)any level of output is profitable.
C)the minimum level of profitable production is 18.
D)the minimum level of profitable production is 21.
A)it is not economically feasible to produce any level of output.
B)any level of output is profitable.
C)the minimum level of profitable production is 18.
D)the minimum level of profitable production is 21.
Question
Question
Refer to the graph shown. The output range in region c is associated with: 
A)diminishing marginal productivity.
B)constant returns to scale.
C)economies of scale.
D)diseconomies of scale.
A)diminishing marginal productivity.
B)constant returns to scale.
C)economies of scale.
D)diseconomies of scale.
Question
Question
Question
Question
Refer to the graph shown. The output range in region a is associated with: 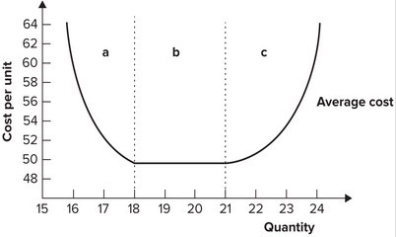
A)increasing marginal productivity.
B)constant returns to scale.
C)economies of scale.
D)diseconomies of scale.
A)increasing marginal productivity.
B)constant returns to scale.
C)economies of scale.
D)diseconomies of scale.
Question
The graph shown exhibits constant returns to scale: 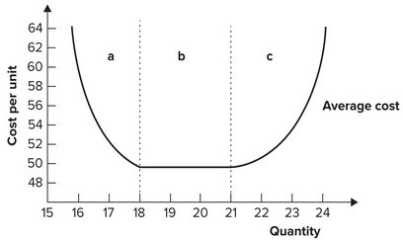
A)in region a.
B)in region b.
C)in region c.
D)in regions a, b, and c.
A)in region a.
B)in region b.
C)in region c.
D)in regions a, b, and c.
Question
Question
Refer to the graph shown. The output range in region b is associated with: 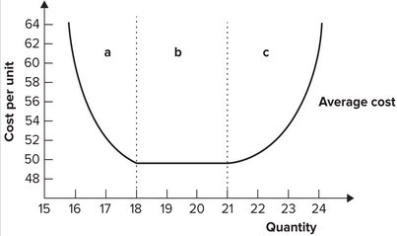
A)diminishing marginal productivity.
B)constant returns to scale.
C)economies of scale.
D)diseconomies of scale.
A)diminishing marginal productivity.
B)constant returns to scale.
C)economies of scale.
D)diseconomies of scale.
Question
Question
Question
Question
Question
Question
Refer to the graph shown. The graph exhibits economies of scale: 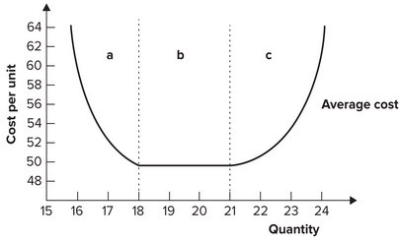
A)in region a.
B)in region b.
C)in region c.
D)over the entire range of output.
A)in region a.
B)in region b.
C)in region c.
D)over the entire range of output.
Question
Question
Question
Refer to the graph shown. A firm that produces 900 units of output using the plant size associated with SATC2 minimizes: 
A)both long-run and short-run average total cost.
B)long-run average total cost only.
C)short-run average total cost only.
D)neither long-run nor short-run average total cost.
A)both long-run and short-run average total cost.
B)long-run average total cost only.
C)short-run average total cost only.
D)neither long-run nor short-run average total cost.
Question
Question
Question
Question
Question
Question
Question
Question
Question
Question
Question
Question
Question
Refer to the graph shown. If the firm wants to produce 900 units of output, it should use the plant size represented by: 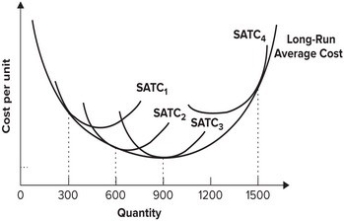
A)SATC1.
B)SATC2.
C)SATC3.
D)SATC4.
A)SATC1.
B)SATC2.
C)SATC3.
D)SATC4.
Question
Refer to the graph shown. A firm that produces 900 units of output using the plant size associated with SATC3 minimizes: 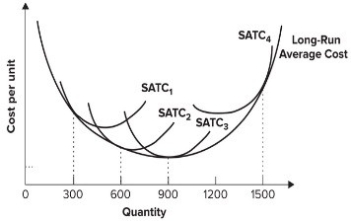
A)both long-run and short-run average total cost.
B)long-run average total cost only.
C)short-run average total cost only.
D)neither long-run nor short-run average total cost.
A)both long-run and short-run average total cost.
B)long-run average total cost only.
C)short-run average total cost only.
D)neither long-run nor short-run average total cost.
Question
Refer to the graph shown. If a firm expected to produce 900 units when it built its plant but now desires to reduce its output to 600 units in the short run, it will use the plant size represented by: 
A)SATC1.
B)SATC2.
C)SATC3.
D)SATC4.
A)SATC1.
B)SATC2.
C)SATC3.
D)SATC4.
Question
Refer to the graph shown. If a firm expected to produce 300 units when it built its plant but now desires to expand its output to 500 units in the short run, it will use the plant size represented by: 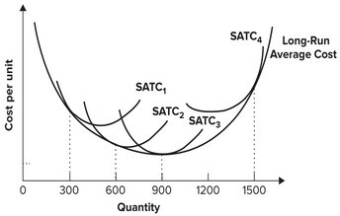
A)SATC1.
B)SATC2.
C)SATC3.
D)SATC4.
A)SATC1.
B)SATC2.
C)SATC3.
D)SATC4.
Question
Refer to the graph shown. If a firm wants to produce 300 units of output, it should use the plant size represented by: 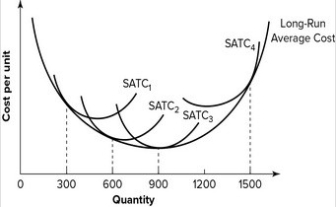
A)SATC1.
B)SATC2.
C)SATC3.
D)SATC4.
A)SATC1.
B)SATC2.
C)SATC3.
D)SATC4.
Question
Question
Refer to the graph shown. A firm planning to produce 1,500 units of output would choose the scale of operation represented by: 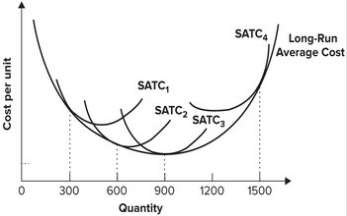
A)SATC1.
B)SATC2.
C)SATC3.
D)SATC4.
A)SATC1.
B)SATC2.
C)SATC3.
D)SATC4.

Unlock Deck
Sign up to unlock the cards in this deck!
Unlock Deck
Unlock Deck
1/152
Play
Full screen (f)
Deck 12: Production and Cost Analysis II
1
Economic efficiency is achieved at a particular output level if:
A)marginal cost is as low as possible.
B)average fixed cost is as low as possible.
C)average total cost is as low as possible.
D)average variable cost is as low as possible.
A)marginal cost is as low as possible.
B)average fixed cost is as low as possible.
C)average total cost is as low as possible.
D)average variable cost is as low as possible.
average total cost is as low as possible.
2
To manufacture 1,000 pairs of shoes in a week, a firm must use at least 1,500 workers and 5 machines or 100 machines and 150 workers. Which method can be technically efficient?
A)1,500 workers and 5 machines
B)150 workers and 100 machines
C)Both
D)Neither
A)1,500 workers and 5 machines
B)150 workers and 100 machines
C)Both
D)Neither
Both
3
Technical efficiency in production means a given level of output is produced with the minimum amount of inputs.
True
4
A firm can use 50 workers and 10 machines, 70 workers and 9 machines, or 75 workers and 9 machines to produce 40 chairs. If each worker costs $20 and each machine is rented for $500, the economically efficient input combination is:
A)50 workers and 10 machines.
B)70 workers and 9 machines.
C)75 workers and 9 machines.
D)120 workers and 19 machines.
A)50 workers and 10 machines.
B)70 workers and 9 machines.
C)75 workers and 9 machines.
D)120 workers and 19 machines.
Unlock Deck
Unlock for access to all 152 flashcards in this deck.
Unlock Deck
k this deck
5
Economies of scale do not exist in the presence of indivisible setup costs.
Unlock Deck
Unlock for access to all 152 flashcards in this deck.
Unlock Deck
k this deck
6
Which of the following statements is true?
A)Many different production processes can be economically efficient, but only the method that involves the lowest possible cost is technically efficient.
B)Many different production processes can be technically efficient, but only the method that involves the lowest possible cost is economically efficient.
C)There is only one production process that is technically efficient, and this process is also economically efficient.
D)There are many production processes that are both technically and economically efficient, but only one of these involves the lowest possible cost.
Unlock Deck
Unlock for access to all 152 flashcards in this deck.
Unlock Deck
k this deck
7
When per-unit costs increase as output increases, there are economies of scale in production.
Unlock Deck
Unlock for access to all 152 flashcards in this deck.
Unlock Deck
k this deck
8
A social entrepreneur's central motivation in creating "for-benefit" corporations is to achieve social, not just economic, ends.
Unlock Deck
Unlock for access to all 152 flashcards in this deck.
Unlock Deck
k this deck
9
Which of the following statements is true?
A)Any technically efficient production process is always economically efficient.
B)Any economically efficient production process is always technically efficient.
C)A production process is either economically efficient or technically efficient but never both.
D)A production process must always be both economically efficient and technically efficient.
Unlock Deck
Unlock for access to all 152 flashcards in this deck.
Unlock Deck
k this deck
10
The economically efficient method of production:
A)is the same in all countries.
B)is not influenced by the relative scarcity of inputs.
C)is influenced by the relative scarcity of inputs.
D)does not depend on input prices.
A)is the same in all countries.
B)is not influenced by the relative scarcity of inputs.
C)is influenced by the relative scarcity of inputs.
D)does not depend on input prices.
Unlock Deck
Unlock for access to all 152 flashcards in this deck.
Unlock Deck
k this deck
11
At the planned output level, short-run average total cost equals long-run average total cost, but at all other points, short-run average total cost is higher than long-run average total cost.
Unlock Deck
Unlock for access to all 152 flashcards in this deck.
Unlock Deck
k this deck
12
A technically efficient method of production produces a given level of output at the lowest possible cost.
Unlock Deck
Unlock for access to all 152 flashcards in this deck.
Unlock Deck
k this deck
13
The long-run average total cost curve is considered to be an envelope curve as each short-run average total cost curve touches it at only one level of output.
Unlock Deck
Unlock for access to all 152 flashcards in this deck.
Unlock Deck
k this deck
14
To manufacture 1,000 pairs of shoes in a week, a firm can use 1,500 workers and 50 machines or 100 machines and 2,000 workers. Which method is more technically efficient?
A)1,500 workers and 50 machines
B)2,000 workers and 100 machines
C)Both are equally efficient.
D)Neither could be considered efficient.
A)1,500 workers and 50 machines
B)2,000 workers and 100 machines
C)Both are equally efficient.
D)Neither could be considered efficient.
Unlock Deck
Unlock for access to all 152 flashcards in this deck.
Unlock Deck
k this deck
15
An economically efficient method of production produces a given level of output at the lowest possible cost.
Unlock Deck
Unlock for access to all 152 flashcards in this deck.
Unlock Deck
k this deck
16
Economies of scope exist when the production of one good is less costly because other related goods already are being produced.
Unlock Deck
Unlock for access to all 152 flashcards in this deck.
Unlock Deck
k this deck
17
Some children in Siliguri, India, work as low-wage professional rock breakers. The rocks they break with a hammer are used in buildings and roads. In terms of the idea of efficiency, having children break rocks with hammers:
A)is not efficient because modern equipment could crush stone with far less effort.
B)is technically efficient but not economically efficient because the job does not pay a living wage.
C)is economically efficient but not technically efficient because it uses too much labor relative to capital.
D)could be efficient given the extremely low price of labor and high price of capital.
Unlock Deck
Unlock for access to all 152 flashcards in this deck.
Unlock Deck
k this deck
18
The production techniques available to real-world firms are constantly changing because of learning by doing and technological change.
Unlock Deck
Unlock for access to all 152 flashcards in this deck.
Unlock Deck
k this deck
19
An entrepreneur is an individual who sees an opportunity to sell an item at a price higher than the average total cost of producing it.
Unlock Deck
Unlock for access to all 152 flashcards in this deck.
Unlock Deck
k this deck
20
The minimum efficient level of production refers to the production level in the long run that spreads setup costs out just enough to make production profitable.
Unlock Deck
Unlock for access to all 152 flashcards in this deck.
Unlock Deck
k this deck
21
Economies of scale are associated with:
A)indivisible setup costs.
B)zero setup costs.
C)the short run.
D)diminishing marginal productivity.
A)indivisible setup costs.
B)zero setup costs.
C)the short run.
D)diminishing marginal productivity.
Unlock Deck
Unlock for access to all 152 flashcards in this deck.
Unlock Deck
k this deck
22
At one time, sea lions were depleting the stock of steelhead trout. One idea to scare sea lions away from the Washington coast was to launch fake killer whales, which are predators of sea lions. The cost of making the first whale is $16,000 ($5,000 for materials and $11,000 for the mold). The mold can be reused to make additional whales, and so additional whales cost $5,000 each. Based on these numbers, the average total cost of making five fake killer whales would be:
A)$5,000.
B)$11,000.
C)$7,200.
D)$36,000.
A)$5,000.
B)$11,000.
C)$7,200.
D)$36,000.
Unlock Deck
Unlock for access to all 152 flashcards in this deck.
Unlock Deck
k this deck
23
Economies of scale occur when a firm's long-run average total cost curve is:
A)upward-sloping.
B)vertical.
C)downward-sloping.
D)horizontal.
A)upward-sloping.
B)vertical.
C)downward-sloping.
D)horizontal.
Unlock Deck
Unlock for access to all 152 flashcards in this deck.
Unlock Deck
k this deck
24
At one time, sea lions were depleting the stock of steelhead trout. One idea to scare sea lions away from the Washington coast was to launch fake killer whales, which are predators of sea lions. The cost of making the first whale is $16,000 ($5,000 for materials and $11,000 for the mold). The mold can be reused to make additional whales, and so additional whales cost $5,000 each. Based on these numbers, the production of fake killer whales exhibits:
A)diminishing marginal product.
B)constant returns to scale.
C)increasing returns to scale.
D)decreasing returns to scale.
A)diminishing marginal product.
B)constant returns to scale.
C)increasing returns to scale.
D)decreasing returns to scale.
Unlock Deck
Unlock for access to all 152 flashcards in this deck.
Unlock Deck
k this deck
25
Refer to the graph shown. Given the long-run average cost curve, a seller must produce 18 units just to break even if the price the seller expects is roughly:
A)$50.
B)$52.
C)$54.
D)$58.
A)$50.
B)$52.
C)$54.
D)$58.
Unlock Deck
Unlock for access to all 152 flashcards in this deck.
Unlock Deck
k this deck
26
Refer to the graph shown. Given the long-run average cost curve, the minimum efficient scale of production is:
A)16.
B)18 to 21.
C)21.
D)23.
A)16.
B)18 to 21.
C)21.
D)23.
Unlock Deck
Unlock for access to all 152 flashcards in this deck.
Unlock Deck
k this deck
27
Given that there are significant economies of scale involved in making flat screen television sets, the cost of manufacturing a flat screen television set most likely will:
A)rise as the industry matures.
B)fall as the industry matures.
C)remain the same as the industry matures.
D)rise whether the industry matures or not.
A)rise as the industry matures.
B)fall as the industry matures.
C)remain the same as the industry matures.
D)rise whether the industry matures or not.
Unlock Deck
Unlock for access to all 152 flashcards in this deck.
Unlock Deck
k this deck
28
Which of the following is most likely to be an example of economies of scale?
A)The per-unit costs on Excel Publishing Company's manuals fall because it adopted a new technology after receiving a large order from the government.
B)Alpha-Beta Inc. raised its price by 10 percent after a 5 percent increase in production costs.
C)Widget Manufacturing doubled its production by opening a new plant that was identical to its old plant.
D)The XYZ Co. increased production 25 percent after a 30 percent increase in all inputs.
Unlock Deck
Unlock for access to all 152 flashcards in this deck.
Unlock Deck
k this deck
29
Because there are very significant economies of scale involved in making flat screen television sets in a competitive market, the price of flat screen TVs will:
A)fall as output expands because long-run average total costs are lower for higher quantities.
B)rise because the long run average total cost curve is upward-sloping over the entire range of output.
C)rise because of the combination of stronger demand and higher production costs.
D)stay exactly the same regardless of any shifts in the demand curve.
Unlock Deck
Unlock for access to all 152 flashcards in this deck.
Unlock Deck
k this deck
30
The law of diminishing marginal productivity does not apply in the long run because:
A)some inputs are fixed in the long run.
B)some inputs are variable in the long run.
C)no inputs are fixed in the long run.
D)all inputs are fixed in the long run.
A)some inputs are fixed in the long run.
B)some inputs are variable in the long run.
C)no inputs are fixed in the long run.
D)all inputs are fixed in the long run.
Unlock Deck
Unlock for access to all 152 flashcards in this deck.
Unlock Deck
k this deck
31
A firm finds that producing 30,000 vases costs $180,000 and producing 40,000 vases costs $200,000. This pattern might be explained by:
A)economies of scope.
B)economies of scale.
C)diseconomies of scale.
D)diminishing marginal productivity.
A)economies of scope.
B)economies of scale.
C)diseconomies of scale.
D)diminishing marginal productivity.
Unlock Deck
Unlock for access to all 152 flashcards in this deck.
Unlock Deck
k this deck
32
When carmakers began to cut costs of producing cars by designing the chassis, engines, and transmissions so that different models could be produced on the same assembly line, production costs fell $240 per car. This change caused car makers' short-run average cost curves to:
A)shift up.
B)shift down.
C)remain unchanged; only the long-run average cost curve was affected.
D)remain unchanged, though there was a movement along the short-run average cost curve.
A)shift up.
B)shift down.
C)remain unchanged; only the long-run average cost curve was affected.
D)remain unchanged, though there was a movement along the short-run average cost curve.
Unlock Deck
Unlock for access to all 152 flashcards in this deck.
Unlock Deck
k this deck
33
When the number of mega-producers of hobs that operated at a lower average cost than smaller producers rose, the number of hogs slaughtered rose to record levels. What economic concept does this describe?
A)Economies of scope
B)Economies of scale
C)Indivisible setup costs
D)Minimum efficient production
A)Economies of scope
B)Economies of scale
C)Indivisible setup costs
D)Minimum efficient production
Unlock Deck
Unlock for access to all 152 flashcards in this deck.
Unlock Deck
k this deck
34
At one time sea lions were depleting the stock of steelhead trout. One idea to scare sea lions away from the Washington coast was to launch fake killer whales, which are predators of sea lions. The cost of making the first whale is $16,000 ($5,000 for materials and $11,000 for the mold). The mold can be reused to make additional whales, and so additional whales cost $5,000 each. Based on these numbers, the total cost of making two fake killer whales would be:
A)$10,000.
B)$11,000.
C)$16,000.
D)$21,000.
A)$10,000.
B)$11,000.
C)$16,000.
D)$21,000.
Unlock Deck
Unlock for access to all 152 flashcards in this deck.
Unlock Deck
k this deck
35
Economies of scale account for what part of a long-run average total cost curve?
A)Downward-sloping
B)Horizontal
C)Upward-sloping
D)Vertical
A)Downward-sloping
B)Horizontal
C)Upward-sloping
D)Vertical
Unlock Deck
Unlock for access to all 152 flashcards in this deck.
Unlock Deck
k this deck
36
Refer to the graph shown. If the seller expects a price of $52, the minimum amount the firm must produce to be profitable is:
A)15.
B)16.
C)17.
D)18.
A)15.
B)16.
C)17.
D)18.
Unlock Deck
Unlock for access to all 152 flashcards in this deck.
Unlock Deck
k this deck
37
Since capital is relatively scarce in India, the economically efficient method of producing food would probably:
A)be land intensive.
B)be capital intensive.
C)not be labor intensive.
D)not be capital intensive.
A)be land intensive.
B)be capital intensive.
C)not be labor intensive.
D)not be capital intensive.
Unlock Deck
Unlock for access to all 152 flashcards in this deck.
Unlock Deck
k this deck
38
If the demand for flat screen television sets is rising while at the same time the price of a flat screen TV is falling, there is evidence of:
A)economies of scale.
B)diseconomies of scale.
C)constant returns to scale.
D)diminishing marginal product.
A)economies of scale.
B)diseconomies of scale.
C)constant returns to scale.
D)diminishing marginal product.
Unlock Deck
Unlock for access to all 152 flashcards in this deck.
Unlock Deck
k this deck
39
When carmakers began to cut the costs of producing cars by designing the chassis, engines, and transmissions so that different models could be produced on the same assembly line, production costs fell $240 per car. This idea best illustrates:
A)economies of scale.
B)diseconomies of scale.
C)constant returns to scale.
D)diminishing marginal product.
A)economies of scale.
B)diseconomies of scale.
C)constant returns to scale.
D)diminishing marginal product.
Unlock Deck
Unlock for access to all 152 flashcards in this deck.
Unlock Deck
k this deck
40
A firm can use 5 workers and 10 machines, 7 workers and 9 machines, or 8 workers and 9 machines to produce four cars. If each worker costs $200 and each machine is rented for $50, the economically efficient input combination is:
A)5 workers and 10 machines.
B)7 workers and 9 machines.
C)8 workers and 9 machines.
D)12 workers and 19 machines.
A)5 workers and 10 machines.
B)7 workers and 9 machines.
C)8 workers and 9 machines.
D)12 workers and 19 machines.
Unlock Deck
Unlock for access to all 152 flashcards in this deck.
Unlock Deck
k this deck
41
The graph shown exhibits diseconomies of scale:
A)in region a.
B)in region b.
C)in region c.
D)over the entire range of output.
A)in region a.
B)in region b.
C)in region c.
D)over the entire range of output.
Unlock Deck
Unlock for access to all 152 flashcards in this deck.
Unlock Deck
k this deck
42
The upward-sloping part of the long-run average cost curve is explained by:
A)indivisible setup costs.
B)diseconomies of scale.
C)output levels that exceed the minimum efficient level of production.
D)decreasing marginal productivity.
A)indivisible setup costs.
B)diseconomies of scale.
C)output levels that exceed the minimum efficient level of production.
D)decreasing marginal productivity.
Unlock Deck
Unlock for access to all 152 flashcards in this deck.
Unlock Deck
k this deck
43
Refer to the graph shown. If the seller expects a price of $48:
A)it is not economically feasible to produce any level of output.
B)any level of output is profitable.
C)the minimum level of profitable production is 18.
D)the minimum level of profitable production is 21.
A)it is not economically feasible to produce any level of output.
B)any level of output is profitable.
C)the minimum level of profitable production is 18.
D)the minimum level of profitable production is 21.
Unlock Deck
Unlock for access to all 152 flashcards in this deck.
Unlock Deck
k this deck
44
The level of production that minimizes long-run average total costs is referred to as the:
A)technically efficient level of production.
B)economically efficient level of production.
C)minimum efficient level of production.
D)minimum profitable level of production.
A)technically efficient level of production.
B)economically efficient level of production.
C)minimum efficient level of production.
D)minimum profitable level of production.
Unlock Deck
Unlock for access to all 152 flashcards in this deck.
Unlock Deck
k this deck
45
Refer to the graph shown. The output range in region c is associated with:
A)diminishing marginal productivity.
B)constant returns to scale.
C)economies of scale.
D)diseconomies of scale.
A)diminishing marginal productivity.
B)constant returns to scale.
C)economies of scale.
D)diseconomies of scale.
Unlock Deck
Unlock for access to all 152 flashcards in this deck.
Unlock Deck
k this deck
46
Diseconomies of scale are associated with:
A)an upward-sloping long-run average cost curve.
B)an upward-sloping short-run average cost curve.
C)a downward-sloping long-run average cost curve.
D)a downward-sloping short-run average cost curve.
A)an upward-sloping long-run average cost curve.
B)an upward-sloping short-run average cost curve.
C)a downward-sloping long-run average cost curve.
D)a downward-sloping short-run average cost curve.
Unlock Deck
Unlock for access to all 152 flashcards in this deck.
Unlock Deck
k this deck
47
The long-run average cost of producing 12 units of output is $54; the long-run average cost of producing 13 units is $56. These numbers illustrate:
A)economies of scale.
B)diseconomies of scale.
C)economies of scope.
D)diminishing marginal productivity.
A)economies of scale.
B)diseconomies of scale.
C)economies of scope.
D)diminishing marginal productivity.
Unlock Deck
Unlock for access to all 152 flashcards in this deck.
Unlock Deck
k this deck
48
Generally, as the size of a firm increases:
A)team spirit increases.
B)marginal productivity rises.
C)economies of scope fall.
D)monitoring costs increase.
A)team spirit increases.
B)marginal productivity rises.
C)economies of scope fall.
D)monitoring costs increase.
Unlock Deck
Unlock for access to all 152 flashcards in this deck.
Unlock Deck
k this deck
49
Refer to the graph shown. The output range in region a is associated with:
A)increasing marginal productivity.
B)constant returns to scale.
C)economies of scale.
D)diseconomies of scale.
A)increasing marginal productivity.
B)constant returns to scale.
C)economies of scale.
D)diseconomies of scale.
Unlock Deck
Unlock for access to all 152 flashcards in this deck.
Unlock Deck
k this deck
50
The graph shown exhibits constant returns to scale:
A)in region a.
B)in region b.
C)in region c.
D)in regions a, b, and c.
A)in region a.
B)in region b.
C)in region c.
D)in regions a, b, and c.
Unlock Deck
Unlock for access to all 152 flashcards in this deck.
Unlock Deck
k this deck
51
Constant returns to scale means that long-run:
A)ATC increases as output increases.
B)ATC decreases as output decreases.
C)ATC rises and then falls as output increases.
D)ATC does not change as output increases.
A)ATC increases as output increases.
B)ATC decreases as output decreases.
C)ATC rises and then falls as output increases.
D)ATC does not change as output increases.
Unlock Deck
Unlock for access to all 152 flashcards in this deck.
Unlock Deck
k this deck
52
Refer to the graph shown. The output range in region b is associated with:
A)diminishing marginal productivity.
B)constant returns to scale.
C)economies of scale.
D)diseconomies of scale.
A)diminishing marginal productivity.
B)constant returns to scale.
C)economies of scale.
D)diseconomies of scale.
Unlock Deck
Unlock for access to all 152 flashcards in this deck.
Unlock Deck
k this deck
53
Diseconomies of scale are associated with:
A)decreasing per-unit costs.
B)improved team spirit.
C)the short run.
D)monitoring costs.
A)decreasing per-unit costs.
B)improved team spirit.
C)the short run.
D)monitoring costs.
Unlock Deck
Unlock for access to all 152 flashcards in this deck.
Unlock Deck
k this deck
54
Which of the following provides the best explanation for diseconomies of scale?
A)Increased specialization
B)Diminishing marginal productivity
C)Monitoring costs
D)Indivisible setup costs
A)Increased specialization
B)Diminishing marginal productivity
C)Monitoring costs
D)Indivisible setup costs
Unlock Deck
Unlock for access to all 152 flashcards in this deck.
Unlock Deck
k this deck
55
Using 100 workers and 10 machines, a firm can produce 10,000 units of output; using 250 workers and 25 machines, the firm produces 21,000 units of output. These facts are best explained by:
A)economies of scope.
B)diseconomies of scale.
C)economies of scale.
D)diminishing marginal productivity.
A)economies of scope.
B)diseconomies of scale.
C)economies of scale.
D)diminishing marginal productivity.
Unlock Deck
Unlock for access to all 152 flashcards in this deck.
Unlock Deck
k this deck
56
Which of the following provides the best explanation for diseconomies of scale?
A)The presence of fixed inputs
B)Reduced monitoring costs
C)Loss of team spirit
D)Indivisible setup costs
A)The presence of fixed inputs
B)Reduced monitoring costs
C)Loss of team spirit
D)Indivisible setup costs
Unlock Deck
Unlock for access to all 152 flashcards in this deck.
Unlock Deck
k this deck
57
The long-run average cost curve is typically:
A)downward-sloping at first but then upward-sloping.
B)upward-sloping at first but then downward-sloping.
C)always downward-sloping.
D)always upward-sloping.
A)downward-sloping at first but then upward-sloping.
B)upward-sloping at first but then downward-sloping.
C)always downward-sloping.
D)always upward-sloping.
Unlock Deck
Unlock for access to all 152 flashcards in this deck.
Unlock Deck
k this deck
58
Refer to the graph shown. The graph exhibits economies of scale:
A)in region a.
B)in region b.
C)in region c.
D)over the entire range of output.
A)in region a.
B)in region b.
C)in region c.
D)over the entire range of output.
Unlock Deck
Unlock for access to all 152 flashcards in this deck.
Unlock Deck
k this deck
59
Which of the following is most likely an example of diseconomies of scale?
A)The per-unit costs on Excel Publishing Company's manuals fell after it received a large order from the government.
B)Alpha-Beta Inc. raised its price by 10 percent after a 5 percent increase in production costs.
C)Widget Manufacturing doubled its production by opening a new plant that was identical to its old plant.
D)The XYZ Co. increased production capacity by 25 percent and experienced a 30 percent increase in its total cost.
Unlock Deck
Unlock for access to all 152 flashcards in this deck.
Unlock Deck
k this deck
60
At the minimum efficient level of production:
A)a firm will be at the only technically efficient level of production.
B)the market has expanded sufficiently to take advantage of all economies of scale.
C)production has expanded to make the firm profitable at any price.
D)a firm will be at the only short-run economically efficient level of production.
Unlock Deck
Unlock for access to all 152 flashcards in this deck.
Unlock Deck
k this deck
61
Refer to the graph shown. A firm that produces 900 units of output using the plant size associated with SATC2 minimizes:
A)both long-run and short-run average total cost.
B)long-run average total cost only.
C)short-run average total cost only.
D)neither long-run nor short-run average total cost.
A)both long-run and short-run average total cost.
B)long-run average total cost only.
C)short-run average total cost only.
D)neither long-run nor short-run average total cost.
Unlock Deck
Unlock for access to all 152 flashcards in this deck.
Unlock Deck
k this deck
62
The upward-sloping portion of the long-run average total cost curve is caused by:
A)indivisible setup costs.
B)diseconomies of scale.
C)the absence of fixed inputs.
D)the presence of fixed inputs.
A)indivisible setup costs.
B)diseconomies of scale.
C)the absence of fixed inputs.
D)the presence of fixed inputs.
Unlock Deck
Unlock for access to all 152 flashcards in this deck.
Unlock Deck
k this deck
63
The short-run average total cost curve is generally assumed to be:
A)U-shaped.
B)horizontal.
C)upward-sloping.
D)downward-sloping.
A)U-shaped.
B)horizontal.
C)upward-sloping.
D)downward-sloping.
Unlock Deck
Unlock for access to all 152 flashcards in this deck.
Unlock Deck
k this deck
64
A firm's average cost increases as it increases its output by expanding its plant and hiring additional workers (its only inputs to production). The firm's owner blames the increase in per-unit costs on the law of diminishing marginal productivity. The owner's reasoning is:
A)correct because some inputs are fixed in the long run.
B)incorrect because economies of scale are present.
C)correct because marginal productivity must decrease in the short run.
D)incorrect because all inputs are varied in the example.
A)correct because some inputs are fixed in the long run.
B)incorrect because economies of scale are present.
C)correct because marginal productivity must decrease in the short run.
D)incorrect because all inputs are varied in the example.
Unlock Deck
Unlock for access to all 152 flashcards in this deck.
Unlock Deck
k this deck
65
The relationship between long-run and short-run average total costs is known as the:
A)efficiency relationship.
B)technical relationship.
C)economic relationship.
D)envelope relationship.
A)efficiency relationship.
B)technical relationship.
C)economic relationship.
D)envelope relationship.
Unlock Deck
Unlock for access to all 152 flashcards in this deck.
Unlock Deck
k this deck
66
The long-run average cost curve is horizontal when production exhibits:
A)diminishing marginal returns.
B)diseconomies of scale.
C)economies of scale.
D)constant returns to scale.
A)diminishing marginal returns.
B)diseconomies of scale.
C)economies of scale.
D)constant returns to scale.
Unlock Deck
Unlock for access to all 152 flashcards in this deck.
Unlock Deck
k this deck
67
Which of the following is most likely an example of constant returns to scale?
A)The per-unit costs of Excel Publishing Company's manuals fell after a large order was received from the government.
B)Alpha-Beta Inc. raised its price 10 percent after a 5 percent increase in production costs.
C)Widget Manufacturing doubled its production by opening a new plant that was identical to its old plant.
D)The XYZ Co. increased production 25 percent and experienced a 30 percent increase in its total cost.
Unlock Deck
Unlock for access to all 152 flashcards in this deck.
Unlock Deck
k this deck
68
Constant returns to scale are associated with a:
A)horizontal long-run average cost curve.
B)horizontal short-run average cost curve.
C)downward-sloping long-run average cost curve.
D)downward-sloping short-run average cost curve.
A)horizontal long-run average cost curve.
B)horizontal short-run average cost curve.
C)downward-sloping long-run average cost curve.
D)downward-sloping short-run average cost curve.
Unlock Deck
Unlock for access to all 152 flashcards in this deck.
Unlock Deck
k this deck
69
Long-run average costs at any output level will:
A)always be less than or equal to short-run average total costs.
B)always be greater than or equal to short-run average total costs.
C)always be equal to short-run average total costs.
D)sometimes be less than and sometimes greater than short-run average total costs.
A)always be less than or equal to short-run average total costs.
B)always be greater than or equal to short-run average total costs.
C)always be equal to short-run average total costs.
D)sometimes be less than and sometimes greater than short-run average total costs.
Unlock Deck
Unlock for access to all 152 flashcards in this deck.
Unlock Deck
k this deck
70
The upward-sloping portion of the short-run average total cost curve is caused by:
A)indivisible setup costs.
B)diseconomies of scale.
C)the absence of fixed inputs.
D)the presence of fixed inputs.
A)indivisible setup costs.
B)diseconomies of scale.
C)the absence of fixed inputs.
D)the presence of fixed inputs.
Unlock Deck
Unlock for access to all 152 flashcards in this deck.
Unlock Deck
k this deck
71
In the long run:
A)all inputs are fixed.
B)all inputs are variable.
C)some inputs are not variable.
D)per-unit costs are fixed.
A)all inputs are fixed.
B)all inputs are variable.
C)some inputs are not variable.
D)per-unit costs are fixed.
Unlock Deck
Unlock for access to all 152 flashcards in this deck.
Unlock Deck
k this deck
72
The long-run average cost of producing 19 units of output is $56, and the long-run average cost of producing 20 units is also $56. These numbers illustrate:
A)decreasing marginal productivity.
B)constant returns to scale.
C)economies of scale.
D)diseconomies of scale.
A)decreasing marginal productivity.
B)constant returns to scale.
C)economies of scale.
D)diseconomies of scale.
Unlock Deck
Unlock for access to all 152 flashcards in this deck.
Unlock Deck
k this deck
73
Which of the following is an accurate statement about the envelope relationship?
A)At the planned output level, short-run average total cost equals long-run average cost, but at all other output levels, short-run average total cost is lower than long-run average cost.
B)At the planned output level, short-run average total cost equals long-run average cost, but at all other output levels, short-run average total cost is higher than long-run average cost.
C)The long-run average cost curve touches the minimum point of each short-run average total cost curve.
D)The long-run average cost curve is identical to the lowest short-run average cost curve.
Unlock Deck
Unlock for access to all 152 flashcards in this deck.
Unlock Deck
k this deck
74
Refer to the graph shown. If the firm wants to produce 900 units of output, it should use the plant size represented by:
A)SATC1.
B)SATC2.
C)SATC3.
D)SATC4.
A)SATC1.
B)SATC2.
C)SATC3.
D)SATC4.
Unlock Deck
Unlock for access to all 152 flashcards in this deck.
Unlock Deck
k this deck
75
Refer to the graph shown. A firm that produces 900 units of output using the plant size associated with SATC3 minimizes:
A)both long-run and short-run average total cost.
B)long-run average total cost only.
C)short-run average total cost only.
D)neither long-run nor short-run average total cost.
A)both long-run and short-run average total cost.
B)long-run average total cost only.
C)short-run average total cost only.
D)neither long-run nor short-run average total cost.
Unlock Deck
Unlock for access to all 152 flashcards in this deck.
Unlock Deck
k this deck
76
Refer to the graph shown. If a firm expected to produce 900 units when it built its plant but now desires to reduce its output to 600 units in the short run, it will use the plant size represented by:
A)SATC1.
B)SATC2.
C)SATC3.
D)SATC4.
A)SATC1.
B)SATC2.
C)SATC3.
D)SATC4.
Unlock Deck
Unlock for access to all 152 flashcards in this deck.
Unlock Deck
k this deck
77
Refer to the graph shown. If a firm expected to produce 300 units when it built its plant but now desires to expand its output to 500 units in the short run, it will use the plant size represented by:
A)SATC1.
B)SATC2.
C)SATC3.
D)SATC4.
A)SATC1.
B)SATC2.
C)SATC3.
D)SATC4.
Unlock Deck
Unlock for access to all 152 flashcards in this deck.
Unlock Deck
k this deck
78
Refer to the graph shown. If a firm wants to produce 300 units of output, it should use the plant size represented by:
A)SATC1.
B)SATC2.
C)SATC3.
D)SATC4.
A)SATC1.
B)SATC2.
C)SATC3.
D)SATC4.
Unlock Deck
Unlock for access to all 152 flashcards in this deck.
Unlock Deck
k this deck
79
Which of the following provides the best explanation for constant returns to scale?
A)Replication of production techniques
B)Diminishing marginal product
C)Increasing marginal product
D)Constant marginal product
A)Replication of production techniques
B)Diminishing marginal product
C)Increasing marginal product
D)Constant marginal product
Unlock Deck
Unlock for access to all 152 flashcards in this deck.
Unlock Deck
k this deck
80
Refer to the graph shown. A firm planning to produce 1,500 units of output would choose the scale of operation represented by:
A)SATC1.
B)SATC2.
C)SATC3.
D)SATC4.
A)SATC1.
B)SATC2.
C)SATC3.
D)SATC4.
Unlock Deck
Unlock for access to all 152 flashcards in this deck.
Unlock Deck
k this deck
Unlock Deck
Unlock for access to all 152 flashcards in this deck.


