Deck 17: Comparative Advantage, Exchange Rates, and Globalization
Full screen (f)
Question
Question
Question
Question
Question
Question
Question
Question
Question
Question
Question
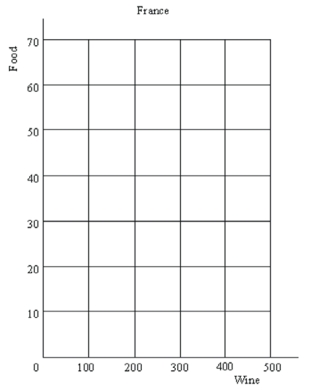
Consider the following information about production of wine and food in England and France: 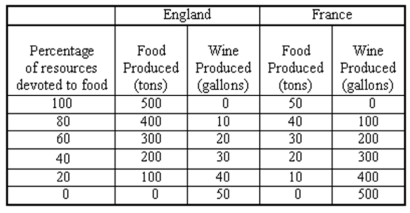 (a) Using the grids below, plot each country's production possibilities curve.
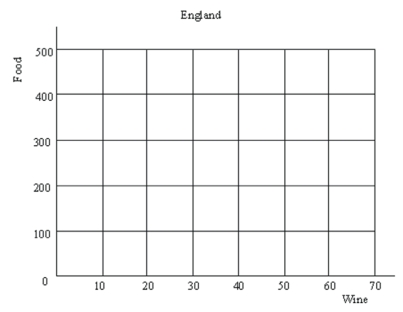
 (b) Which country has a comparative advantage in the production of food? Of wine? Explain.
(c) Suppose that currently England and France are not trading with each other.England is producing (and consuming) 200 tons of food and 30 gallons of wine.France is producing (and consuming) 30 tons of food and 200 gallons of wine.As an international trader, how could you take advantage of this situation and make the big bucks?
(a) Using the grids below, plot each country's production possibilities curve. (b) Which country has a comparative advantage in the production of food? Of wine? Explain.(c) Suppose that currently England and France are not trading with each other.England is producing (and consuming) 200 tons of food and 30 gallons of wine.France is producing (and consuming) 30 tons of food and 200 gallons of wine.As an international trader, how could you take advantage of this situation and make the big bucks?
Question

Unlock Deck
Sign up to unlock the cards in this deck!
Unlock Deck
Unlock Deck
1/12
Play
Full screen (f)
Deck 17: Comparative Advantage, Exchange Rates, and Globalization
1
What is the resource curse?
The resource curse is the paradox that countries with an abundance of resources tend to have lower economic growth and more unemployment than countries with fewer natural resources.It occurs because the resource curse tends to keep a country's currency highly valued, which makes other types of production within that country uncompetitive.
2
In this problem you will demonstrate your understanding of the principles of comparative advantage.You will be given data that correspond to points on the production possibility curve of two countries.From this data, you will be asked to draw the graph of the production possibility curves.For simplicity, assume the production possibility curves of these countries are straight lines.To draw these production possibility curves you need only two points on your graph.A straight line connecting these points, and extended to the axes, will represent the production possibility curve.
(a) Country A and country B are potential trading partners.Each country produces two goods: fish and wine.If country A devotes all its resources to producing fish it can produce 1,000 fish, and if it devotes all its resources to producing wine, it can produce 2,000 bottles of wine.Draw the production possibility curve for country A.In country A, what is the opportunity cost of one bottle of wine in terms of fish?
(b) If country B devotes all its resources to producing fish it can produce 3,000 fish, and if it devotes all its resources to producing wine it can produce 3,000 bottles of wine.Draw the production possibility curve for country B.In country B, what is the opportunity cost of one bottle of wine in terms of fish?
(c) Do you see any possibility of gains from trade between these two countries? Does country A have any advantage in producing either wine or fish and trading for the other good? Is this advantage an absolute or a comparative advantage?
(d) Suggest a trade between these two countries which will make them both better off.Illustrate on their production possibility curves how this will make both countries better off, by allowing them to consume a mix of wine and fish that is outside their production possibility curves.
(a) See the graph below.For country A the opportunity cost of one bottle of wine is half a fish.Each fish forgone frees up resources sufficient to make two bottles of wine.
(b) In country B the opportunity cost of one bottle of wine is one fish.Each fish forgone frees up resources sufficient to make one bottle of wine.
(c) Country A has a comparative advantage in wine (which means that country B has a comparative advantage in fish).The opportunity cost of a bottle of wine for A is half a fish; for B it is 1 fish.
(d) Suppose before trade, country A was producing and consuming 500 fish and 1000 bottles of wine.Country B was producing and consuming 1,500 fish and 1500 bottles of wine.Propose the following trade: Country A produces only wine (2,000 bottles) and offers to trade 1,000 bottles of wine for 750 fish.Country B responds by decreasing wine production by 750 bottles and increasing fish production by 750 fish.Country B then trades the 750 fish for the 1,000 bottles of wine.As illustrated on the diagram, these trades leave both countries better off.By giving up the 500 fish it used to produce and consume itself, country A has produced 1,000 more bottles of wine, which it has traded for 750 fish.This leaves it with 1,000 bottles of wine and 750 fish for its own consumption, a point outside its production possibility frontier and preferred to the 1,000 bottles of wine/500 fish pretrade point.Country B has increased production of fish by 750 and reduced production of wine by 750 bottles.It has traded the additional 750 fish for 1,000 wine.Before, B was producing and consuming 1500 bottles of wine.Now wine production has been reduced to 750 bottles, but 1,000 bottles of wine have been acquired from country A, so country B is consuming 1,750 bottles of wine.Country B has increased fish production by 750 (to 2,250), trading all of the increase to A, so fish consumption in B remains at 1,500.So after trade B consumes 1,750 bottles of wine and 1,500 fish, which is outside B's production possibility curve and is preferred to the pretrade consumption of 1,500 bottles of wine and 1,500 fish.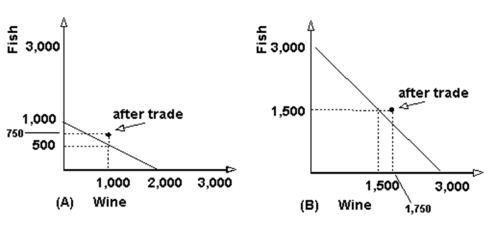
3
Is a small or large country likely to gain more by trading? Why?
A small country is likely to get more of the benefit from trade (once competition has set in).The reason for this is that more opportunities are opened up by trade for small countries than for large countries.
4
Explain the principle of comparative advantage.Does it tell us how the gains from trade will be distributed?
Unlock Deck
Unlock for access to all 12 flashcards in this deck.
Unlock Deck
k this deck
5
The United States dominates world markets for computer software, producing about a majority of the total world computer software, whereas Europe and Japan lag significantly behind.
(a) What possible reasons would account for this?
(b) Would you expect this to continue?
(a) What possible reasons would account for this?
(b) Would you expect this to continue?
Unlock Deck
Unlock for access to all 12 flashcards in this deck.
Unlock Deck
k this deck
6
What are sources of U.S.comparative advantage?
Unlock Deck
Unlock for access to all 12 flashcards in this deck.
Unlock Deck
k this deck
7
Suppose as a result of a recession and falling interest rates in the United States, European investors buy fewer U.S.financial assets.Conversely, U.S.investors decide to buy more European stocks.Use supply/demand analysis to show graphically why the value of the euro relative to the dollar increases.
Unlock Deck
Unlock for access to all 12 flashcards in this deck.
Unlock Deck
k this deck
8
What is meant by the dollar-euro exchange rate? In what market is this rate determined? What factors will cause the dollar value of the euro to rise? What factors will cause the dollar value of the euro to fall?
Unlock Deck
Unlock for access to all 12 flashcards in this deck.
Unlock Deck
k this deck
9
Explain why economists' and laypeople's' views of trade differ.
Unlock Deck
Unlock for access to all 12 flashcards in this deck.
Unlock Deck
k this deck
10
Seamus "Skip" Cavanaugh often travels between Switzerland and Ireland.During his travels he has noticed that the two countries rarely trade with each other.He also noticed that the opportunity cost of producing a watch in Switzerland is 1/5 of a sweater and that the opportunity cost of producing a watch in Ireland is 5 sweaters.At the current time Switzerland's production is 30 sweaters and 200 watches, while Ireland's production is 200 sweaters and 30 watches.
(a) Which country has a comparative advantage in the production of which good? Explain.
(b) Describe how Skip can make a profit.
(c) Illustrate your answer to part (b) with a numerical example.
(a) Which country has a comparative advantage in the production of which good? Explain.
(b) Describe how Skip can make a profit.
(c) Illustrate your answer to part (b) with a numerical example.
Unlock Deck
Unlock for access to all 12 flashcards in this deck.
Unlock Deck
k this deck
11
Consider the following information about production of wine and food in England and France: (a) Using the grids below, plot each country's production possibilities curve. (b) Which country has a comparative advantage in the production of food? Of wine? Explain.
(c) Suppose that currently England and France are not trading with each other.England is producing (and consuming) 200 tons of food and 30 gallons of wine.France is producing (and consuming) 30 tons of food and 200 gallons of wine.As an international trader, how could you take advantage of this situation and make the big bucks?
(a) Using the grids below, plot each country's production possibilities curve. (b) Which country has a comparative advantage in the production of food? Of wine? Explain.(c) Suppose that currently England and France are not trading with each other.England is producing (and consuming) 200 tons of food and 30 gallons of wine.France is producing (and consuming) 30 tons of food and 200 gallons of wine.As an international trader, how could you take advantage of this situation and make the big bucks?
Unlock Deck
Unlock for access to all 12 flashcards in this deck.
Unlock Deck
k this deck
12
Why does the distribution of costs and benefits from trade sometimes result in calls for trade restrictions?
Unlock Deck
Unlock for access to all 12 flashcards in this deck.
Unlock Deck
k this deck
Unlock Deck
Unlock for access to all 12 flashcards in this deck.


