Deck 4: Supply and Demand
Full screen (f)
Question
Question
Question
Question
Question
Consider the following supply table, which represents the supply of comic books by Bill, Judy, and Sally. 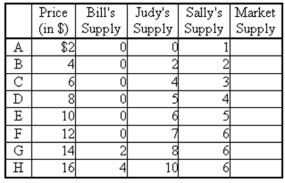 (a) Fill in the "market supply" column of the above table.
(b) Use the grid below to draw the supply curves for comic books of Bill, Judy, and Sally.Then draw in the market supply curve.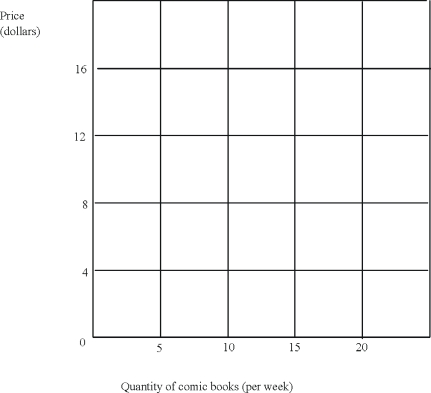 (c) Compare the supply curve you have drawn for Sally and Judy.Which of these two is more influenced by increases in the price of comic books? Explain.
(a) Fill in the "market supply" column of the above table.(b) Use the grid below to draw the supply curves for comic books of Bill, Judy, and Sally.Then draw in the market supply curve.
(c) Compare the supply curve you have drawn for Sally and Judy.Which of these two is more influenced by increases in the price of comic books? Explain. Question
Question
Question
The diagram below represents the producer side of the market for skateboards in New York.The current price of skateboards is PA.Each of the events described below will have some impact on the supply of skateboards.For each event, draw a picture to illustrate the effect of the event.Be sure to explain your pictures using pertinent economic terminology ("movement along" or "change in quantity"). 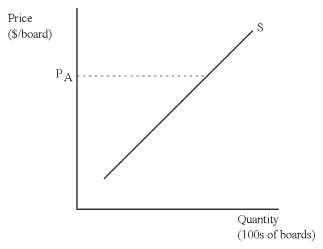 (a) A drop in the price of skateboards.
(b) An increase in the price of wheels used in the manufacturing of skateboards.
(a) A drop in the price of skateboards.(b) An increase in the price of wheels used in the manufacturing of skateboards.
Question
The diagram below represents the consumer side of the market for skateboards in New York.The current price of skateboards is PA.Each of the events described below will have some impact on the demand for skateboards.For each event, draw a picture to illustrate the effect of the event.Be sure to explain your pictures using pertinent economic terminology ("movement along" or "shift in"). 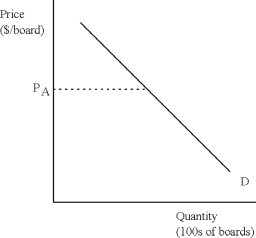 (a) A drop in the price of skateboards.
(b) A drop in the price of kneepads.
(c) A decline in income.
(a) A drop in the price of skateboards.(b) A drop in the price of kneepads.
(c) A decline in income.
Question
Question
Question
Question
Consider the following demand table, which represents the demand for comic books by John, Liz, and Alex. 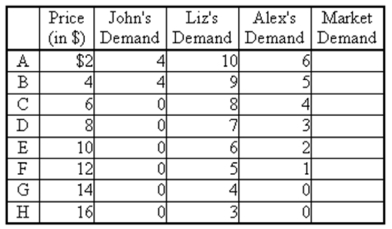 (a) Fill in the "market demand" column of the above table.
(b) Use the grid below to draw the demand curves for comic books of John, Liz, and Alex.Then draw in the market demand curve.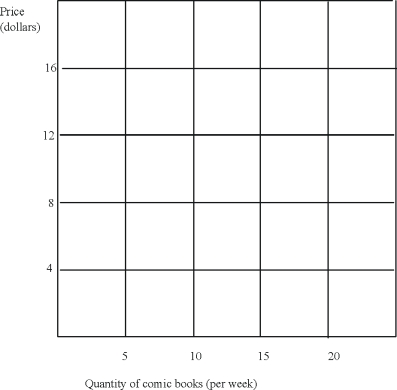 (c) Notice that Liz's demand is everywhere to the right of Alex's demand.Can you conclude from this that Liz likes comic books more than Alex does? Explain.
(a) Fill in the "market demand" column of the above table.(b) Use the grid below to draw the demand curves for comic books of John, Liz, and Alex.Then draw in the market demand curve.
(c) Notice that Liz's demand is everywhere to the right of Alex's demand.Can you conclude from this that Liz likes comic books more than Alex does? Explain. Question
Question
Question
Question
Given the following individual demand tables for individuals A-D, construct a market demand curve. 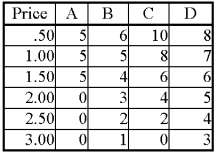
Question
Question
Question
Question
Question
Question
The table below shows the quantity demanded and quantity supplied of DVDs at each price level. 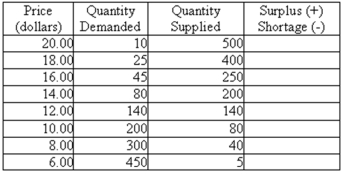 (a) Fill out the column entitled Surplus/Shortage.
(b) What are the equilibrium price and equilibrium quantity in this market?
(c) Suppose that consumers' taste changed in favor of DVDs due to their high quality.What happens at the original equilibrium price level calculated in Part (b)?
(d) Suppose that advances in technology reduced the production cost of DVD players.What happens at the original equilibrium price level calculated in Part (b)?
(a) Fill out the column entitled Surplus/Shortage.(b) What are the equilibrium price and equilibrium quantity in this market?
(c) Suppose that consumers' taste changed in favor of DVDs due to their high quality.What happens at the original equilibrium price level calculated in Part (b)?
(d) Suppose that advances in technology reduced the production cost of DVD players.What happens at the original equilibrium price level calculated in Part (b)?
Question
Consider the supply and demand schedules below to answer the questions that follow: 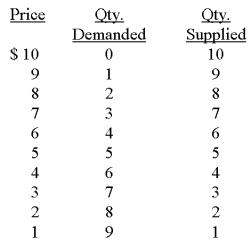 (a) In a free market, what will the equilibrium price be?
(b) What will the equilibrium quantity demanded and quantity supplied be?
(c) If price were $2, what would happen? (Discuss in terms of adjustment to equilibrium.)
(d) If price were $7, what would happen? (Discuss in terms of adjustment to equilibrium.)
(e) If price were $5, what would happen? (Discuss in terms of adjustment to equilibrium.)
(a) In a free market, what will the equilibrium price be?(b) What will the equilibrium quantity demanded and quantity supplied be?
(c) If price were $2, what would happen? (Discuss in terms of adjustment to equilibrium.)
(d) If price were $7, what would happen? (Discuss in terms of adjustment to equilibrium.)
(e) If price were $5, what would happen? (Discuss in terms of adjustment to equilibrium.)
Question
Given the following individual supply tables for individuals A-D,
(a) Construct a market supply curve.
(b) Demonstrate a movement along the market supply curve.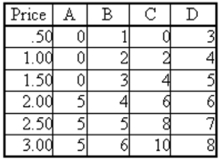
(a) Construct a market supply curve.
(b) Demonstrate a movement along the market supply curve.
Question
The market for Columbian coffee beans is given in the diagram below.The market is currently in equilibrium with a price of P0 and a quantity exchanged of Q0.Suppose that the Columbian government takes over the production and distribution of all coffee beans grown in Columbia.In an effort to increase revenue from the sales of coffee beans, the government decides to raise the price above P0.Describe why it would take more effort for the government to raise the price to P2 than it would for it raise the price to P1. 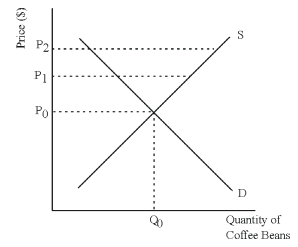
Question
Question
Question
Question
Consider the following supply and demand picture of the market for Oreos.Note that the market is currently in equilibrium, with a price of P* and a quantity exchanged of Q*. 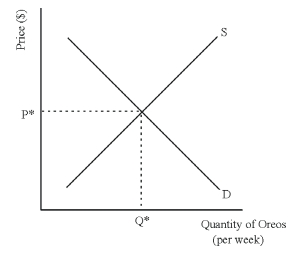 For each of the scenarios below, draw a picture that illustrates the impact on price and quantity exchanged.Explain each of your pictures by describing what is happening to the supply side of the market.
(a) The price of Hydrox cookies goes down.
(b) Due to a disastrous growing season, the price of cocoa triples.
For each of the scenarios below, draw a picture that illustrates the impact on price and quantity exchanged.Explain each of your pictures by describing what is happening to the supply side of the market.(a) The price of Hydrox cookies goes down.
(b) Due to a disastrous growing season, the price of cocoa triples.
Question
Consider the following supply and demand diagram for Tootsie Rolls.Note that the market is currently in equilibrium, with a price of P* and a quantity exchanged of Q*. 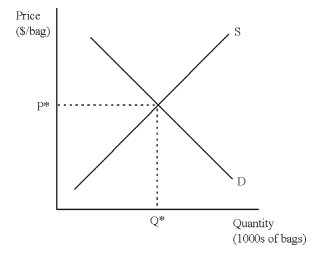 For each of the scenarios below, draw a picture that illustrates the impact on price and quantity exchanged.Explain each of your pictures by describing what is happening to the demand side of the market.
(a) The American Association of Chocolate Lovers designates the Tootsie Roll as its official candy.
(b) The Tootsie Roll Company computerizes their Tootsie Roll manufacturing plant, lowering unit costs of production.
For each of the scenarios below, draw a picture that illustrates the impact on price and quantity exchanged.Explain each of your pictures by describing what is happening to the demand side of the market.(a) The American Association of Chocolate Lovers designates the Tootsie Roll as its official candy.
(b) The Tootsie Roll Company computerizes their Tootsie Roll manufacturing plant, lowering unit costs of production.

Unlock Deck
Sign up to unlock the cards in this deck!
Unlock Deck
Unlock Deck
1/31
Play
Full screen (f)
Deck 4: Supply and Demand
1
In one year, the price of soybeans was $3.50 a bushel, and the Jones family farm planted 7,500 acres of them.In the following year, although the price of soybeans fell to $3.25 a bushel, the Jones family farm planted 8,200 acres of them.Use the concepts of a shift in the supply curve versus a movement along the supply curve to explain why this increase in soybean acreage does not represent a violation of the law of supply.
Most likely, the assumption of other things constant was violated, not the law of supply.From one year to the next, any one of the following could have resulted in an increase in supply that would have more than offset the decrease in quantity supplied caused by the fall in the price of soybeans.The cost of fertilizer or other inputs may have fallen.There may have been a significant increase in pesticide technology.Farmers may expect that foreign demand will pick up and soybean prices will rise in the future.Finally, the government may have begun a program to subsidize soybean production.All of these things could cause a shift in the entire supply curve.The 25-cent decrease in price of soybeans probably caused a downward movement along the supply curve; but that movement was more than offset by the outward shift of the entire curve.
2
John and Steve are roommates at Siberian University.They are planning to have a party this coming weekend and need to go shopping for snacks.They know all of their friends like nacho cheese flavored tortilla chips, so that is the only type of snack they plan to buy.After pooling their cash, they take $18 and head out to the nearest grocery store.Walking down the chip aisle, they fill their cart with 6 bags of Tostada brand chips at $3 per 14-ounce bag.Continuing down the chip aisle, they see Durango brand chips are available at $2 per 14-ounce bag, so they put all of the Tostada chips back and instead purchase 9 bags of Durango chips.Is John and Steve's behavior consistent with "the law of demand"? Explain.(Extra Credit: If they hadn't changed their minds, would they have violated the law of demand?)
Yes, John and Steve's behavior is consistent with the law of demand.The law of demand states that more of a good will be demanded the lower its price, other things constant.John and Steve increased the number of bags of chips purchased from 6 to 9 as the price went down from $3 per bag to $2 per bag.The specific things being held constant are the amount of money John and Steve have to spend and the quality of the two brands of chips (i.e., Tostada and Durango chips taste the same).(If they hadn't changed their minds they would not have necessarily violated the law of demand if they do not believe Durango chips are as good as Tostada chips.)
3
Demonstrate graphically and explain the difference between a decrease in the quantity supplied and a decrease in supply.Describe what might have caused each to occur.
A decrease in the quantity supplied refers to moving downward along a supply curve as illustrated by the movement from point B to point A in the diagram below.This movement is caused by a decrease in the price of the item being supplied. 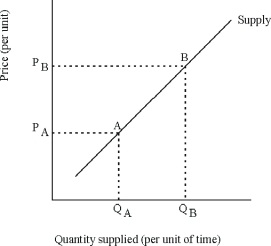 A decrease in supply refers to a leftward shift of the entire supply curve (from S0 to S1) as illustrated by the movement from point A to point B at price P0 in the diagram below.This movement is the result of a change in one of the shift factors.For example, a tax on the sale of a good levied on sellers will cause the supply curve to shift leftward.
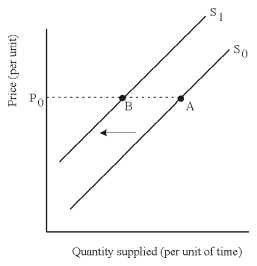
A decrease in supply refers to a leftward shift of the entire supply curve (from S0 to S1) as illustrated by the movement from point A to point B at price P0 in the diagram below.This movement is the result of a change in one of the shift factors.For example, a tax on the sale of a good levied on sellers will cause the supply curve to shift leftward. 4
Explain what it means to say that the cotton market is in "equilibrium." What forces (other than market forces) can be involved in determining the equilibrium price of cotton?
Unlock Deck
Unlock for access to all 31 flashcards in this deck.
Unlock Deck
k this deck
5
Consider the following supply table, which represents the supply of comic books by Bill, Judy, and Sally. (a) Fill in the "market supply" column of the above table.
(b) Use the grid below to draw the supply curves for comic books of Bill, Judy, and Sally.Then draw in the market supply curve. (c) Compare the supply curve you have drawn for Sally and Judy.Which of these two is more influenced by increases in the price of comic books? Explain.
(a) Fill in the "market supply" column of the above table.(b) Use the grid below to draw the supply curves for comic books of Bill, Judy, and Sally.Then draw in the market supply curve.
(c) Compare the supply curve you have drawn for Sally and Judy.Which of these two is more influenced by increases in the price of comic books? Explain. Unlock Deck
Unlock for access to all 31 flashcards in this deck.
Unlock Deck
k this deck
6
Use examples to demonstrate why the ability of consumers and producers to substitute explains the behavior that we call the "Law of Demand" and the "Law of Supply"?
Unlock Deck
Unlock for access to all 31 flashcards in this deck.
Unlock Deck
k this deck
7
What is meant by "the fallacy of composition"? Because of the fallacy of composition, it is not possible to apply the microeconomic analysis of individual firms and consumers directly to the macroeconomic analysis of entire nations.Explain why this is so.
Unlock Deck
Unlock for access to all 31 flashcards in this deck.
Unlock Deck
k this deck
8
The diagram below represents the producer side of the market for skateboards in New York.The current price of skateboards is PA.Each of the events described below will have some impact on the supply of skateboards.For each event, draw a picture to illustrate the effect of the event.Be sure to explain your pictures using pertinent economic terminology ("movement along" or "change in quantity"). (a) A drop in the price of skateboards.
(b) An increase in the price of wheels used in the manufacturing of skateboards.
(a) A drop in the price of skateboards.(b) An increase in the price of wheels used in the manufacturing of skateboards.
Unlock Deck
Unlock for access to all 31 flashcards in this deck.
Unlock Deck
k this deck
9
The diagram below represents the consumer side of the market for skateboards in New York.The current price of skateboards is PA.Each of the events described below will have some impact on the demand for skateboards.For each event, draw a picture to illustrate the effect of the event.Be sure to explain your pictures using pertinent economic terminology ("movement along" or "shift in"). (a) A drop in the price of skateboards.
(b) A drop in the price of kneepads.
(c) A decline in income.
(a) A drop in the price of skateboards.(b) A drop in the price of kneepads.
(c) A decline in income.
Unlock Deck
Unlock for access to all 31 flashcards in this deck.
Unlock Deck
k this deck
10
What are the "other things constant" when drawing a demand curve? What are the "other things constant" when drawing a supply curve?
Unlock Deck
Unlock for access to all 31 flashcards in this deck.
Unlock Deck
k this deck
11
How is the "Law of Demand" different from the "Law of Supply"? In what ways are they similar to each other?
Unlock Deck
Unlock for access to all 31 flashcards in this deck.
Unlock Deck
k this deck
12
Bob's Burgers charged $3.50 for a quarter-pound hamburger with all the fixin's, and sold 7,500 of them.The following year, although Bob raised the price to $3.75, sales of his burgers rose to 8,200.Use the concepts of a shift in the demand curve versus a movement along the demand curve to explain why this increase in sales does not represent a violation of the law of demand.
Unlock Deck
Unlock for access to all 31 flashcards in this deck.
Unlock Deck
k this deck
13
Consider the following demand table, which represents the demand for comic books by John, Liz, and Alex. (a) Fill in the "market demand" column of the above table.
(b) Use the grid below to draw the demand curves for comic books of John, Liz, and Alex.Then draw in the market demand curve. (c) Notice that Liz's demand is everywhere to the right of Alex's demand.Can you conclude from this that Liz likes comic books more than Alex does? Explain.
(a) Fill in the "market demand" column of the above table.(b) Use the grid below to draw the demand curves for comic books of John, Liz, and Alex.Then draw in the market demand curve.
(c) Notice that Liz's demand is everywhere to the right of Alex's demand.Can you conclude from this that Liz likes comic books more than Alex does? Explain. Unlock Deck
Unlock for access to all 31 flashcards in this deck.
Unlock Deck
k this deck
14
Demonstrate graphically and explain the difference between an increase in the quantity demanded and an increase in demand.Describe what might have caused each to occur.
Unlock Deck
Unlock for access to all 31 flashcards in this deck.
Unlock Deck
k this deck
15
Explain the following statement: "The invisible hand pushing toward a supply/demand equilibrium would be thwarted by social and political forces pushing in the other direction." Give examples of the social force and political force that the statement refers to.
Unlock Deck
Unlock for access to all 31 flashcards in this deck.
Unlock Deck
k this deck
16
Explain the error in the following statement: "For the past 10 years, the prices of automobiles have been rising and each year people have purchased more autos.Price and quantity demanded are directly related and the economists' law of demand is incorrect."
Unlock Deck
Unlock for access to all 31 flashcards in this deck.
Unlock Deck
k this deck
17
Given the following individual demand tables for individuals A-D, construct a market demand curve.
Unlock Deck
Unlock for access to all 31 flashcards in this deck.
Unlock Deck
k this deck
18
What are normal goods? What are inferior goods? Give an example of each type.
Unlock Deck
Unlock for access to all 31 flashcards in this deck.
Unlock Deck
k this deck
19
What is equilibrium? Explain what it means to say equilibrium is a characteristic of the model, not a state of the world.
Unlock Deck
Unlock for access to all 31 flashcards in this deck.
Unlock Deck
k this deck
20
Stuffed-Crust Pizza is a new pizza introduced by Pizza Hut.What happens to the equilibrium price and equilibrium quantity of Stuffed-Crust Pizza in each of the following situations?
a.Due to weather conditions, the output of wheat decreased and the price of wheat flour increased.
b.The price of beer decreased.
c.Domino's Pizza introduced a similar pizza that sold for $1 less than the one sold by Pizza Hut.
d.A recession reduced households' income.
e.A new oven technology reduced the time it takes to bake a pizza.
Unlock Deck
Unlock for access to all 31 flashcards in this deck.
Unlock Deck
k this deck
21
Demonstrate graphically and explain verbally the concept of excess demand.Is price above or below equilibrium?
Unlock Deck
Unlock for access to all 31 flashcards in this deck.
Unlock Deck
k this deck
22
Demonstrate graphically and explain verbally the concept of excess supply.Is price above or below equilibrium?
Unlock Deck
Unlock for access to all 31 flashcards in this deck.
Unlock Deck
k this deck
23
The table below shows the quantity demanded and quantity supplied of DVDs at each price level. (a) Fill out the column entitled Surplus/Shortage.
(b) What are the equilibrium price and equilibrium quantity in this market?
(c) Suppose that consumers' taste changed in favor of DVDs due to their high quality.What happens at the original equilibrium price level calculated in Part (b)?
(d) Suppose that advances in technology reduced the production cost of DVD players.What happens at the original equilibrium price level calculated in Part (b)?
(a) Fill out the column entitled Surplus/Shortage.(b) What are the equilibrium price and equilibrium quantity in this market?
(c) Suppose that consumers' taste changed in favor of DVDs due to their high quality.What happens at the original equilibrium price level calculated in Part (b)?
(d) Suppose that advances in technology reduced the production cost of DVD players.What happens at the original equilibrium price level calculated in Part (b)?
Unlock Deck
Unlock for access to all 31 flashcards in this deck.
Unlock Deck
k this deck
24
Consider the supply and demand schedules below to answer the questions that follow: (a) In a free market, what will the equilibrium price be?
(b) What will the equilibrium quantity demanded and quantity supplied be?
(c) If price were $2, what would happen? (Discuss in terms of adjustment to equilibrium.)
(d) If price were $7, what would happen? (Discuss in terms of adjustment to equilibrium.)
(e) If price were $5, what would happen? (Discuss in terms of adjustment to equilibrium.)
(a) In a free market, what will the equilibrium price be?(b) What will the equilibrium quantity demanded and quantity supplied be?
(c) If price were $2, what would happen? (Discuss in terms of adjustment to equilibrium.)
(d) If price were $7, what would happen? (Discuss in terms of adjustment to equilibrium.)
(e) If price were $5, what would happen? (Discuss in terms of adjustment to equilibrium.)
Unlock Deck
Unlock for access to all 31 flashcards in this deck.
Unlock Deck
k this deck
25
Given the following individual supply tables for individuals A-D,
(a) Construct a market supply curve.
(b) Demonstrate a movement along the market supply curve.
(a) Construct a market supply curve.
(b) Demonstrate a movement along the market supply curve.
Unlock Deck
Unlock for access to all 31 flashcards in this deck.
Unlock Deck
k this deck
26
The market for Columbian coffee beans is given in the diagram below.The market is currently in equilibrium with a price of P0 and a quantity exchanged of Q0.Suppose that the Columbian government takes over the production and distribution of all coffee beans grown in Columbia.In an effort to increase revenue from the sales of coffee beans, the government decides to raise the price above P0.Describe why it would take more effort for the government to raise the price to P2 than it would for it raise the price to P1.
Unlock Deck
Unlock for access to all 31 flashcards in this deck.
Unlock Deck
k this deck
27
A change in a shift factor of demand will actually cause both a change in quantity supplied and a change in quantity demanded.Explain why, and demonstrate with a graph.
Unlock Deck
Unlock for access to all 31 flashcards in this deck.
Unlock Deck
k this deck
28
Demonstrate graphically and explain verbally the concept of equilibrium in a supply and demand model.
Unlock Deck
Unlock for access to all 31 flashcards in this deck.
Unlock Deck
k this deck
29
Using graphs, explain what will happen to equilibrium price and equilibrium quantity of a product as a result of each of the following scenarios:
a.A rise in the number of buyers and a decrease in the cost of producing the product.
b.A decrease in the number of suppliers and an increase in the number of buyers.
c.An increase in the cost of production and a decrease in consumers' income.
d.Advances in the technology used to produce the product and a decrease in the price of a substitute.
e.A decrease in the tax on the product imposed on consumers and a decline in the price of a complement.
f.A government program that subsidizes the price of the product to consumers and a tax imposed on the producer.
Unlock Deck
Unlock for access to all 31 flashcards in this deck.
Unlock Deck
k this deck
30
Consider the following supply and demand picture of the market for Oreos.Note that the market is currently in equilibrium, with a price of P* and a quantity exchanged of Q*. For each of the scenarios below, draw a picture that illustrates the impact on price and quantity exchanged.Explain each of your pictures by describing what is happening to the supply side of the market.
(a) The price of Hydrox cookies goes down.
(b) Due to a disastrous growing season, the price of cocoa triples.
For each of the scenarios below, draw a picture that illustrates the impact on price and quantity exchanged.Explain each of your pictures by describing what is happening to the supply side of the market.(a) The price of Hydrox cookies goes down.
(b) Due to a disastrous growing season, the price of cocoa triples.
Unlock Deck
Unlock for access to all 31 flashcards in this deck.
Unlock Deck
k this deck
31
Consider the following supply and demand diagram for Tootsie Rolls.Note that the market is currently in equilibrium, with a price of P* and a quantity exchanged of Q*. For each of the scenarios below, draw a picture that illustrates the impact on price and quantity exchanged.Explain each of your pictures by describing what is happening to the demand side of the market.
(a) The American Association of Chocolate Lovers designates the Tootsie Roll as its official candy.
(b) The Tootsie Roll Company computerizes their Tootsie Roll manufacturing plant, lowering unit costs of production.
For each of the scenarios below, draw a picture that illustrates the impact on price and quantity exchanged.Explain each of your pictures by describing what is happening to the demand side of the market.(a) The American Association of Chocolate Lovers designates the Tootsie Roll as its official candy.
(b) The Tootsie Roll Company computerizes their Tootsie Roll manufacturing plant, lowering unit costs of production.
Unlock Deck
Unlock for access to all 31 flashcards in this deck.
Unlock Deck
k this deck
Unlock Deck
Unlock for access to all 31 flashcards in this deck.


