Deck 14: Statistical Process Control
Full screen (f)
Question
Question
Question
Question
Question
Question
Question
Question
Question
Question
Question
Question
Question
Question
Question
Question
Question
Question
Question
Question
Question
Question
Question
Question
Question
Question
Question
Use the information below to answer the following question(s).Use the "Factors for Control Limits" Table A.3 from the textbook where required:
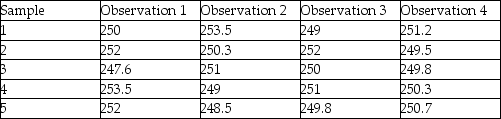
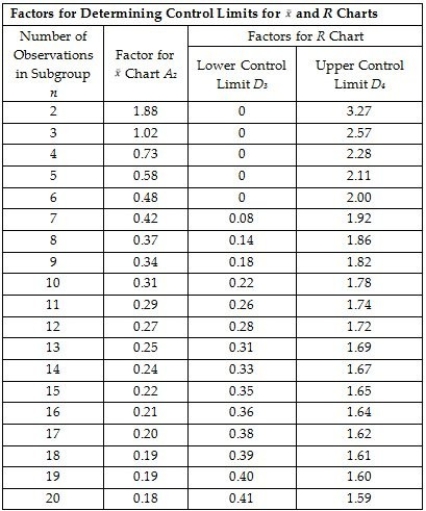 A control chart needs to be developed to determine if the temperature for a process is within control limits.Five samples each having 4 observations are taken and the sample measurements (temperature in degrees F)are noted in the table below:
What is the value of the average range R-bar?
A)3.68
B)8.398
C)3.125
D)5.252
A control chart needs to be developed to determine if the temperature for a process is within control limits.Five samples each having 4 observations are taken and the sample measurements (temperature in degrees F)are noted in the table below:What is the value of the average range R-bar?
A)3.68
B)8.398
C)3.125
D)5.252
Question
Question
Use the information below to answer the following question(s).Use the "Factors for Control Limits" Table A.3 from the textbook where required:
A control chart needs to be developed to determine if the temperature for a process is within control limits.Five samples each having 4 observations are taken and the sample measurements (temperature in degrees F)are noted in the table below:
What is the LCL for a X-bar chart?
A)253.218
B)247.852
C)250
D)252.527
A control chart needs to be developed to determine if the temperature for a process is within control limits.Five samples each having 4 observations are taken and the sample measurements (temperature in degrees F)are noted in the table below:What is the LCL for a X-bar chart?
A)253.218
B)247.852
C)250
D)252.527
Question
Question
Question
Question
Use the information below to answer the following question(s).Use the "Factors for Control Limits" Table A.3 from the textbook where required:
A control chart needs to be developed to determine if the temperature for a process is within control limits.Five samples each having 4 observations are taken and the sample measurements (temperature in degrees F)are noted in the table below:
What is the UCL for a X-bar chart?
A)253.218
B)247.852
C)250
D)252.527
A control chart needs to be developed to determine if the temperature for a process is within control limits.Five samples each having 4 observations are taken and the sample measurements (temperature in degrees F)are noted in the table below:What is the UCL for a X-bar chart?
A)253.218
B)247.852
C)250
D)252.527
Question
Question
Question
Question
Use the information below to answer the following question(s).Use the "Factors for Control Limits" Table A.3 from the textbook where required:
A control chart needs to be developed to determine if the temperature for a process is within control limits.Five samples each having 4 observations are taken and the sample measurements (temperature in degrees F)are noted in the table below:
What is the value of the grand mean?
A)249.325
B)251.300
C)250.535
D)248.500
A control chart needs to be developed to determine if the temperature for a process is within control limits.Five samples each having 4 observations are taken and the sample measurements (temperature in degrees F)are noted in the table below:What is the value of the grand mean?
A)249.325
B)251.300
C)250.535
D)248.500
Question
Question
Question
Question
Use the information below to answer the following question(s).Use the "Factors for Control Limits" Table A.3 from the textbook where required:
A control chart needs to be developed to determine if the temperature for a process is within control limits.Five samples each having 4 observations are taken and the sample measurements (temperature in degrees F)are noted in the table below:
What is the LCL for a R chart?
A)3.68
B)8.398
C)3.125
D)0
A control chart needs to be developed to determine if the temperature for a process is within control limits.Five samples each having 4 observations are taken and the sample measurements (temperature in degrees F)are noted in the table below:What is the LCL for a R chart?
A)3.68
B)8.398
C)3.125
D)0
Question
Question
Question
Question
Question
Question
Use the information below to answer the following question(s).
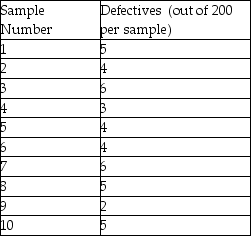
An inspector visually inspects 10 samples of 200 computer monitors each for defects.Using trained judgement,the inspector either accepts or rejects the monitors based on whether they are flawless.The table below gives the results of these inspections from the 10 samples:
What is the LCL for a p chart?
A)0.050
B)0.000
C)0.053
D)0.0091
Question
Question
Question
Question
Use the information below to answer the following question(s).Use the "Factors for Control Limits" Table A.3 from the textbook where required:
A control chart needs to be developed to determine if the temperature for a process is within control limits.Five samples each having 4 observations are taken and the sample measurements (temperature in degrees F)are noted in the table below:
What is the UCL for a R chart?
A)3.68
B)8.398
C)3.125
D)0
A control chart needs to be developed to determine if the temperature for a process is within control limits.Five samples each having 4 observations are taken and the sample measurements (temperature in degrees F)are noted in the table below:What is the UCL for a R chart?
A)3.68
B)8.398
C)3.125
D)0
Question
Question
Question
Question
Question
Question
Question
Question
Use the information below to answer the following question(s).
An inspector visually inspects 10 samples of 200 computer monitors each for defects.Using trained judgement,the inspector either accepts or rejects the monitors based on whether they are flawless.The table below gives the results of these inspections from the 10 samples:
What is the UCL for a p chart?
A)0.050
B)0.048
C)0.053
D)0.0091
Question
Use the information below to answer the following question(s).
An inspector visually inspects 10 samples of 200 computer monitors each for defects.Using trained judgement,the inspector either accepts or rejects the monitors based on whether they are flawless.The table below gives the results of these inspections from the 10 samples:
What is the average proportion defective?
A)0.022
B)0.025
C)0.018
D)0.027
Question
Question
Question
Question
Question
Question
Question
Question
Question
Question
Question
Question
Question
Question
Question
Question
Question
Question
Question
Question

Unlock Deck
Sign up to unlock the cards in this deck!
Unlock Deck
Unlock Deck
1/80
Play
Full screen (f)
Deck 14: Statistical Process Control
1
Samples which are ordered by time or sequence are called
A)systematic samples.
B)random samples.
C)nonrandom samples.
D)biased samples.
A)systematic samples.
B)random samples.
C)nonrandom samples.
D)biased samples.
A
2
Every 10th product coming off a production line is inspected to check for quality.Such a sampling technique is called
A)systematic sampling.
B)random sampling.
C)nonrandom sampling.
D)biased sampling.
A)systematic sampling.
B)random sampling.
C)nonrandom sampling.
D)biased sampling.
A
3
The width of a distribution is called the mean.
False
4
Variation that centers on a mean and occurs with a somewhat consistent amount of dispersion is known as random variation.
Unlock Deck
Unlock for access to all 80 flashcards in this deck.
Unlock Deck
k this deck
5
Variation that centers on a mean and occurs with a somewhat consistent amount of dispersion is known as ________ variation.
Unlock Deck
Unlock for access to all 80 flashcards in this deck.
Unlock Deck
k this deck
6
Samples which are ordered by time or sequence are called systematic samples.
Unlock Deck
Unlock for access to all 80 flashcards in this deck.
Unlock Deck
k this deck
7
A manufacturer of snow shovels sees a drop in the demand for snow shovels due to an unseasonally warm winter.This means that the demand experiences
A)random variation.
B)nonrandom variation.
C)seasonal variation.
D)no variation.
A)random variation.
B)nonrandom variation.
C)seasonal variation.
D)no variation.
Unlock Deck
Unlock for access to all 80 flashcards in this deck.
Unlock Deck
k this deck
8
A process that is stable has no variation present in the process.
Unlock Deck
Unlock for access to all 80 flashcards in this deck.
Unlock Deck
k this deck
9
Data gathered to check if a process is stable is called ________.
Unlock Deck
Unlock for access to all 80 flashcards in this deck.
Unlock Deck
k this deck
10
The cost of inspection for three different product characteristics A,B,and C,is $10,$12 and $8 respectively.The cost of failure if any one of them breaks down is $100 (full replacement cost of the product).What is the inspection ratio for B?
A)0.10
B)0.08
C)0.12
D)0.05
A)0.10
B)0.08
C)0.12
D)0.05
Unlock Deck
Unlock for access to all 80 flashcards in this deck.
Unlock Deck
k this deck
11
The jump in sales of hand sanitizers experienced by the manufacturer of sanitizing products due to a scare of H1N1 virus outbreak is known as ________ variation.
Unlock Deck
Unlock for access to all 80 flashcards in this deck.
Unlock Deck
k this deck
12
Concluding that a process is stable means only ________ variation is present in the process.
Unlock Deck
Unlock for access to all 80 flashcards in this deck.
Unlock Deck
k this deck
13
Variation that results from a specific event,which may be a shift in a process mean or an unexpected occurrence,is known as ________ variation.
Unlock Deck
Unlock for access to all 80 flashcards in this deck.
Unlock Deck
k this deck
14
Variation that results from a specific event,which may be a shift in a process mean or an unexpected occurrence,is known as random variation.
Unlock Deck
Unlock for access to all 80 flashcards in this deck.
Unlock Deck
k this deck
15
Samples gathered in such a way that every piece of product has an equal chance of being selected for inspection are called systematic samples.
Unlock Deck
Unlock for access to all 80 flashcards in this deck.
Unlock Deck
k this deck
16
A quality manager concludes that a process is stable.This means that
A)there is no variation present in the process.
B)there is only random variation present in the process.
C)there is only nonrandom variation present in the process.
D)None of the above
A)there is no variation present in the process.
B)there is only random variation present in the process.
C)there is only nonrandom variation present in the process.
D)None of the above
Unlock Deck
Unlock for access to all 80 flashcards in this deck.
Unlock Deck
k this deck
17
The width of a distribution is called the ________.
Unlock Deck
Unlock for access to all 80 flashcards in this deck.
Unlock Deck
k this deck
18
Graphs designed to signal process workers when nonrandom variation occurs in a process are called ________.
Unlock Deck
Unlock for access to all 80 flashcards in this deck.
Unlock Deck
k this deck
19
The cost of inspection for three different product characteristics A,B,and C,is $10,$12 and $8 respectively.The cost of failure if any one of them breaks down is $100 (full replacement cost of the product).Where should the priority to inspect first be?
A)A
B)B
C)C
D)None of the above
A)A
B)B
C)C
D)None of the above
Unlock Deck
Unlock for access to all 80 flashcards in this deck.
Unlock Deck
k this deck
20
Samples gathered in such a way that every piece of product has an equal chance of being selected for inspection are called
A)systematic samples.
B)random samples.
C)nonrandom samples.
D)biased samples.
A)systematic samples.
B)random samples.
C)nonrandom samples.
D)biased samples.
Unlock Deck
Unlock for access to all 80 flashcards in this deck.
Unlock Deck
k this deck
21
The control chart used to count the number nonconforming in a consistent sample space is called the
A)p-chart.
B)R-chart.
C)c-chart.
D)u-chart.
A)p-chart.
B)R-chart.
C)c-chart.
D)u-chart.
Unlock Deck
Unlock for access to all 80 flashcards in this deck.
Unlock Deck
k this deck
22
Every 10th product coming off a production line is inspected to check for quality.Such a sampling technique is called ________.
Unlock Deck
Unlock for access to all 80 flashcards in this deck.
Unlock Deck
k this deck
23
The ratio between the cost of inspection and the cost of failure resulting from a particular step in the process is called ________.
Unlock Deck
Unlock for access to all 80 flashcards in this deck.
Unlock Deck
k this deck
24
Samples which are ordered by time or sequence are called ________.
Unlock Deck
Unlock for access to all 80 flashcards in this deck.
Unlock Deck
k this deck
25
A bottling plant measures the volume of liquid in the bottle.The control chart which will be used with such a measurement is a
A)p-chart.
B)X-bar chart.
C)c-chart.
D)u-chart.
A)p-chart.
B)X-bar chart.
C)c-chart.
D)u-chart.
Unlock Deck
Unlock for access to all 80 flashcards in this deck.
Unlock Deck
k this deck
26
A continuous measurement such as weight,height,or volume is known as
A)attribute.
B)variable.
C)systematic.
D)proportion.
A)attribute.
B)variable.
C)systematic.
D)proportion.
Unlock Deck
Unlock for access to all 80 flashcards in this deck.
Unlock Deck
k this deck
27
Use the information below to answer the following question(s).Use the "Factors for Control Limits" Table A.3 from the textbook where required:
A control chart needs to be developed to determine if the temperature for a process is within control limits.Five samples each having 4 observations are taken and the sample measurements (temperature in degrees F)are noted in the table below:
What is the value of the average range R-bar?
A)3.68
B)8.398
C)3.125
D)5.252
A control chart needs to be developed to determine if the temperature for a process is within control limits.Five samples each having 4 observations are taken and the sample measurements (temperature in degrees F)are noted in the table below:What is the value of the average range R-bar?
A)3.68
B)8.398
C)3.125
D)5.252
Unlock Deck
Unlock for access to all 80 flashcards in this deck.
Unlock Deck
k this deck
28
A control chart needs to be developed to determine if the proportion of late deliveries of a pizza delivery restaurant is within control limits.The control chart which would be most appropriate to use in this situation would be the
A)p-chart.
B)R-chart.
C)c-chart.
D)u-chart.
A)p-chart.
B)R-chart.
C)c-chart.
D)u-chart.
Unlock Deck
Unlock for access to all 80 flashcards in this deck.
Unlock Deck
k this deck
29
Use the information below to answer the following question(s).Use the "Factors for Control Limits" Table A.3 from the textbook where required:
A control chart needs to be developed to determine if the temperature for a process is within control limits.Five samples each having 4 observations are taken and the sample measurements (temperature in degrees F)are noted in the table below:
What is the LCL for a X-bar chart?
A)253.218
B)247.852
C)250
D)252.527
A control chart needs to be developed to determine if the temperature for a process is within control limits.Five samples each having 4 observations are taken and the sample measurements (temperature in degrees F)are noted in the table below:What is the LCL for a X-bar chart?
A)253.218
B)247.852
C)250
D)252.527
Unlock Deck
Unlock for access to all 80 flashcards in this deck.
Unlock Deck
k this deck
30
For process control charts,using control limits corresponding to z = 3 standard deviations from the mean will capture what percentage of the random variation in the process?
A)90%
B)95.6%
C)98.2%
D)99.7%
A)90%
B)95.6%
C)98.2%
D)99.7%
Unlock Deck
Unlock for access to all 80 flashcards in this deck.
Unlock Deck
k this deck
31
Quality inspection performed during the production process is called ________.
Unlock Deck
Unlock for access to all 80 flashcards in this deck.
Unlock Deck
k this deck
32
A control chart needs to be developed to determine if the temperature for a process is within control limits.The control chart which would be most appropriate to use in this situation would be the
A)p-chart.
B)X-bar chart.
C)c-chart.
D)u-chart.
A)p-chart.
B)X-bar chart.
C)c-chart.
D)u-chart.
Unlock Deck
Unlock for access to all 80 flashcards in this deck.
Unlock Deck
k this deck
33
Use the information below to answer the following question(s).Use the "Factors for Control Limits" Table A.3 from the textbook where required:
A control chart needs to be developed to determine if the temperature for a process is within control limits.Five samples each having 4 observations are taken and the sample measurements (temperature in degrees F)are noted in the table below:
What is the UCL for a X-bar chart?
A)253.218
B)247.852
C)250
D)252.527
A control chart needs to be developed to determine if the temperature for a process is within control limits.Five samples each having 4 observations are taken and the sample measurements (temperature in degrees F)are noted in the table below:What is the UCL for a X-bar chart?
A)253.218
B)247.852
C)250
D)252.527
Unlock Deck
Unlock for access to all 80 flashcards in this deck.
Unlock Deck
k this deck
34
For process control charts,to approximately capture 99% of the random variation,the control limits will need to correspond to how many standard deviations from the mean?
A)z = 1
B)z = 2
C)z = 3
D)z = 4
A)z = 1
B)z = 2
C)z = 3
D)z = 4
Unlock Deck
Unlock for access to all 80 flashcards in this deck.
Unlock Deck
k this deck
35
Samples gathered in such a way that every piece of product has an equal chance of being selected for inspection are called ________.
Unlock Deck
Unlock for access to all 80 flashcards in this deck.
Unlock Deck
k this deck
36
A measurement to determine if a defect is either present or not is known as
A)attribute.
B)variable.
C)systematic.
D)proportion.
A)attribute.
B)variable.
C)systematic.
D)proportion.
Unlock Deck
Unlock for access to all 80 flashcards in this deck.
Unlock Deck
k this deck
37
Use the information below to answer the following question(s).Use the "Factors for Control Limits" Table A.3 from the textbook where required:
A control chart needs to be developed to determine if the temperature for a process is within control limits.Five samples each having 4 observations are taken and the sample measurements (temperature in degrees F)are noted in the table below:
What is the value of the grand mean?
A)249.325
B)251.300
C)250.535
D)248.500
A control chart needs to be developed to determine if the temperature for a process is within control limits.Five samples each having 4 observations are taken and the sample measurements (temperature in degrees F)are noted in the table below:What is the value of the grand mean?
A)249.325
B)251.300
C)250.535
D)248.500
Unlock Deck
Unlock for access to all 80 flashcards in this deck.
Unlock Deck
k this deck
38
The control chart used to measure the number of defects per unit is called the
A)p-chart.
B)R-chart.
C)c-chart.
D)u-chart.
A)p-chart.
B)R-chart.
C)c-chart.
D)u-chart.
Unlock Deck
Unlock for access to all 80 flashcards in this deck.
Unlock Deck
k this deck
39
The control chart used to monitor the dispersion of a process is called the
A)p-chart.
B)R-chart.
C)c-chart.
D)u-chart.
A)p-chart.
B)R-chart.
C)c-chart.
D)u-chart.
Unlock Deck
Unlock for access to all 80 flashcards in this deck.
Unlock Deck
k this deck
40
The control chart used to measure the proportion defective is called the
A)p-chart.
B)R-chart.
C)c-chart.
D)u-chart.
A)p-chart.
B)R-chart.
C)c-chart.
D)u-chart.
Unlock Deck
Unlock for access to all 80 flashcards in this deck.
Unlock Deck
k this deck
41
Use the information below to answer the following question(s).Use the "Factors for Control Limits" Table A.3 from the textbook where required:
A control chart needs to be developed to determine if the temperature for a process is within control limits.Five samples each having 4 observations are taken and the sample measurements (temperature in degrees F)are noted in the table below:
What is the LCL for a R chart?
A)3.68
B)8.398
C)3.125
D)0
A control chart needs to be developed to determine if the temperature for a process is within control limits.Five samples each having 4 observations are taken and the sample measurements (temperature in degrees F)are noted in the table below:What is the LCL for a R chart?
A)3.68
B)8.398
C)3.125
D)0
Unlock Deck
Unlock for access to all 80 flashcards in this deck.
Unlock Deck
k this deck
42
The rule that states that sampling distributions generally are normally distributed is known as the ________.
Unlock Deck
Unlock for access to all 80 flashcards in this deck.
Unlock Deck
k this deck
43
A continuous measurement such as weight,height,or volume is known as an attribute.
Unlock Deck
Unlock for access to all 80 flashcards in this deck.
Unlock Deck
k this deck
44
The control chart used to measure the proportion defective is called the u chart.
Unlock Deck
Unlock for access to all 80 flashcards in this deck.
Unlock Deck
k this deck
45
A measurement to determine if a defect is either present or not is known as a(n)________.
Unlock Deck
Unlock for access to all 80 flashcards in this deck.
Unlock Deck
k this deck
46
The control chart used to monitor the average of the characteristic being measured is called an R-chart.
Unlock Deck
Unlock for access to all 80 flashcards in this deck.
Unlock Deck
k this deck
47
Use the information below to answer the following question(s).
An inspector visually inspects 10 samples of 200 computer monitors each for defects.Using trained judgement,the inspector either accepts or rejects the monitors based on whether they are flawless.The table below gives the results of these inspections from the 10 samples:
What is the LCL for a p chart?
A)0.050
B)0.000
C)0.053
D)0.0091
Unlock Deck
Unlock for access to all 80 flashcards in this deck.
Unlock Deck
k this deck
48
For process control charts,to approximately capture 99% of the random variation,the control limits will correspond to z = 3 standard deviations from the mean.
Unlock Deck
Unlock for access to all 80 flashcards in this deck.
Unlock Deck
k this deck
49
Each point on the control chart represents data from samples that are plotted sequentially over time.
Unlock Deck
Unlock for access to all 80 flashcards in this deck.
Unlock Deck
k this deck
50
The control chart used to count the number nonconforming in a consistent sample space is called the c chart.
Unlock Deck
Unlock for access to all 80 flashcards in this deck.
Unlock Deck
k this deck
51
Use the information below to answer the following question(s).Use the "Factors for Control Limits" Table A.3 from the textbook where required:
A control chart needs to be developed to determine if the temperature for a process is within control limits.Five samples each having 4 observations are taken and the sample measurements (temperature in degrees F)are noted in the table below:
What is the UCL for a R chart?
A)3.68
B)8.398
C)3.125
D)0
A control chart needs to be developed to determine if the temperature for a process is within control limits.Five samples each having 4 observations are taken and the sample measurements (temperature in degrees F)are noted in the table below:What is the UCL for a R chart?
A)3.68
B)8.398
C)3.125
D)0
Unlock Deck
Unlock for access to all 80 flashcards in this deck.
Unlock Deck
k this deck
52
For process control charts,to approximately capture 99% of the random variation,the control limits will correspond to ________ standard deviations from the mean.
Unlock Deck
Unlock for access to all 80 flashcards in this deck.
Unlock Deck
k this deck
53
For process control charts,using control limits corresponding to z = 3 standard deviations from the mean will capture exactly ________ of random variation.
Unlock Deck
Unlock for access to all 80 flashcards in this deck.
Unlock Deck
k this deck
54
For process control charts,using control limits corresponding to z = 3 standard deviations from the mean will capture exactly 95% of random variation.
Unlock Deck
Unlock for access to all 80 flashcards in this deck.
Unlock Deck
k this deck
55
p control charts are used with variable measurements.
Unlock Deck
Unlock for access to all 80 flashcards in this deck.
Unlock Deck
k this deck
56
A measurement to determine if a defect is either present or not is known as an attribute.
Unlock Deck
Unlock for access to all 80 flashcards in this deck.
Unlock Deck
k this deck
57
A process which is in control is always a capable process.
Unlock Deck
Unlock for access to all 80 flashcards in this deck.
Unlock Deck
k this deck
58
A continuous measurement such as weight,height,or volume is known as a ________.
Unlock Deck
Unlock for access to all 80 flashcards in this deck.
Unlock Deck
k this deck
59
Use the information below to answer the following question(s).
An inspector visually inspects 10 samples of 200 computer monitors each for defects.Using trained judgement,the inspector either accepts or rejects the monitors based on whether they are flawless.The table below gives the results of these inspections from the 10 samples:
What is the UCL for a p chart?
A)0.050
B)0.048
C)0.053
D)0.0091
Unlock Deck
Unlock for access to all 80 flashcards in this deck.
Unlock Deck
k this deck
60
Use the information below to answer the following question(s).
An inspector visually inspects 10 samples of 200 computer monitors each for defects.Using trained judgement,the inspector either accepts or rejects the monitors based on whether they are flawless.The table below gives the results of these inspections from the 10 samples:
What is the average proportion defective?
A)0.022
B)0.025
C)0.018
D)0.027
Unlock Deck
Unlock for access to all 80 flashcards in this deck.
Unlock Deck
k this deck
61
Aspects of the product that will result in either good or poor function of the product are known as ________.
Unlock Deck
Unlock for access to all 80 flashcards in this deck.
Unlock Deck
k this deck
62
The ability of a process to produce a product that meets specification is known as ________.
Unlock Deck
Unlock for access to all 80 flashcards in this deck.
Unlock Deck
k this deck
63
A comparative measure of the extent to which individual products meet specification is known as ________.
Unlock Deck
Unlock for access to all 80 flashcards in this deck.
Unlock Deck
k this deck
64
Fifty sample measurements of the length of an automotive component yield a grand mean of 1.33 inches with an estimated standard deviation of 0.2 inches.The specification length is between 1.2 and 1.4 inches.Is the process capable of meeting the required specifications?
A)Yes
B)No
C)Insufficient information to determine
D)Barely capable
A)Yes
B)No
C)Insufficient information to determine
D)Barely capable
Unlock Deck
Unlock for access to all 80 flashcards in this deck.
Unlock Deck
k this deck
65
The central limit theorem states that sampling distributions generally are ________ distributed.
Unlock Deck
Unlock for access to all 80 flashcards in this deck.
Unlock Deck
k this deck
66
Fifty sample measurements of the length of an automotive component yield a grand mean of 1.33 inches with an estimated standard deviation of 0.2 inches.The specification length is between 1.2 and 1.4 inches.Calculate the process capability index.
A)0.1167
B)0.18
C)0.2167
D)0.2877
A)0.1167
B)0.18
C)0.2167
D)0.2877
Unlock Deck
Unlock for access to all 80 flashcards in this deck.
Unlock Deck
k this deck
67
The control chart used to monitor the average of the characteristic being measured is called a(n)________ chart.
Unlock Deck
Unlock for access to all 80 flashcards in this deck.
Unlock Deck
k this deck
68
Five points in sequence,either above or below the mean are called ________.
Unlock Deck
Unlock for access to all 80 flashcards in this deck.
Unlock Deck
k this deck
69
On a control chart,one data point out above the control limit is considered normal behavior.
Unlock Deck
Unlock for access to all 80 flashcards in this deck.
Unlock Deck
k this deck
70
The control chart used to monitor the dispersion of a process is called a(n)________ chart.
Unlock Deck
Unlock for access to all 80 flashcards in this deck.
Unlock Deck
k this deck
71
On a control chart,how many successive data points on an increasing or decreasing line require an investigation for cause of progressive change?
A)7 or more
B)5 or more
C)4 or more
D)3 or more
A)7 or more
B)5 or more
C)4 or more
D)3 or more
Unlock Deck
Unlock for access to all 80 flashcards in this deck.
Unlock Deck
k this deck
72
Seven points in succession,all increasing or decreasing in a process chart are called ________.
Unlock Deck
Unlock for access to all 80 flashcards in this deck.
Unlock Deck
k this deck
73
The control chart used to count the number nonconforming in a consistent sample space is called the ________ chart.
Unlock Deck
Unlock for access to all 80 flashcards in this deck.
Unlock Deck
k this deck
74
The control chart used to measure the proportion defective is called the ________ chart.
Unlock Deck
Unlock for access to all 80 flashcards in this deck.
Unlock Deck
k this deck
75
Adjusting a process when it only exhibits random variation is called ________.
Unlock Deck
Unlock for access to all 80 flashcards in this deck.
Unlock Deck
k this deck
76
A process that exhibits nonrandom variation is a(n)________ process.
Unlock Deck
Unlock for access to all 80 flashcards in this deck.
Unlock Deck
k this deck
77
A process that is out of control exhibits ________ variation.
Unlock Deck
Unlock for access to all 80 flashcards in this deck.
Unlock Deck
k this deck
78
A process capability measure of 1.00 or below indicates that the process is capable.
Unlock Deck
Unlock for access to all 80 flashcards in this deck.
Unlock Deck
k this deck
79
On a control chart,two data points near the UCL requires an investigation for the cause of variation,however two data points near the LCL does not call for any investigation and is part of normal behavior.
Unlock Deck
Unlock for access to all 80 flashcards in this deck.
Unlock Deck
k this deck
80
On a control chart,________ successive data points on an increasing or decreasing line require an investigation for cause of progressive change.
Unlock Deck
Unlock for access to all 80 flashcards in this deck.
Unlock Deck
k this deck
Unlock Deck
Unlock for access to all 80 flashcards in this deck.


