Deck 18: Descriptive Statistics
Full screen (f)
Question
Question
Question
Question
Question
Question
Examine the frequency distribution listed below. The variable is the number of in-service training classes teachers have attended over a two-year period. What is the mode for the number of in-service classes taken by the teachers? 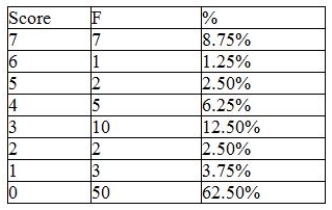
A) 50
B) 0
C) 3
D) 10
A) 50
B) 0
C) 3
D) 10
Question
Question
Question
Question
Question
Examine the frequency distribution listed below. The variable is the number of in-service training classes teachers have attended over a two-year period. This frequency distribution is an example of: 
A) descriptive statistics.
B) inferential statistics
C) measures of central tendency
D) a contingency table
A) descriptive statistics.
B) inferential statistics
C) measures of central tendency
D) a contingency table
Question
Question
Question
Question
Question
Question
Question
Question
Question
Question
Question
Question
Which will have the highest score value in the distribution? 
A) The mode
B) The median
C) The mean
D) The variance
A) The mode
B) The median
C) The mean
D) The variance
Question
Question
Question
Question
Question
Question
How is the distribution skewed? 
A) Positive skew
B) Negative skew
C) Symmetrical
D) No skew
A) Positive skew
B) Negative skew
C) Symmetrical
D) No skew
Question
Question
Which will be the best measure of central tendency for these data? 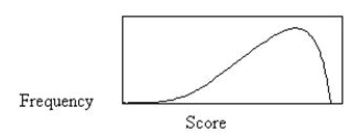
A) The mode
B) The median
C) The mean
A) The mode
B) The median
C) The mean
Question
Question
What kind of skew is there in the below distribution? 
A) Positive skew
B) Negative skew
C) Symmetrical
D) No skew
A) Positive skew
B) Negative skew
C) Symmetrical
D) No skew
Question
Question
Question
Question
Which will be the best measure of central tendency for these data? 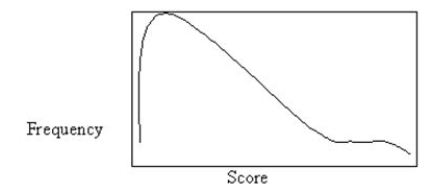
A) The mode
B) The median
C) The mean
D) The variance
A) The mode
B) The median
C) The mean
D) The variance
Question
Which will have the highest score value in the distribution? 
A) The mode
B) The median
C) The mean
A) The mode
B) The median
C) The mean
Question
Question
Question
Which of the following distributions is negatively skewed?
A)
B)
C)
A)
B)
C)
Question
Question
Question
Question
Question
Question
Question
Question
Question
Question
Question
Question
Question
Which of the following distributions is positively skewed?
A)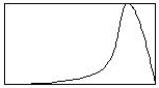
B)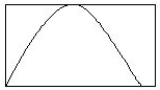
C)
A)
B)
C)
Question
Question
Which of the following distributions is closest to being symmetrical?
A)
B)
C)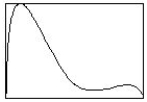
A)
B)
C)
Question
Question
Question
Question
Question
Question
Question
Question
Question
Examine the following table. A researcher is interested in whether learning from instruction that includes video will be more likely to transfer (be applicable in new contexts) than learning that takes place with still photos or a written document. Which statement below is true? 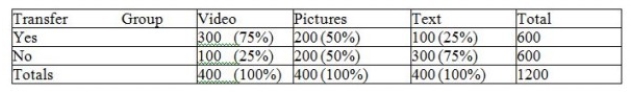
A) The video group was less likely to transfer than the picture group
B) The picture group had the largest number of participants show transfer
C) The picture group was more likely to transfer than the written text group
D) All groups were equally likely to show transfer of learning
A) The video group was less likely to transfer than the picture group
B) The picture group had the largest number of participants show transfer
C) The picture group was more likely to transfer than the written text group
D) All groups were equally likely to show transfer of learning
Question
Examine the following table. A researcher is interested in whether learning from instruction that includes video will be more likely to transfer (be applicable in new contexts) than learning that takes place with still photos or a written document. Is there a likely relationship between instructional group and transfer of learning? 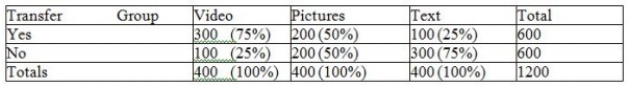
A) Yes
B) No
A) Yes
B) No
Question
Question
Question
Which statement best captures the relationship between handedness and major? 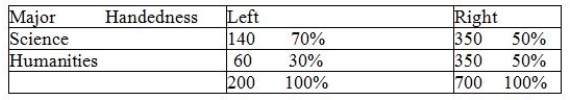
A) Major is unrelated to handedness
B) Left-handed people are more likely to major in humanities than right-handed people
C) Right-handed people are more likely to major in science than left-handed people
D) Left-handed people are more likely to major in science than right-handed people
A) Major is unrelated to handedness
B) Left-handed people are more likely to major in humanities than right-handed people
C) Right-handed people are more likely to major in science than left-handed people
D) Left-handed people are more likely to major in science than right-handed people
Question
Question
Question
Question
Question
Question
Below is a contingency table containing frequencies and column percentages that looks at the relationship between handedness and majoring in science versus the humanities. Is there a likely relationship between handedness and major? 
A) Yes
B) No
A) Yes
B) No
Question
Question
Question
Question
Question

Unlock Deck
Sign up to unlock the cards in this deck!
Unlock Deck
Unlock Deck
1/145
Play
Full screen (f)
Deck 18: Descriptive Statistics
1
Explain how to construct and interpret a contingency table.
not answered
2
Read and interpret bar graphs, line graphs, and scatter plots.
not answered
3
List the strengths and weaknesses of the mode, median, and mean.
not answered
4
In a grouped frequency distribution, it is important that the intervals:
A) Are overlapping
B) Do not include extreme scores
C) Are no greater than 5 units
D) Are exhaustive
A) Are overlapping
B) Do not include extreme scores
C) Are no greater than 5 units
D) Are exhaustive
Unlock Deck
Unlock for access to all 145 flashcards in this deck.
Unlock Deck
k this deck
5
Explain the purpose of descriptive statistics.
Unlock Deck
Unlock for access to all 145 flashcards in this deck.
Unlock Deck
k this deck
6
Examine the frequency distribution listed below. The variable is the number of in-service training classes teachers have attended over a two-year period. What is the mode for the number of in-service classes taken by the teachers?
A) 50
B) 0
C) 3
D) 10
A) 50
B) 0
C) 3
D) 10
Unlock Deck
Unlock for access to all 145 flashcards in this deck.
Unlock Deck
k this deck
7
Explain the difference between the y-intercept and the regression coefficient.
Multiple Choice
Multiple Choice
Unlock Deck
Unlock for access to all 145 flashcards in this deck.
Unlock Deck
k this deck
8
Distinguish between inferential and descriptive statistics.
Unlock Deck
Unlock for access to all 145 flashcards in this deck.
Unlock Deck
k this deck
9
Describe and interpret the different measures of variability.
Unlock Deck
Unlock for access to all 145 flashcards in this deck.
Unlock Deck
k this deck
10
Explain the impact of skewness on the measures of central tendency.
Unlock Deck
Unlock for access to all 145 flashcards in this deck.
Unlock Deck
k this deck
11
Examine the frequency distribution listed below. The variable is the number of in-service training classes teachers have attended over a two-year period. This frequency distribution is an example of:
A) descriptive statistics.
B) inferential statistics
C) measures of central tendency
D) a contingency table
A) descriptive statistics.
B) inferential statistics
C) measures of central tendency
D) a contingency table
Unlock Deck
Unlock for access to all 145 flashcards in this deck.
Unlock Deck
k this deck
12
Calculate the range, variance, and standard deviation.
Unlock Deck
Unlock for access to all 145 flashcards in this deck.
Unlock Deck
k this deck
13
Explain the difference between a frequency distribution and a grouped frequency distribution.
Unlock Deck
Unlock for access to all 145 flashcards in this deck.
Unlock Deck
k this deck
14
A table listing the values of a variable and their frequencies of occurrence is called:
A) The standard deviation
B) A point estimate
C) A frequency distribution
D) A scatter plot
A) The standard deviation
B) A point estimate
C) A frequency distribution
D) A scatter plot
Unlock Deck
Unlock for access to all 145 flashcards in this deck.
Unlock Deck
k this deck
15
Explain the difference between simple and multiple regression.
Unlock Deck
Unlock for access to all 145 flashcards in this deck.
Unlock Deck
k this deck
16
In a grouped frequency distribution, it is important that the intervals be:
A) Overlapping
B) No greater than 10 units
C) Mutually exclusive
D) No greater than 5 units
A) Overlapping
B) No greater than 10 units
C) Mutually exclusive
D) No greater than 5 units
Unlock Deck
Unlock for access to all 145 flashcards in this deck.
Unlock Deck
k this deck
17
Calculate the mode, median, and mean.
Unlock Deck
Unlock for access to all 145 flashcards in this deck.
Unlock Deck
k this deck
18
Explain positive skew and negative skew.
Unlock Deck
Unlock for access to all 145 flashcards in this deck.
Unlock Deck
k this deck
19
Explain percentile ranks and z scores.
Unlock Deck
Unlock for access to all 145 flashcards in this deck.
Unlock Deck
k this deck
20
The purpose of descriptive statistics is to:
A) Make inferences about a population from a sample
B) Test hypotheses
C) Make interval estimates
D) Summarize and explain a set of data
A) Make inferences about a population from a sample
B) Test hypotheses
C) Make interval estimates
D) Summarize and explain a set of data
Unlock Deck
Unlock for access to all 145 flashcards in this deck.
Unlock Deck
k this deck
21
A problem with the mode is that:
A) Its value is affected by extreme scores
B) There might be more than one mode
C) It is always the same as the median.
D) Calculating its value is complex.
A) Its value is affected by extreme scores
B) There might be more than one mode
C) It is always the same as the median.
D) Calculating its value is complex.
Unlock Deck
Unlock for access to all 145 flashcards in this deck.
Unlock Deck
k this deck
22
In graphing the frequencies of a single variable (e.g., in a bar graph, histogram, or line graph), the frequencies are put on which axis:
A) X or abscissa
B) Y or ordinate
A) X or abscissa
B) Y or ordinate
Unlock Deck
Unlock for access to all 145 flashcards in this deck.
Unlock Deck
k this deck
23
Which will have the highest score value in the distribution?
A) The mode
B) The median
C) The mean
D) The variance
A) The mode
B) The median
C) The mean
D) The variance
Unlock Deck
Unlock for access to all 145 flashcards in this deck.
Unlock Deck
k this deck
24
The relationship between two quantitative variables is typically represented with a:
A) Line graph
B) Scatter plot
C) Bar graph
D) Frequency distribution
A) Line graph
B) Scatter plot
C) Bar graph
D) Frequency distribution
Unlock Deck
Unlock for access to all 145 flashcards in this deck.
Unlock Deck
k this deck
25
What is an advantage of the mean as a measure of central tendency?
A) It is not influenced by extreme scores
B) It is representative even when there is extreme skewness
C) It is the most precise measure of central tendency
D) It can be used with nominal variables
A) It is not influenced by extreme scores
B) It is representative even when there is extreme skewness
C) It is the most precise measure of central tendency
D) It can be used with nominal variables
Unlock Deck
Unlock for access to all 145 flashcards in this deck.
Unlock Deck
k this deck
26
The mode is:
A) The arithmetic average
B) The middle score
C) The most frequent score
D) A measure of variability
A) The arithmetic average
B) The middle score
C) The most frequent score
D) A measure of variability
Unlock Deck
Unlock for access to all 145 flashcards in this deck.
Unlock Deck
k this deck
27
The mean is:
A) The score value that divides the distribution in half
B) The average score
C) The most frequent score
D) A measure of variability
A) The score value that divides the distribution in half
B) The average score
C) The most frequent score
D) A measure of variability
Unlock Deck
Unlock for access to all 145 flashcards in this deck.
Unlock Deck
k this deck
28
What is the median of the following set of scores: 18, 6, 12, 10, 14?
A) 10
B) 14
C) 18
D) 12
A) 10
B) 14
C) 18
D) 12
Unlock Deck
Unlock for access to all 145 flashcards in this deck.
Unlock Deck
k this deck
29
How is the distribution skewed?
A) Positive skew
B) Negative skew
C) Symmetrical
D) No skew
A) Positive skew
B) Negative skew
C) Symmetrical
D) No skew
Unlock Deck
Unlock for access to all 145 flashcards in this deck.
Unlock Deck
k this deck
30
What is a disadvantage of the mode as a measure of central tendency?
A) It is influenced by extreme scores
B) It is imprecise
C) It cannot be easily interpreted
D) It does not take into account the magnitude of all the scores
A) It is influenced by extreme scores
B) It is imprecise
C) It cannot be easily interpreted
D) It does not take into account the magnitude of all the scores
Unlock Deck
Unlock for access to all 145 flashcards in this deck.
Unlock Deck
k this deck
31
Which will be the best measure of central tendency for these data?
A) The mode
B) The median
C) The mean
A) The mode
B) The median
C) The mean
Unlock Deck
Unlock for access to all 145 flashcards in this deck.
Unlock Deck
k this deck
32
The median is:
A) The most frequent score
B) The middle score
C) The highest score
D) The average
A) The most frequent score
B) The middle score
C) The highest score
D) The average
Unlock Deck
Unlock for access to all 145 flashcards in this deck.
Unlock Deck
k this deck
33
What kind of skew is there in the below distribution?
A) Positive skew
B) Negative skew
C) Symmetrical
D) No skew
A) Positive skew
B) Negative skew
C) Symmetrical
D) No skew
Unlock Deck
Unlock for access to all 145 flashcards in this deck.
Unlock Deck
k this deck
34
Below are four sets of intervals for grouped frequency distributions. The data that they are based on has scores that range from 0 to 49. Only one set of intervals meets the necessary criteria for groupings. Pick the one that meets the criteria:
A) 40-49 30-39
20-29
10-19
0-9
B) 40-49 30-39
20-29
10-19
1-9
C) 40-49 30-40
20-30
10-20
0-9
D) 30-40 20-30
10-20
0-10
A) 40-49 30-39
20-29
10-19
0-9
B) 40-49 30-39
20-29
10-19
1-9
C) 40-49 30-40
20-30
10-20
0-9
D) 30-40 20-30
10-20
0-10
Unlock Deck
Unlock for access to all 145 flashcards in this deck.
Unlock Deck
k this deck
35
Measures of central tendency provide a:
A) single value that tells you how variable scores are
B) frequency distribution of values
C) single value that tells you about the range of scores
D) single value that is considered most typical of the values of a variable
A) single value that tells you how variable scores are
B) frequency distribution of values
C) single value that tells you about the range of scores
D) single value that is considered most typical of the values of a variable
Unlock Deck
Unlock for access to all 145 flashcards in this deck.
Unlock Deck
k this deck
36
In graphing the relationship between two variables in a scatter plot, which axes contain the independent and dependent variable?
A) X contains the independent variable and Y contains the dependent variable
B) X contains the dependent variable and Y contains the independent variable
A) X contains the independent variable and Y contains the dependent variable
B) X contains the dependent variable and Y contains the independent variable
Unlock Deck
Unlock for access to all 145 flashcards in this deck.
Unlock Deck
k this deck
37
Which will be the best measure of central tendency for these data?
A) The mode
B) The median
C) The mean
D) The variance
A) The mode
B) The median
C) The mean
D) The variance
Unlock Deck
Unlock for access to all 145 flashcards in this deck.
Unlock Deck
k this deck
38
Which will have the highest score value in the distribution?
A) The mode
B) The median
C) The mean
A) The mode
B) The median
C) The mean
Unlock Deck
Unlock for access to all 145 flashcards in this deck.
Unlock Deck
k this deck
39
What is an advantage of the mean as a measure of central tendency?
A) It is not influenced by extreme scores
B) It is representative even when there is extreme skewness
C) It is very stable from sample to sample
D) It can be used with nominal variables
A) It is not influenced by extreme scores
B) It is representative even when there is extreme skewness
C) It is very stable from sample to sample
D) It can be used with nominal variables
Unlock Deck
Unlock for access to all 145 flashcards in this deck.
Unlock Deck
k this deck
40
When is the median the best measure of central tendency?
A) The data are in a symmetrical distribution
B) When there are a large number of cases
C) There is a great deal of variability in the scores
D) The data are highly skewed
A) The data are in a symmetrical distribution
B) When there are a large number of cases
C) There is a great deal of variability in the scores
D) The data are highly skewed
Unlock Deck
Unlock for access to all 145 flashcards in this deck.
Unlock Deck
k this deck
41
Which of the following distributions is negatively skewed?
A)
B)
C)
A)
B)
C)
Unlock Deck
Unlock for access to all 145 flashcards in this deck.
Unlock Deck
k this deck
42
The plus or minus sign before a z score tells you:
A) If a score is above or below the mean
B) The magnitude of the score
C) The correlation
D) The variability
A) If a score is above or below the mean
B) The magnitude of the score
C) The correlation
D) The variability
Unlock Deck
Unlock for access to all 145 flashcards in this deck.
Unlock Deck
k this deck
43
The denominator (bottom) of the z score formula is:
A) The standard deviation
B) The difference between a score and the mean
C) The range
D) The mean
A) The standard deviation
B) The difference between a score and the mean
C) The range
D) The mean
Unlock Deck
Unlock for access to all 145 flashcards in this deck.
Unlock Deck
k this deck
44
Measures of variability indicate:
A) Where the modal score lies
B) The median score value
C) The degree of skewness in the distribution
D) How spread out scores are in a distribution
A) Where the modal score lies
B) The median score value
C) The degree of skewness in the distribution
D) How spread out scores are in a distribution
Unlock Deck
Unlock for access to all 145 flashcards in this deck.
Unlock Deck
k this deck
45
The standard deviation is:
A) The square root of the variance
B) A measure of central tendency
C) A theoretical construct
D) An inferential statistic
A) The square root of the variance
B) A measure of central tendency
C) A theoretical construct
D) An inferential statistic
Unlock Deck
Unlock for access to all 145 flashcards in this deck.
Unlock Deck
k this deck
46
Joe had a percentile rank of 70 on a standardized math test. What does that mean?
A) He did poorly, since he only correctly answered 70% of the questions
B) He did well in that he scored higher than 70% of the people that took the test
C) He did well, in that he answered 70% of the items correctly
D) He did poorly since he only answered 70% of the items that an average individual would answer correctly
Unlock Deck
Unlock for access to all 145 flashcards in this deck.
Unlock Deck
k this deck
47
The range refers to:
A) The difference between the lowest and highest score.
B) The difference between the mean and the median.
C) The mode in a bimodal distribution.
D) The difference between a score and the mean.
A) The difference between the lowest and highest score.
B) The difference between the mean and the median.
C) The mode in a bimodal distribution.
D) The difference between a score and the mean.
Unlock Deck
Unlock for access to all 145 flashcards in this deck.
Unlock Deck
k this deck
48
Approximately what percentage of scores falls within one standard deviation of the mean in a normal distribution?
A) 34%
B) 95%
C) 99%
D) 68%
A) 34%
B) 95%
C) 99%
D) 68%
Unlock Deck
Unlock for access to all 145 flashcards in this deck.
Unlock Deck
k this deck
49
Which of the data points in the following distribution seems to be an outlier: 8, 10, 12, 14, 12, 15, 2000?
A) 8
B) 10
C) 14
D) 2000
A) 8
B) 10
C) 14
D) 2000
Unlock Deck
Unlock for access to all 145 flashcards in this deck.
Unlock Deck
k this deck
50
If a set of scores is very variable, they are said to be __________, whereas when they do not vary a great deal they are said to be___________.
A) Homogeneous, Heterogeneous
B) Heterogeneous, Homogeneous
C) Modal, Median
D) Positively skewed, Negatively skewed
A) Homogeneous, Heterogeneous
B) Heterogeneous, Homogeneous
C) Modal, Median
D) Positively skewed, Negatively skewed
Unlock Deck
Unlock for access to all 145 flashcards in this deck.
Unlock Deck
k this deck
51
If your grade on a test was determined by your standing relative to others in a class and you had a score of 90, what class should you most like to be in (hint: which one has the largest z score)?
A) Mean grade = 85, SD = 10
B) Mean grade = 83, SD = 5
C) Mean grade = 80, SD = 20
D) Mean grade = 90, SD = 5
A) Mean grade = 85, SD = 10
B) Mean grade = 83, SD = 5
C) Mean grade = 80, SD = 20
D) Mean grade = 90, SD = 5
Unlock Deck
Unlock for access to all 145 flashcards in this deck.
Unlock Deck
k this deck
52
A data point that is very atypical of the scores in a distribution is called:
A) The mode
B) The median
C) An outlier
D) A variance
A) The mode
B) The median
C) An outlier
D) A variance
Unlock Deck
Unlock for access to all 145 flashcards in this deck.
Unlock Deck
k this deck
53
What is the variance?
A) The difference between the lowest and highest score
B) The difference between a score and the mean
C) The average squared distance from the mean
D) A measure of central tendency
A) The difference between the lowest and highest score
B) The difference between a score and the mean
C) The average squared distance from the mean
D) A measure of central tendency
Unlock Deck
Unlock for access to all 145 flashcards in this deck.
Unlock Deck
k this deck
54
Which of the following distributions is positively skewed?
A)
B)
C)
A)
B)
C)
Unlock Deck
Unlock for access to all 145 flashcards in this deck.
Unlock Deck
k this deck
55
A percentile rank tells you:
A) The percent correct on a test
B) The percent of people who scored better than you
C) The percent of people in a particular group who score below your score value
D) How far above or below the mean you are in percentages
A) The percent correct on a test
B) The percent of people who scored better than you
C) The percent of people in a particular group who score below your score value
D) How far above or below the mean you are in percentages
Unlock Deck
Unlock for access to all 145 flashcards in this deck.
Unlock Deck
k this deck
56
Which of the following distributions is closest to being symmetrical?
A)
B)
C)
A)
B)
C)
Unlock Deck
Unlock for access to all 145 flashcards in this deck.
Unlock Deck
k this deck
57
What is the range of the following set of data: 10, 20, 40, 50, 70, 100, 110?
A) 90
B) 80
C) 10
D) 100
A) 90
B) 80
C) 10
D) 100
Unlock Deck
Unlock for access to all 145 flashcards in this deck.
Unlock Deck
k this deck
58
Approximately what percentage of scores falls within two standard deviations of the mean in a normal distribution?
A) 34%
B) 95%
C) 99%
D) 68%
A) 34%
B) 95%
C) 99%
D) 68%
Unlock Deck
Unlock for access to all 145 flashcards in this deck.
Unlock Deck
k this deck
59
A z score transforms a raw score into:
A) Percent correct
B) A ratio of right to wrong answers
C) A range
D) Standard deviation units
A) Percent correct
B) A ratio of right to wrong answers
C) A range
D) Standard deviation units
Unlock Deck
Unlock for access to all 145 flashcards in this deck.
Unlock Deck
k this deck
60
The numerator of the z score formula is:
A) The standard deviation
B) The difference between a score and the mean
C) The range
D) The mean
A) The standard deviation
B) The difference between a score and the mean
C) The range
D) The mean
Unlock Deck
Unlock for access to all 145 flashcards in this deck.
Unlock Deck
k this deck
61
Below are z scores for four people who took a test. Which one scored the highest? John -2.9, Samantha +2.1, Sally +0.1, and Joshua +1.0
A) John
B) Samantha
C) Sally
D) Joshua
A) John
B) Samantha
C) Sally
D) Joshua
Unlock Deck
Unlock for access to all 145 flashcards in this deck.
Unlock Deck
k this deck
62
A contingency table is:
A) A frequency distribution for a single variable
B) A table displaying information in cells formed by the intersection of two or more categorical variables
C) A table containing correlation coefficients
D) A normal curve representation of two variables
A) A frequency distribution for a single variable
B) A table displaying information in cells formed by the intersection of two or more categorical variables
C) A table containing correlation coefficients
D) A normal curve representation of two variables
Unlock Deck
Unlock for access to all 145 flashcards in this deck.
Unlock Deck
k this deck
63
On an IQ test with a mean of 100 and a standard deviation of 15, what is the z score for someone with an IQ of 70?
A) -1.30
B) -2.00
C) -1.00
D) -13
A) -1.30
B) -2.00
C) -1.00
D) -13
Unlock Deck
Unlock for access to all 145 flashcards in this deck.
Unlock Deck
k this deck
64
In a regression equation, the Y-intercept defines:
A) The point where the regression line crosses the y-axis
B) The point where the regression line crosses the x-axis
C) The amount of change in the dependent variable per one unit change in the independent variable
D) The amount of change in the independent variable per one unit change in the dependent variable
Unlock Deck
Unlock for access to all 145 flashcards in this deck.
Unlock Deck
k this deck
65
Examine the following table. A researcher is interested in whether learning from instruction that includes video will be more likely to transfer (be applicable in new contexts) than learning that takes place with still photos or a written document. Which statement below is true?
A) The video group was less likely to transfer than the picture group
B) The picture group had the largest number of participants show transfer
C) The picture group was more likely to transfer than the written text group
D) All groups were equally likely to show transfer of learning
A) The video group was less likely to transfer than the picture group
B) The picture group had the largest number of participants show transfer
C) The picture group was more likely to transfer than the written text group
D) All groups were equally likely to show transfer of learning
Unlock Deck
Unlock for access to all 145 flashcards in this deck.
Unlock Deck
k this deck
66
Examine the following table. A researcher is interested in whether learning from instruction that includes video will be more likely to transfer (be applicable in new contexts) than learning that takes place with still photos or a written document. Is there a likely relationship between instructional group and transfer of learning?
A) Yes
B) No
A) Yes
B) No
Unlock Deck
Unlock for access to all 145 flashcards in this deck.
Unlock Deck
k this deck
67
A simple regression examines:
A) How two or more independent variables predict or explain the scores on a dependent variable
B) How to create a graph that shows changes across time
C) How one independent variable is confounded with another independent variable
D) The prediction or explanation of scores on one dependent variable based on the scores from one independent variable
Unlock Deck
Unlock for access to all 145 flashcards in this deck.
Unlock Deck
k this deck
68
A z score of 0.00 means that:
A) A person had zero points on a test
B) A person scored at the mean
C) A person scored below the mean
D) A person scored in the bottom percentile
A) A person had zero points on a test
B) A person scored at the mean
C) A person scored below the mean
D) A person scored in the bottom percentile
Unlock Deck
Unlock for access to all 145 flashcards in this deck.
Unlock Deck
k this deck
69
Which statement best captures the relationship between handedness and major?
A) Major is unrelated to handedness
B) Left-handed people are more likely to major in humanities than right-handed people
C) Right-handed people are more likely to major in science than left-handed people
D) Left-handed people are more likely to major in science than right-handed people
A) Major is unrelated to handedness
B) Left-handed people are more likely to major in humanities than right-handed people
C) Right-handed people are more likely to major in science than left-handed people
D) Left-handed people are more likely to major in science than right-handed people
Unlock Deck
Unlock for access to all 145 flashcards in this deck.
Unlock Deck
k this deck
70
Let us suppose we are predicting the score on a training posttest from the number of years of education and the score on an aptitude test given before training. Here is the regression equation: Y = 25 + .5X1 +10X2,
Where X1 = years of education and X2 = aptitude test score.
What does the .5 in front of X1 tell us?
A) Where the equation crosses the y-axis
B) How much change in posttest score you get per unit change in aptitude test score
C) How much change in the posttest score you get per unit change in years of education
D) How much change in the years of education you get per unit change in posttest score
Unlock Deck
Unlock for access to all 145 flashcards in this deck.
Unlock Deck
k this deck
71
Let us suppose we are predicting the score on a training posttest from the number of years of education and the score on an aptitude test given before training. Here is the regression equation: Y = 25 + .5X1 +10X2,
Where X1 = years of education and X2 = aptitude test score.
What is the predicted score for someone with 10 years of education and an aptitude test score of 5?
A) 25
B) 50
C) 35
D) 80
Where X1 = years of education and X2 = aptitude test score.
What is the predicted score for someone with 10 years of education and an aptitude test score of 5?
A) 25
B) 50
C) 35
D) 80
Unlock Deck
Unlock for access to all 145 flashcards in this deck.
Unlock Deck
k this deck
72
Which statement below is true?
A) Instructional group is unrelated to transfer of learning
B) The video group was three times more likely to transfer than the text group
C) The video group was less likely to transfer than the picture group
D) The text group was more likely to transfer than the picture group
A) Instructional group is unrelated to transfer of learning
B) The video group was three times more likely to transfer than the text group
C) The video group was less likely to transfer than the picture group
D) The text group was more likely to transfer than the picture group
Unlock Deck
Unlock for access to all 145 flashcards in this deck.
Unlock Deck
k this deck
73
Let us suppose we are predicting the score on a training posttest from the number of years of education and the score on an aptitude test given before training. Here is the regression equation: Y = 25 + .5X1 +10X2,
Where X1 = years of education and X2 = aptitude test score.
Which of the following are true about this equation?
A) The equation is a simple regression analysis
B) The regression coefficient for aptitude test controls for years of education
C) The equation is in standard score form
D) For every unit change in X1, there is a 10 unit change in Y
Unlock Deck
Unlock for access to all 145 flashcards in this deck.
Unlock Deck
k this deck
74
Regression analysis involves:
A) Creating a graph that shows changes across time
B) Creating a test where people do not regress toward the mean
C) A statistical procedure used to predict or explain the values of a dependent variable based on the values of one or more independent variables
D) A statistical procedure for analyzing contingency table
Unlock Deck
Unlock for access to all 145 flashcards in this deck.
Unlock Deck
k this deck
75
Below is a contingency table containing frequencies and column percentages that looks at the relationship between handedness and majoring in science versus the humanities. Is there a likely relationship between handedness and major?
A) Yes
B) No
A) Yes
B) No
Unlock Deck
Unlock for access to all 145 flashcards in this deck.
Unlock Deck
k this deck
76
What is the difference between the regression coefficient in a simple regression and the regression coefficients in a multiple regression?
A) The simple regression coefficient is always less than one
B) The multiple regression coefficients do not control for other independent variables
C) The simple regression coefficient does not control for other independent variables
D) There are no differences between simple and multiple regression
Unlock Deck
Unlock for access to all 145 flashcards in this deck.
Unlock Deck
k this deck
77
In a normal distribution, 95% of the scores fall between z scores of:
A) -1 thru +1
B) -2 thru +2
C) -3 thru +3
D) 0 thru + 3
A) -1 thru +1
B) -2 thru +2
C) -3 thru +3
D) 0 thru + 3
Unlock Deck
Unlock for access to all 145 flashcards in this deck.
Unlock Deck
k this deck
78
In a simple regression, the regression coefficient tells you:
A) The mean of the variable.
B) The point where the regression line crosses the x-axis.
C) The amount of change in the dependent variable per unit change in the independent variable.
D) The amount of change in the independent variable per one unit change in the dependent variable.
A) The mean of the variable.
B) The point where the regression line crosses the x-axis.
C) The amount of change in the dependent variable per unit change in the independent variable.
D) The amount of change in the independent variable per one unit change in the dependent variable.
Unlock Deck
Unlock for access to all 145 flashcards in this deck.
Unlock Deck
k this deck
79
Multiple regression examines:
A) How two or more independent variables predict or explain the scores on a single dependent variable
B) How to create a graph that shows changes across time
C) How one independent variable is confounded with another independent variable
D) The prediction of one dependent variable from one independent variable
Unlock Deck
Unlock for access to all 145 flashcards in this deck.
Unlock Deck
k this deck
80
Below is a regression equation predicting children's math achievement from their parents' education level (years of education). Y = 1 + 2x,
Where x is the number of years of parental education.
What would be the predicted score for a child whose parents had 12 years of education?
A) 15
B) 24
C) 25
D) 3
Where x is the number of years of parental education.
What would be the predicted score for a child whose parents had 12 years of education?
A) 15
B) 24
C) 25
D) 3
Unlock Deck
Unlock for access to all 145 flashcards in this deck.
Unlock Deck
k this deck
Unlock Deck
Unlock for access to all 145 flashcards in this deck.


