Deck 4: Supply and Demand: Applications and Extensions
Full screen (f)
Question
Question
Question
Question
Question
Figure 4-2 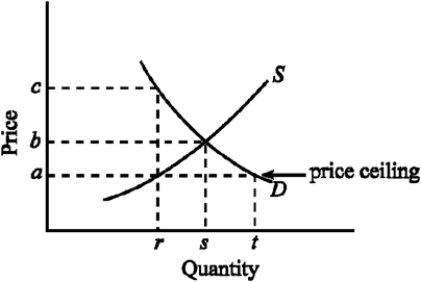
Given the demand and supply conditions shown in Figure 4-2, if the government imposes a price ceiling of a, indicate the quantity consumers would like to buy and the amount producers would be willing to supply.
A) Consumers would want to buy t; producers would be willing to sell r.
B) Consumers would want to buy r; producers would be willing to sell t.
C) Consumers would want to buy t; producers would be willing to sell s.
D) Consumers would want to buy s; producers would be willing to sell s.
Question
Question
Figure 4-1 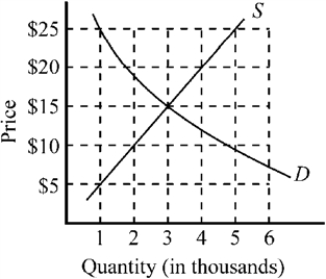
Figure 4-1 illustrates the market for compact discs. If the government imposes a price floor of $25 for compact discs, which of the following will be true?
A) Consumers would wish to purchase 1,000 compact discs.
B) Producers would wish to sell 5,000 compact discs.
C) There would be a surplus of 4,000 compact discs.
D) All of the above are true.
Question
Question
Question
Question
Question
Question
Question
Question
Question
Question
Question
Question
Question
Question
Use the figure below to answer the following question(s).
Figure 4-7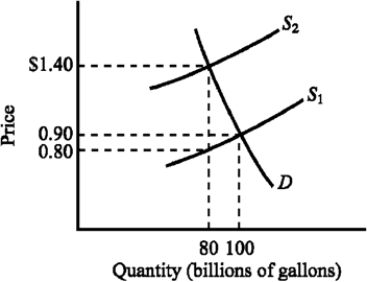
Refer to Figure 4-7. The supply curve S1 and the demand curve D indicate initial conditions in the market for gasoline. A $.60-per-gallon excise tax on gasoline is levied, which shifts the supply curve from S1 to S2. Which of the following states the actual burden of the tax?
A) $.50 for buyers and $.10 for sellers
B) $.50 for sellers and $.10 for buyers
C) The entire $.60 falls on sellers.
D) The entire $.60 falls on buyers.
Question
Figure 4-3 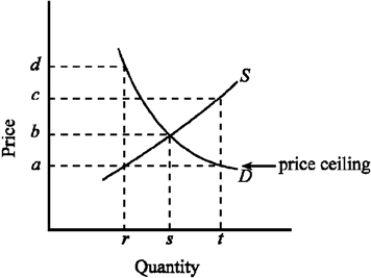
Figure 4-3 indicates the demand (D) and supply (S) for the rental housing market in a large city. If the government imposed a price ceiling of a, which of the following would be true?
A) The quantity of rental housing demanded would be t.
B) The quantity of rental housing supplied would be r.
C) There would be a shortage of rental housing.
D) All of the above are true.
Question
Use the figure below to answer the following question(s).
Figure 4-7
Refer to Figure 4-7. The supply curve S1 and the demand curve D indicate initial conditions in the market for gasoline. A $.60-per-gallon excise tax on gasoline is levied, which shifts the supply curve from S1 to S2. Imposing the tax causes the equilibrium price of gasoline to increase from
A) $.80 to $1.40.
B) $.80 to $1.50.
C) $.90 to $1.50.
D) $.90 to $1.40.
Question
Figure 4-5 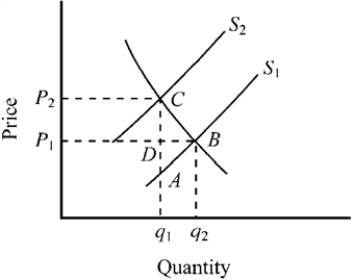
Figure 4-5 represents the market for gasoline before and after a per-gallon tax. What does the triangular area ABC represent?
A) the amount of revenue raised due to imposing the tax
B) the loss in consumer surplus due to imposing the tax
C) the loss in producer surplus due to imposing the tax
D) the deadweight loss (or excess burden) caused by the tax
Question
Use the figure below to answer the following question(s).
Figure 4-8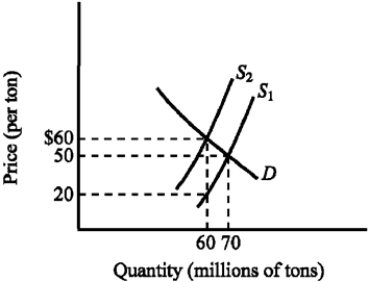
Refer to Figure 4-8. The supply curve S1 and the demand curve D indicate initial conditions in the market for soft coal. A $40-per-ton tax on soft coal is levied, shifting the supply curve from S1 to S2. Which of the following states the actual burden of the tax?
A) $10 for buyers and $30 for sellers
B) $30 for buyers and $10 for sellers
C) The entire $40 falls on sellers.
D) The entire $40 falls on buyers.
Question
Use the figure below illustrating the impact of an excise tax to answer the following question(s).
Figure 4-6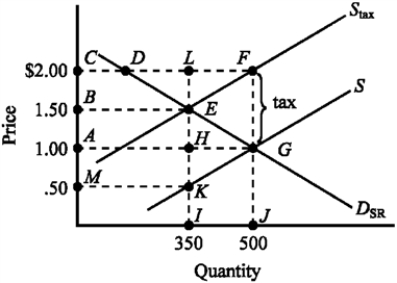
Refer to Figure 4-6. The amount of the excise tax I is
A) $.50.
B) $1.50.
C) $1.00.
D) $2.00.
Figure 4-6
Refer to Figure 4-6. The amount of the excise tax I is
A) $.50.
B) $1.50.
C) $1.00.
D) $2.00.
Question
Use the figure below to answer the following question(s).
Figure 4-9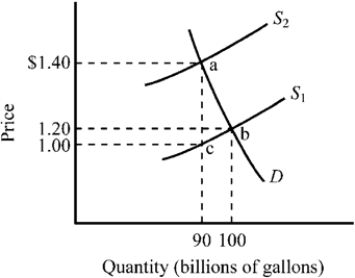
Refer to Figure 4-9. The market for gasoline was initially in equilibrium at point b and a $.40 excise tax is illustrated. What does the triangular area abc represent?
A) the revenue the government derives from the tax
B) the tax paid by consumers
C) the tax paid by producers
D) the deadweight loss (or excess burden) created by the tax
Question
Use the figure below to answer the following question(s).
Figure 4-9
Refer to Figure 4-9. The market for gasoline was initially in equilibrium at point b. If a $.40 excise tax was imposed,
A) the supply of gasoline would shift to S2.
B) the price of gasoline to consumers would increase from $1.20 per gallon to $1.40 per gallon.
C) the net price received by producers of gasoline would decline from $1.20 per gallon to $1.00 per gallon.
D) all of the above would occur.
Question
Use the figure below illustrating the impact of an excise tax to answer the following question(s).
Figure 4-6
Refer to Figure 4-6. The amount of the actual tax burden paid by consumers and producers is
A) $1.00 for consumers and $.50 for producers
B) $1.00 for consumers and $1.00 for producers.
C) $.25 for consumers and $.75 for producers.
D) $.50 for consumers and $.50 for producers.
Figure 4-6
Refer to Figure 4-6. The amount of the actual tax burden paid by consumers and producers is
A) $1.00 for consumers and $.50 for producers
B) $1.00 for consumers and $1.00 for producers.
C) $.25 for consumers and $.75 for producers.
D) $.50 for consumers and $.50 for producers.
Question
Use the figure below to answer the following question(s).
Figure 4-8
Refer to Figure 4-8. Which of the following is true?
A) The tax increases the price of soft coal by $40 per ton.
B) Since the demand for soft coal is more inelastic than the supply, consumers bear most of the burden of the tax.
C) Since the demand for soft coal is more elastic than the supply, suppliers of soft coal bear most of the burden of the tax.
D) Since the supply of soft coal is highly inelastic, the primary burden of the tax is imposed on the consumers of soft coal.
Question
Use the figure below to answer the following question(s).
Figure 4-7
Refer to Figure 4-7. Which of the following is true for the tax illustrated?
A) The tax increases the price of gasoline by $.60.
B) Since the demand for gasoline is more inelastic than the supply, consumers bear most of the burden of the tax.
C) Since the demand for gasoline is more elastic than the supply, consumers bear most of the burden of the tax.
D) Since the supply of gasoline is highly inelastic, the primary burden of the tax is imposed on the suppliers of gasoline.
Question
Use the figure below to answer the following question(s).
Figure 4-9
Refer to Figure 4-9. The market for gasoline was initially in equilibrium at point b and a $.40 excise tax is illustrated. How much revenue would the $.40 gasoline tax raise?
A) $18 million
B) $36 million
C) $72 million
D) $100 million
Figure 4-9
Refer to Figure 4-9. The market for gasoline was initially in equilibrium at point b and a $.40 excise tax is illustrated. How much revenue would the $.40 gasoline tax raise?
A) $18 million
B) $36 million
C) $72 million
D) $100 million
Question
Use the figure below to answer the following question(s).
Figure 4-7
Refer to Figure 4-7. The supply curve S1 and the demand curve D indicate initial conditions in the market for gasoline. A $.60-per-gallon excise tax on gasoline is levied. How much revenue does the $.60-per-gallon tax generate for the government?
A) $40 billion
B) $48 billion
C) $50 billion
D) $60 billion
Question
Use the figure below to answer the following question(s).
Figure 4-4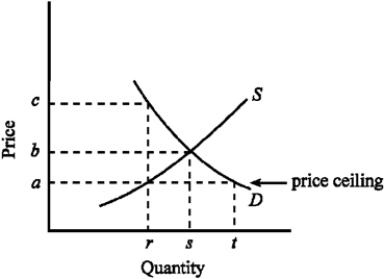
Given the demand and supply conditions shown in Figure 4-4, if the government imposes a price ceiling of a, which of the following would be true?
A) Consumers would want to buy r units.
B) Consumers would want to buy s units.
C) Producers would wish to sell s units.
D) Producers would wish to sell r units.
Question
Use the figure below to answer the following question(s).
Figure 4-9
Refer to Figure 4-9. The market for gasoline was initially in equilibrium at point b and a $.40 excise tax is illustrated. Which of the following states the actual burden of the tax?
A) $.20 for buyers and $.20 for sellers
B) $.30 for buyers and $.10 for sellers
C) The entire $.40 falls on sellers.
D) The entire $.40 falls on buyers.
Question
Use the figure below illustrating the impact of an excise tax to answer the following question(s).
Figure 4-6
The revenue generated by the tax illustrated in Figure 4-6 is given by the area
A) ACLH.
B) BEKM.
C) ACFG.
D) 0AGJ.
Figure 4-6
The revenue generated by the tax illustrated in Figure 4-6 is given by the area
A) ACLH.
B) BEKM.
C) ACFG.
D) 0AGJ.
Question
Use the figure below illustrating the impact of an excise tax to answer the following question(s).
Figure 4-6
The deadweight loss of the tax illustrated in Figure 4-6 is given by the area
A) ABEH.
B) DFE.
C) EKG.
D) EFG.
Figure 4-6
The deadweight loss of the tax illustrated in Figure 4-6 is given by the area
A) ABEH.
B) DFE.
C) EKG.
D) EFG.
Question
Use the figure below to answer the following question(s).
Figure 4-8
Refer to Figure 4-8. How much revenue does the $40-per-ton tax generate for the government?
A) $600 million
B) $700 million
C) $2.4 billion
D) $2.8 billion
Figure 4-8
Refer to Figure 4-8. How much revenue does the $40-per-ton tax generate for the government?
A) $600 million
B) $700 million
C) $2.4 billion
D) $2.8 billion
Question
Use the figure below to answer the following question(s).
Figure 4-4
Given the demand and supply conditions shown in Figure 4-4, what will happen as the result of imposing a price ceiling of a?
A) Demand for the product will decline.
B) Supply will increase.
C) There will be a shortage of the product.
D) Over time, the quality of the product offered by suppliers will increase.
Question
Use the figure below to answer the following question(s).
Figure 4-8
Refer to Figure 4-8. The supply curve S1 and the demand curve D indicate initial conditions in the market for soft coal. A $40-per-ton tax on soft coal is levied, shifting the supply curve from S1 to S2. Imposing the tax increases the equilibrium price of soft coal from
A) $20 to $60 per ton.
B) $20 to $50 per ton.
C) $50 to $60 per ton.
D) $50 to $90 per ton.
Question
Use the figure below to answer the following question(s).
Figure 4-13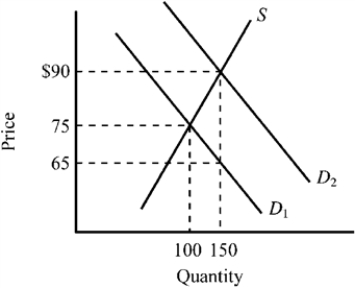
Refer to Figure 4-13. The supply curve S and the demand curve D1 indicate initial conditions in the market for flu shots. A new government program is implemented that grants buyers a $25 subsidy when they buy a flu shot, shifting the demand curve from D1 to D2. Which of the following is true for this subsidy given the information provided in the exhibit?
A) Buyers of flu shots will receive an actual benefit of $10 from the subsidy, while sellers of flu shots will receive an actual benefit of $15 from the subsidy.
B) Buyers of flu shots will receive an actual benefit of $15 from the subsidy, while sellers of flu shots will receive an actual benefit of $10 from the subsidy.
C) Buyers of flu shots will receive the full $25 benefit from the subsidy.
D) Sellers of flu shots will receive the full $25 benefit from the subsidy.
Question
Figure 4-17 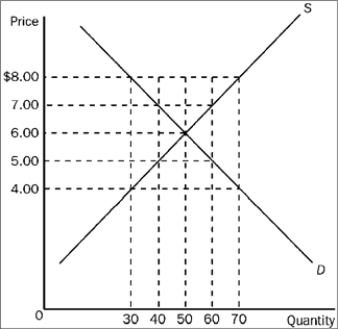
Refer to Figure 4-17. Which of the following price controls would cause a shortage of 10 units of the good?
A) a price ceiling of $5.50
B) a price floor of $5.50
C) a price ceiling of $6.50
D) a price floor of $6.50
Refer to Figure 4-17. Which of the following price controls would cause a shortage of 10 units of the good?
A) a price ceiling of $5.50
B) a price floor of $5.50
C) a price ceiling of $6.50
D) a price floor of $6.50
Question
Figure 4-17
Refer to Figure 4-17. Suppose a price ceiling of $4.50 is imposed. As a result,
A) there is a shortage of 15 units of the good.
B) the demand curve will shift to the left so as to now pass through the point (Q = 35, P = $4.50).
C) the situation is very much like the one created by a binding minimum wage.
D) the quantity of the good that is bought and sold is the same as it would have been had a price floor of $7.50 been imposed.
Question
Figure 4-16 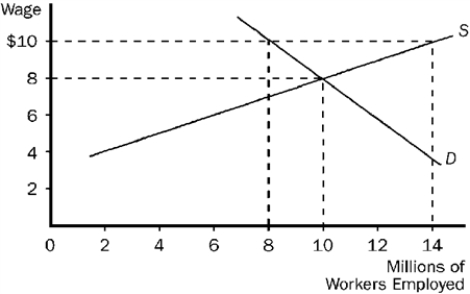
Refer to Figure 4-16. Some policymakers have argued that the government should establish a "living wage." A living wage would provide workers a reasonable standard of living in their city or region. If a living wage of $10 per hour is established in the market pictured here, we would expect
A) employment will increase to 14 million.
B) employment will decrease to 8 million.
C) the wage will actually rise to $20 per hour.
D) there will be a surplus of 14 million workers.
Question
Use the figure below to answer the following question(s).
Figure 4-10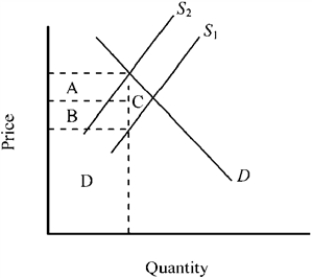
Figure 4-10 shows the market for a good before and after an excise tax is imposed. What does the triangular area C represent?
A) the deadweight loss accompanying the tax
B) the tax revenue derived from sellers
C) the tax revenue derived from buyers
D) the total tax revenue generated by the tax
Question
Use the figure below to answer the following question(s).
Figure 4-12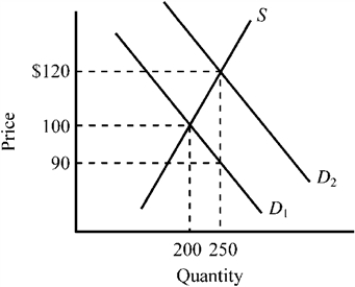
Refer to Figure 4-12. The exhibit illustrates the impact of granting a subsidy on a particular good. Which of the following is true for this subsidy given the information provided in the exhibit?
A) The subsidy has been statutorily (legally) paid to buyers.
B) The subsidy results in an increase in the selling price of the good.
C) Sellers will receive a larger proportion of the benefit from this subsidy than buyers.
D) All of the above are true.
Question
Use the figure below to answer the following question(s).
Figure 4-12
Refer to Figure 4-12. The supply curve S and the demand curve D1 indicate initial conditions in the market for college textbooks. A new government program is implemented that grants students a $30 per textbook subsidy on every textbook they purchase, shifting the demand curve from D1 to D2. Which of the following is true for this subsidy given the information provided in the exhibit?
A) Textbook buyers will receive an actual benefit of $10 from the subsidy, while textbook sellers will receive an actual benefit of $20 from the subsidy.
B) Textbook buyers will receive an actual benefit of $20 from the subsidy, while textbook sellers will receive an actual benefit of $10 from the subsidy.
C) Textbook buyers will receive the full $30 benefit from the subsidy.
D) Textbook sellers will receive the full $30 benefit from the subsidy.
Question
Figure 4-14 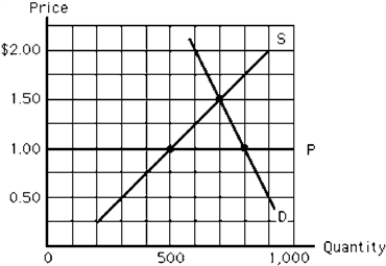
Figure 4-14 depicts the milk market. The horizontal line, P, represents a price ceiling imposed by the government. Which of the following is true?
A) In equilibrium, the quantity demanded is 800 gallons.
B) At the ceiling price, there is a surplus.
C) The quantity demanded at the price ceiling will equal the quantity supplied.
D) The equilibrium price would be $1 per unit without the price ceiling.
E) The quantity sold will be 500 gallons.
Question
Use the figure below to answer the following question(s).
Figure 4-10
Refer to Figure 4-11. On the Laffer curve shown, tax revenue could be increased by
A) decreasing the marginal tax rates if we were currently at point A.
B) decreasing the marginal tax rates if we were currently at point C.
C) increasing the marginal tax rates if we were currently at point B.
D) increasing the marginal tax rates if we were currently at point C.
Question
Figure 4-18 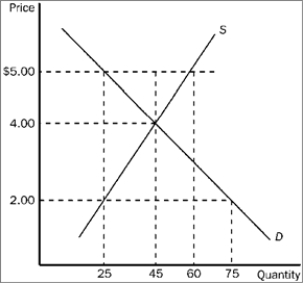
Refer to Figure 4-18. If the government imposes a price ceiling of $2.00 in this market, the result is a
A) surplus of 30 units of the good.
B) shortage of 20 units of the good.
C) shortage of 30 units of the good.
D) shortage of 50 units of the good.
Refer to Figure 4-18. If the government imposes a price ceiling of $2.00 in this market, the result is a
A) surplus of 30 units of the good.
B) shortage of 20 units of the good.
C) shortage of 30 units of the good.
D) shortage of 50 units of the good.
Question
Use the figure below to answer the following question(s).
Figure 4-12
Refer to Figure 4-12. The supply curve S and the demand curve D1 indicate initial conditions in the market for college textbooks. A new government program is implemented that grants students a $30 per textbook subsidy on every textbook they purchase, shifting the demand curve from D1 to D2. Which of the following is true for this subsidy given the information provided in the exhibit?
A) The original average selling price of textbooks was $100, and after the subsidy it rises to $120.
B) $90 represents the net price a buyer must pay for a textbook after taking into account the subsidy payment.
C) Textbook buyers will receive an actual benefit of $10 from the subsidy, while textbook sellers will receive an actual benefit of $20 from the subsidy.
D) All of the above are true.
Question
Use the figure below to answer the following question(s).
Figure 4-10
Refer to Figure 4-11. On the Laffer curve shown, which of the following is true?
A) Tax revenue would increase if marginal tax rates were lowered from point C.
B) Tax revenue would decrease if marginal tax rates were lowered from point A.
C) Tax revenues are maximized at a tax rate corresponding to point B.
D) All of the above are true.
Question
Figure 4-17
Refer to Figure 4-17. If the government imposes a price ceiling in this market at a price of $5.00, the result would be a
A) shortage of 20 units.
B) shortage of 10 units.
C) surplus of 20 units.
D) surplus of 10 units.
Refer to Figure 4-17. If the government imposes a price ceiling in this market at a price of $5.00, the result would be a
A) shortage of 20 units.
B) shortage of 10 units.
C) surplus of 20 units.
D) surplus of 10 units.
Question
Figure 4-17
Refer to Figure 4-17. Suppose a price floor of $7.00 is imposed. As a result,
A) buyers' total expenditure on the good decreases by $20.00.
B) the supply curve will shift to the left so as to now pass through the point (Q = 40, P = $7.00).
C) the quantity of the good demanded decreases by 20 units.
D) the price of the good continues to serve as the rationing mechanism.
Question
Figure 4-14
In Figure 4-14, which of the following is true at the price ceiling, P?
A) The excess quantity supplied equals 300 gallons.
B) The excess quantity demanded equals 300 gallons.
C) The excess quantity supplied equals 500 gallons.
D) The excess quantity demanded equals 800 gallons.
E) Sales will be equal to 800 gallons.
Question
Figure 4-15 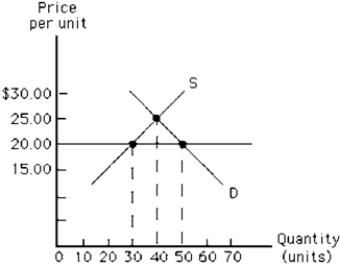
In Figure 4-15, suppose a price floor is established at $20.00. What is the result?
A) a shortage of 10 units
B) a surplus of 10 units
C) a shortage of 20 units
D) a surplus of 20 units
E) there is no change from the situation that exists at the equilibrium price
In Figure 4-15, suppose a price floor is established at $20.00. What is the result?
A) a shortage of 10 units
B) a surplus of 10 units
C) a shortage of 20 units
D) a surplus of 20 units
E) there is no change from the situation that exists at the equilibrium price
Question
Figure 4-18
Refer to Figure 4-18. In this market, which of the following price controls would be binding?
A) a price ceiling of $2.00, and it would cause a shortage
B) a price ceiling of $5.00, and it would cause a surplus
C) a price floor of $2.00, and it would cause a shortage
D) All of the above are correct.
Question
Use the figure below to answer the following question(s).
Figure 4-13
Refer to Figure 4-13. The exhibit illustrates the impact of granting a subsidy on a particular good. Which of the following is true for this subsidy given the information provided in the exhibit?
A) The subsidy has been statutorily (legally) paid to sellers.
B) The subsidy results in a decrease in the market selling price of the good.
C) Sellers will receive a larger proportion of the benefit from this subsidy than buyers.
D) The subsidy results in a reduction in the quantity purchased.
Question
Use the figure below to answer the following question(s).
Figure 4-13
Refer to Figure 4-13. The supply curve S and the demand curve D1 indicate initial conditions in the market for flu shots. A new government program is implemented that grants buyers a $25 subsidy when they buy a flu shot, shifting the demand curve from D1 to D2. Which of the following is true for this subsidy given the information provided in the figure?
A) The original price of a flu shot was $75, and after the subsidy, it rises to $90.
B) $65 represents the net price a buyer must pay for a flu shot after taking into account the subsidy payment.
C) Buyers of flu shots will receive an actual benefit of $10 from the subsidy, while sellers of flu shots will receive an actual benefit of $15 from the subsidy.
D) All of the above are true.
Question
Use the figure below to answer the following question(s).
Figure 4-10
Refer to Figure 4-10. The accompanying graph shows the market for a good before and after an excise tax is imposed. The total tax revenue generated is indicated by
A) area A + area B + area D.
B) area A + area B + area C.
C) area A + area B.
D) area D only.
Figure 4-10
Refer to Figure 4-10. The accompanying graph shows the market for a good before and after an excise tax is imposed. The total tax revenue generated is indicated by
A) area A + area B + area D.
B) area A + area B + area C.
C) area A + area B.
D) area D only.
Question
Figure 4-21 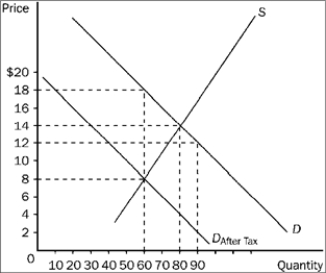
Refer to Figure 4-21. The price received by sellers after the tax is imposed is
A) $18.
B) $14.
C) $12.
D) $8.
Refer to Figure 4-21. The price received by sellers after the tax is imposed is
A) $18.
B) $14.
C) $12.
D) $8.
Question
Figure 4-20 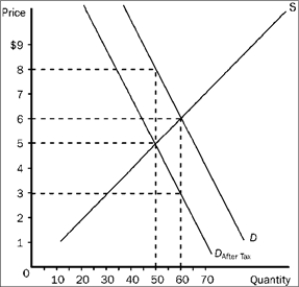
Refer to Figure 4-20. As the figure is drawn, who sends the tax payments to the government?
A) the buyers
B) the sellers
C) A portion of the tax payments is sent by the buyers and the remaining portion is sent by the sellers.
D) The question of who sends the tax payments cannot be determined from the figure.
Question
Figure 4-20
Refer to Figure 4-20. The price that sellers receive after the tax is imposed is
A) $8.
B) $6.
C) $5.
D) $3.
Refer to Figure 4-20. The price that sellers receive after the tax is imposed is
A) $8.
B) $6.
C) $5.
D) $3.
Question
Figure 4-20
Refer to Figure 4-20. The price that buyers pay after the tax is imposed is
A) $8.
B) $6.
C) $5.
D) $3.
Refer to Figure 4-20. The price that buyers pay after the tax is imposed is
A) $8.
B) $6.
C) $5.
D) $3.
Question
Figure 4-20
Refer to Figure 4-20. The burden of the tax on buyers is
A) $1.00 per unit.
B) $1.50 per unit.
C) $2.00 per unit.
D) $3.00 per unit.
Refer to Figure 4-20. The burden of the tax on buyers is
A) $1.00 per unit.
B) $1.50 per unit.
C) $2.00 per unit.
D) $3.00 per unit.
Question
Figure 4-20
Refer to Figure 4-20. The equilibrium price in the market before the tax is imposed is
A) $8.
B) $6.
C) $5.
D) $3.
Refer to Figure 4-20. The equilibrium price in the market before the tax is imposed is
A) $8.
B) $6.
C) $5.
D) $3.
Question
Figure 4-21
Refer to Figure 4-21. The per-unit burden of the tax is
A) $4 on buyers and $4 on sellers.
B) $5 on buyers and $5 on sellers.
C) $4 on buyers and $6 on sellers.
D) $6 on buyers and $4 on sellers.
Refer to Figure 4-21. The per-unit burden of the tax is
A) $4 on buyers and $4 on sellers.
B) $5 on buyers and $5 on sellers.
C) $4 on buyers and $6 on sellers.
D) $6 on buyers and $4 on sellers.
Question
Figure 4-19 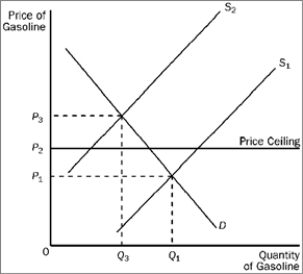
Refer to Figure 4-19. When the price ceiling applies in this market and the supply curve for gasoline shifts from S1 to S2, the resulting quantity of gasoline that is bought and sold is
A) less than Q3.
B) Q3
C) between Q1 and Q3.
D) at least Q1.
Refer to Figure 4-19. When the price ceiling applies in this market and the supply curve for gasoline shifts from S1 to S2, the resulting quantity of gasoline that is bought and sold is
A) less than Q3.
B) Q3
C) between Q1 and Q3.
D) at least Q1.
Question
Figure 4-18
Refer to Figure 4-18. The price of the good would continue to serve as the rationing mechanism if
A) a price ceiling of $4.00 were imposed.
B) a price ceiling of $5.00 were imposed.
C) a price floor of $3.00 were imposed.
D) All of the above are correct.
Refer to Figure 4-18. The price of the good would continue to serve as the rationing mechanism if
A) a price ceiling of $4.00 were imposed.
B) a price ceiling of $5.00 were imposed.
C) a price floor of $3.00 were imposed.
D) All of the above are correct.
Question
Figure 4-20
Refer to Figure 4-20. Suppose the same S and D curves apply, and a tax of the same amount per unit as shown here is imposed. Now, however, the sellers of the good, rather than the buyers, are required to pay the tax to the government. Now, relative to the case depicted in the figure,
A) the burden on buyers will be larger and the burden on sellers will be smaller.
B) the burden on buyers will be smaller and the burden on sellers will be larger.
C) the burden on buyers will be the same and the burden on sellers will be the same.
D) The relative burdens in the two cases cannot be determined without further information.
Question
Figure 4-21
Refer to Figure 4-21. The price paid by buyers after the tax is imposed is
A) $18.
B) $14.
C) $12.
D) $8.
Refer to Figure 4-21. The price paid by buyers after the tax is imposed is
A) $18.
B) $14.
C) $12.
D) $8.
Question
Figure 4-22 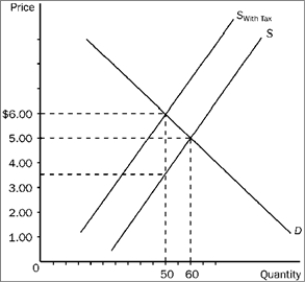
Refer to Figure 4-22. The equilibrium price in the market before the tax is imposed is
A) $1.00.
B) $3.50.
C) $5.00.
D) $6.00.
Refer to Figure 4-22. The equilibrium price in the market before the tax is imposed is
A) $1.00.
B) $3.50.
C) $5.00.
D) $6.00.
Question
Figure 4-20
Refer to Figure 4-20. The amount of the tax per unit is
A) $1.
B) $2.
C) $3.
D) $5.
Refer to Figure 4-20. The amount of the tax per unit is
A) $1.
B) $2.
C) $3.
D) $5.
Question
Figure 4-20
Refer to Figure 4-20. The burden of the tax on sellers is
A) $1.00 per unit.
B) $1.50 per unit.
C) $2.00 per unit.
D) $3.00 per unit.
Refer to Figure 4-20. The burden of the tax on sellers is
A) $1.00 per unit.
B) $1.50 per unit.
C) $2.00 per unit.
D) $3.00 per unit.
Question
Figure 4-21
Refer to Figure 4-21. The amount of the tax per unit is
A) $10.
B) $6.
C) $4.
D) $2.
Refer to Figure 4-21. The amount of the tax per unit is
A) $10.
B) $6.
C) $4.
D) $2.
Question
Figure 4-22
Refer to Figure 4-22. The effective price sellers receive after the tax is imposed is
A) $1.00.
B) $3.50.
C) $5.00.
D) $6.00.
Refer to Figure 4-22. The effective price sellers receive after the tax is imposed is
A) $1.00.
B) $3.50.
C) $5.00.
D) $6.00.
Question
Figure 4-21
Refer to Figure 4-21. How much tax revenue does this tax produce for the government?
A) $480
B) $600
C) $800
D) $1,080
Refer to Figure 4-21. How much tax revenue does this tax produce for the government?
A) $480
B) $600
C) $800
D) $1,080
Question
Figure 4-19
Refer to Figure 4-19. When the price ceiling applies in this market and the supply curve for gasoline shifts from S1 to S2,
A) the price will increase to P3.
B) a surplus will occur at the new market price of P2.
C) the market price will stay at P1 due to the price ceiling.
D) a shortage will occur at the price ceiling of P2.
Question
Figure 4-22
Refer to Figure 4-22. The amount of the tax per unit is
A) $1.00.
B) $1.50.
C) $2.50.
D) $3.50.
Refer to Figure 4-22. The amount of the tax per unit is
A) $1.00.
B) $1.50.
C) $2.50.
D) $3.50.
Question
Figure 4-22
Refer to Figure 4-22. The price paid by buyers after the tax is imposed is
A) $1.00.
B) $3.50.
C) $5.00.
D) $6.00.
Refer to Figure 4-22. The price paid by buyers after the tax is imposed is
A) $1.00.
B) $3.50.
C) $5.00.
D) $6.00.

Unlock Deck
Sign up to unlock the cards in this deck!
Unlock Deck
Unlock Deck
1/270
Play
Full screen (f)
Deck 4: Supply and Demand: Applications and Extensions
1
If the demand for a good is highly inelastic, a tax on the good
A) places the burden of the tax equally on buyers and sellers
B) permits sellers to pass most of the cost increase resulting from the tax on to the consumers of the product
C) reduces the profits earned by sellers since they must write the check to pay the tax
D) makes the demand more inelastic
E) makes the demand more elastic
permits sellers to pass most of the cost increase resulting from the tax on to the consumers of the product
2
In the main chorus of the Keynes-Hayek rap lyrics, Keynes states "I want to steer markets" and Hayek replies, "I want them set free." These statements are referring to
A) the tendency of Keynesians to favor government intervention and central planning and the tendency of Hayekians to favor free markets.
B) the tendency of Keynesians to favor restrictive fiscal policy and the tendency of Hayekians to favor expansionary fiscal policy.
C) the tendency of Keynesians to favor budget deficits and the tendency of Hayekians to insist on budget surpluses.
D) the tendency of Keynesians to favor fiscal policy and of Heyekians to favor monetary policy.
the tendency of Keynesians to favor government intervention and central planning and the tendency of Hayekians to favor free markets.
3
Adam Smith stated, "The man of system is apt to be very wise in his own conceit. He seems to imagine that he can arrange the different members of a great society with as much ease as the hand arranges the different pieces upon a chess-board." Which is true of this statement?
A) Keynes would tend to agree with the statement; Heyek would disagree with it.
B) Keynes would tend to disagree with the statement; Hayek would agree with it.
C) As the rap video indicates, both Keynes and Hayek strongly agree with this statement.
D) As the rap video indicates, both Keynes and Hayek strongly disagree with this statement.
Keynes would tend to disagree with the statement; Hayek would agree with it.
4
John Maynard Keynes and Friedrich Hayek
A) had similar views with regard to the cause of the Great Depression and what might be done to prevent it from happening again.
B) both believed that perverse monetary policy was the primary cause of the ups and downs of the business cycle.
C) both believed that budget deficits and surpluses could be used to smooth the ups and downs of the business cycle.
D) had polar opposite views with regard to the underlying causes of economic booms and bust, but nonetheless their scholarly work commanded widespread respect among economists.
Unlock Deck
Unlock for access to all 270 flashcards in this deck.
Unlock Deck
k this deck
5
Figure 4-2
Given the demand and supply conditions shown in Figure 4-2, if the government imposes a price ceiling of a, indicate the quantity consumers would like to buy and the amount producers would be willing to supply.
A) Consumers would want to buy t; producers would be willing to sell r.
B) Consumers would want to buy r; producers would be willing to sell t.
C) Consumers would want to buy t; producers would be willing to sell s.
D) Consumers would want to buy s; producers would be willing to sell s.
Unlock Deck
Unlock for access to all 270 flashcards in this deck.
Unlock Deck
k this deck
6
What did Keynes and Hayek believe about government central planning?
A) Both believed that central planning could be used to allocate resources efficiently.
B) Both believed that perverse political incentives would undermine the ability of central planners to allocate resources efficiently.
C) Keynes believed that government central planning could improve on market outcomes; Hayek disagreed, arguing that both political incentives and insufficient information would undermine their ability to do so.
D) Keynes believe that central planning would fail because the policy-makers did not have sufficient information to plan efficiently; Hayek believed that efficient central planning was possible if political decisions were made democratically.
Unlock Deck
Unlock for access to all 270 flashcards in this deck.
Unlock Deck
k this deck
7
Figure 4-1
Figure 4-1 illustrates the market for compact discs. If the government imposes a price floor of $25 for compact discs, which of the following will be true?
A) Consumers would wish to purchase 1,000 compact discs.
B) Producers would wish to sell 5,000 compact discs.
C) There would be a surplus of 4,000 compact discs.
D) All of the above are true.
Unlock Deck
Unlock for access to all 270 flashcards in this deck.
Unlock Deck
k this deck
8
Which of the following is a major disadvantage of setting the price of a good below equilibrium and using waiting in line rather than price to ration the good?
A) Compared to price rationing, waiting in line is unfair since it is easier for those with higher incomes to wait in line.
B) Waiting in line imposes a cost on the consumer; paying higher prices does not.
C) Both waiting in line and higher prices are costly to consumers, but unlike the payment of a higher price, waiting in line does not provide suppliers with an incentive to expand future output.
D) Waiting in line benefits consumers at the expense of producers.
Unlock Deck
Unlock for access to all 270 flashcards in this deck.
Unlock Deck
k this deck
9
If there was an increase in the excise tax imposed on guitar suppliers, what would be the effect on the equilibrium price and quantity of guitars?
A) Price increases; quantity decreases
B) Price decreases; quantity decreases
C) Price increases; quantity increases
D) Price decreases; quantity increases
A) Price increases; quantity decreases
B) Price decreases; quantity decreases
C) Price increases; quantity increases
D) Price decreases; quantity increases
Unlock Deck
Unlock for access to all 270 flashcards in this deck.
Unlock Deck
k this deck
10
In his book The Road to Serfdom, Friedrich Hayek argued that the growth of government
A) was essential if the ups and downs of the business cycle were going to be controlled.
B) must be increased if western democracies were going to survive.
C) could only be achieved if monetary policy-makers were willing to expand the supply of money more rapidly.
D) endangered freedom and moved Western democracies toward tyranny, just as it had done in Nazi Germany and the Soviet Union.
Unlock Deck
Unlock for access to all 270 flashcards in this deck.
Unlock Deck
k this deck
11
The more elastic the supply of a product, the more likely it is that the
A) burden of a tax on the product will fall on sellers.
B) burden of a tax on the product will fall on buyers.
C) burden of a tax on the product will fall equally on both buyers and sellers.
D) deadweight loss of the tax will be smaller.
A) burden of a tax on the product will fall on sellers.
B) burden of a tax on the product will fall on buyers.
C) burden of a tax on the product will fall equally on both buyers and sellers.
D) deadweight loss of the tax will be smaller.
Unlock Deck
Unlock for access to all 270 flashcards in this deck.
Unlock Deck
k this deck
12
According to the Keynesian view, capitalism
A) is a highly productive form of economic organization that works best when government intervention is least.
B) experiences booms and busts because of the instability of private investment that is driven by fickle changes in business optimism.
C) experiences booms and busts that are primarily the result of inappropriate monetary policy.
D) experiences fluctuations in aggregate demand that cannot be controlled with fiscal policy.
Unlock Deck
Unlock for access to all 270 flashcards in this deck.
Unlock Deck
k this deck
13
When a price floor is above the equilibrium price,
A) quantity demanded will exceed quantity supplied, so there will be a shortage.
B) quantity supplied will exceed quantity demanded, so there will be a surplus.
C) the market will be in equilibrium.
D) This is a trick question because price floors are generally set below the equilibrium price.
A) quantity demanded will exceed quantity supplied, so there will be a shortage.
B) quantity supplied will exceed quantity demanded, so there will be a surplus.
C) the market will be in equilibrium.
D) This is a trick question because price floors are generally set below the equilibrium price.
Unlock Deck
Unlock for access to all 270 flashcards in this deck.
Unlock Deck
k this deck
14
Rent control applies to about two-thirds of the private rental housing in New York City. Economic theory suggests that the below-equilibrium prices established by rent controls would
A) create a surplus of rental housing.
B) promote a rapid increase in the future supply of housing.
C) result in poor service and quality deterioration of many rental units.
D) lead to a reduction in housing discrimination against minorities.
A) create a surplus of rental housing.
B) promote a rapid increase in the future supply of housing.
C) result in poor service and quality deterioration of many rental units.
D) lead to a reduction in housing discrimination against minorities.
Unlock Deck
Unlock for access to all 270 flashcards in this deck.
Unlock Deck
k this deck
15
Which of the following is the most likely result of an increase in the minimum wage?
A) an increase in the employment of unskilled workers
B) a decrease in the number of workers seeking minimum wage jobs
C) an increase in the demand for unskilled workers
D) a decrease in the employment of unskilled workers
A) an increase in the employment of unskilled workers
B) a decrease in the number of workers seeking minimum wage jobs
C) an increase in the demand for unskilled workers
D) a decrease in the employment of unskilled workers
Unlock Deck
Unlock for access to all 270 flashcards in this deck.
Unlock Deck
k this deck
16
When a government subsidy is granted to the sellers of a product, buyers can end up capturing some of the benefit because
A) the market price of the product will fall in response to the subsidy.
B) the market price of the product will rise in response to the subsidy.
C) the market price of the product will not change in response to the subsidy.
D) producers will reduce the supply of the product.
A) the market price of the product will fall in response to the subsidy.
B) the market price of the product will rise in response to the subsidy.
C) the market price of the product will not change in response to the subsidy.
D) producers will reduce the supply of the product.
Unlock Deck
Unlock for access to all 270 flashcards in this deck.
Unlock Deck
k this deck
17
According to Friedrich Hayek and his followers, the booms and busts of the business cycle are primarily the result of
A) fluctuations in aggregate demand.
B) the "animal spirits" of private investors.
C) excessive credit expansion and artificially low interest rates that trigger malinvestment.
D) the unwillingness of political decision-makers to follow the advice of macroeconomists who know how to alter fiscal policy in a manner that would virtually eliminate the ups and downs of the business cycle.
Unlock Deck
Unlock for access to all 270 flashcards in this deck.
Unlock Deck
k this deck
18
Other things constant, a decrease in the demand for hair dryers will
A) increase the price of hair dryers.
B) increase the quantity supplied of hair dryers.
C) increase the demand for hair dryer manufacturing workers.
D) decrease the demand for hair dryer manufacturing workers.
A) increase the price of hair dryers.
B) increase the quantity supplied of hair dryers.
C) increase the demand for hair dryer manufacturing workers.
D) decrease the demand for hair dryer manufacturing workers.
Unlock Deck
Unlock for access to all 270 flashcards in this deck.
Unlock Deck
k this deck
19
The General Theory of John Maynard Keynes exerted a major impact on macroeconomics during the 20th century primarily because
A) it provided the only logically consistent view of what caused the Great Depression.
B) it provided a reasonable explanation of what went wrong during the Great Depression and what could be done to prevent it from happening again.
C) it explained how gross domestic product could be measured and why this was important.
D) it derived the conditions necessary for maximum efficiency of resource use and explained how these conditions could be achieved through central planning.
Unlock Deck
Unlock for access to all 270 flashcards in this deck.
Unlock Deck
k this deck
20
The Laffer curve illustrates the concept that
A) an increase in marginal tax rates will always cause tax revenues to increase.
B) an increase in marginal tax rates will always cause tax revenues to decrease.
C) when marginal tax rates are quite high, a decrease in the tax rate may cause tax revenues to increase.
D) when marginal taxes are quite low, an increase in the tax rate will probably cause tax revenues to decline.
Unlock Deck
Unlock for access to all 270 flashcards in this deck.
Unlock Deck
k this deck
21
Use the figure below to answer the following question(s).
Figure 4-7
Refer to Figure 4-7. The supply curve S1 and the demand curve D indicate initial conditions in the market for gasoline. A $.60-per-gallon excise tax on gasoline is levied, which shifts the supply curve from S1 to S2. Which of the following states the actual burden of the tax?
A) $.50 for buyers and $.10 for sellers
B) $.50 for sellers and $.10 for buyers
C) The entire $.60 falls on sellers.
D) The entire $.60 falls on buyers.
Unlock Deck
Unlock for access to all 270 flashcards in this deck.
Unlock Deck
k this deck
22
Figure 4-3
Figure 4-3 indicates the demand (D) and supply (S) for the rental housing market in a large city. If the government imposed a price ceiling of a, which of the following would be true?
A) The quantity of rental housing demanded would be t.
B) The quantity of rental housing supplied would be r.
C) There would be a shortage of rental housing.
D) All of the above are true.
Unlock Deck
Unlock for access to all 270 flashcards in this deck.
Unlock Deck
k this deck
23
Use the figure below to answer the following question(s).
Figure 4-7
Refer to Figure 4-7. The supply curve S1 and the demand curve D indicate initial conditions in the market for gasoline. A $.60-per-gallon excise tax on gasoline is levied, which shifts the supply curve from S1 to S2. Imposing the tax causes the equilibrium price of gasoline to increase from
A) $.80 to $1.40.
B) $.80 to $1.50.
C) $.90 to $1.50.
D) $.90 to $1.40.
Unlock Deck
Unlock for access to all 270 flashcards in this deck.
Unlock Deck
k this deck
24
Figure 4-5
Figure 4-5 represents the market for gasoline before and after a per-gallon tax. What does the triangular area ABC represent?
A) the amount of revenue raised due to imposing the tax
B) the loss in consumer surplus due to imposing the tax
C) the loss in producer surplus due to imposing the tax
D) the deadweight loss (or excess burden) caused by the tax
Unlock Deck
Unlock for access to all 270 flashcards in this deck.
Unlock Deck
k this deck
25
Use the figure below to answer the following question(s).
Figure 4-8
Refer to Figure 4-8. The supply curve S1 and the demand curve D indicate initial conditions in the market for soft coal. A $40-per-ton tax on soft coal is levied, shifting the supply curve from S1 to S2. Which of the following states the actual burden of the tax?
A) $10 for buyers and $30 for sellers
B) $30 for buyers and $10 for sellers
C) The entire $40 falls on sellers.
D) The entire $40 falls on buyers.
Unlock Deck
Unlock for access to all 270 flashcards in this deck.
Unlock Deck
k this deck
26
Use the figure below illustrating the impact of an excise tax to answer the following question(s).
Figure 4-6
Refer to Figure 4-6. The amount of the excise tax I is
A) $.50.
B) $1.50.
C) $1.00.
D) $2.00.
Figure 4-6
Refer to Figure 4-6. The amount of the excise tax I is
A) $.50.
B) $1.50.
C) $1.00.
D) $2.00.
Unlock Deck
Unlock for access to all 270 flashcards in this deck.
Unlock Deck
k this deck
27
Use the figure below to answer the following question(s).
Figure 4-9
Refer to Figure 4-9. The market for gasoline was initially in equilibrium at point b and a $.40 excise tax is illustrated. What does the triangular area abc represent?
A) the revenue the government derives from the tax
B) the tax paid by consumers
C) the tax paid by producers
D) the deadweight loss (or excess burden) created by the tax
Unlock Deck
Unlock for access to all 270 flashcards in this deck.
Unlock Deck
k this deck
28
Use the figure below to answer the following question(s).
Figure 4-9
Refer to Figure 4-9. The market for gasoline was initially in equilibrium at point b. If a $.40 excise tax was imposed,
A) the supply of gasoline would shift to S2.
B) the price of gasoline to consumers would increase from $1.20 per gallon to $1.40 per gallon.
C) the net price received by producers of gasoline would decline from $1.20 per gallon to $1.00 per gallon.
D) all of the above would occur.
Unlock Deck
Unlock for access to all 270 flashcards in this deck.
Unlock Deck
k this deck
29
Use the figure below illustrating the impact of an excise tax to answer the following question(s).
Figure 4-6
Refer to Figure 4-6. The amount of the actual tax burden paid by consumers and producers is
A) $1.00 for consumers and $.50 for producers
B) $1.00 for consumers and $1.00 for producers.
C) $.25 for consumers and $.75 for producers.
D) $.50 for consumers and $.50 for producers.
Figure 4-6
Refer to Figure 4-6. The amount of the actual tax burden paid by consumers and producers is
A) $1.00 for consumers and $.50 for producers
B) $1.00 for consumers and $1.00 for producers.
C) $.25 for consumers and $.75 for producers.
D) $.50 for consumers and $.50 for producers.
Unlock Deck
Unlock for access to all 270 flashcards in this deck.
Unlock Deck
k this deck
30
Use the figure below to answer the following question(s).
Figure 4-8
Refer to Figure 4-8. Which of the following is true?
A) The tax increases the price of soft coal by $40 per ton.
B) Since the demand for soft coal is more inelastic than the supply, consumers bear most of the burden of the tax.
C) Since the demand for soft coal is more elastic than the supply, suppliers of soft coal bear most of the burden of the tax.
D) Since the supply of soft coal is highly inelastic, the primary burden of the tax is imposed on the consumers of soft coal.
Unlock Deck
Unlock for access to all 270 flashcards in this deck.
Unlock Deck
k this deck
31
Use the figure below to answer the following question(s).
Figure 4-7
Refer to Figure 4-7. Which of the following is true for the tax illustrated?
A) The tax increases the price of gasoline by $.60.
B) Since the demand for gasoline is more inelastic than the supply, consumers bear most of the burden of the tax.
C) Since the demand for gasoline is more elastic than the supply, consumers bear most of the burden of the tax.
D) Since the supply of gasoline is highly inelastic, the primary burden of the tax is imposed on the suppliers of gasoline.
Unlock Deck
Unlock for access to all 270 flashcards in this deck.
Unlock Deck
k this deck
32
Use the figure below to answer the following question(s).
Figure 4-9
Refer to Figure 4-9. The market for gasoline was initially in equilibrium at point b and a $.40 excise tax is illustrated. How much revenue would the $.40 gasoline tax raise?
A) $18 million
B) $36 million
C) $72 million
D) $100 million
Figure 4-9
Refer to Figure 4-9. The market for gasoline was initially in equilibrium at point b and a $.40 excise tax is illustrated. How much revenue would the $.40 gasoline tax raise?
A) $18 million
B) $36 million
C) $72 million
D) $100 million
Unlock Deck
Unlock for access to all 270 flashcards in this deck.
Unlock Deck
k this deck
33
Use the figure below to answer the following question(s).
Figure 4-7
Refer to Figure 4-7. The supply curve S1 and the demand curve D indicate initial conditions in the market for gasoline. A $.60-per-gallon excise tax on gasoline is levied. How much revenue does the $.60-per-gallon tax generate for the government?
A) $40 billion
B) $48 billion
C) $50 billion
D) $60 billion
Unlock Deck
Unlock for access to all 270 flashcards in this deck.
Unlock Deck
k this deck
34
Use the figure below to answer the following question(s).
Figure 4-4
Given the demand and supply conditions shown in Figure 4-4, if the government imposes a price ceiling of a, which of the following would be true?
A) Consumers would want to buy r units.
B) Consumers would want to buy s units.
C) Producers would wish to sell s units.
D) Producers would wish to sell r units.
Unlock Deck
Unlock for access to all 270 flashcards in this deck.
Unlock Deck
k this deck
35
Use the figure below to answer the following question(s).
Figure 4-9
Refer to Figure 4-9. The market for gasoline was initially in equilibrium at point b and a $.40 excise tax is illustrated. Which of the following states the actual burden of the tax?
A) $.20 for buyers and $.20 for sellers
B) $.30 for buyers and $.10 for sellers
C) The entire $.40 falls on sellers.
D) The entire $.40 falls on buyers.
Unlock Deck
Unlock for access to all 270 flashcards in this deck.
Unlock Deck
k this deck
36
Use the figure below illustrating the impact of an excise tax to answer the following question(s).
Figure 4-6
The revenue generated by the tax illustrated in Figure 4-6 is given by the area
A) ACLH.
B) BEKM.
C) ACFG.
D) 0AGJ.
Figure 4-6
The revenue generated by the tax illustrated in Figure 4-6 is given by the area
A) ACLH.
B) BEKM.
C) ACFG.
D) 0AGJ.
Unlock Deck
Unlock for access to all 270 flashcards in this deck.
Unlock Deck
k this deck
37
Use the figure below illustrating the impact of an excise tax to answer the following question(s).
Figure 4-6
The deadweight loss of the tax illustrated in Figure 4-6 is given by the area
A) ABEH.
B) DFE.
C) EKG.
D) EFG.
Figure 4-6
The deadweight loss of the tax illustrated in Figure 4-6 is given by the area
A) ABEH.
B) DFE.
C) EKG.
D) EFG.
Unlock Deck
Unlock for access to all 270 flashcards in this deck.
Unlock Deck
k this deck
38
Use the figure below to answer the following question(s).
Figure 4-8
Refer to Figure 4-8. How much revenue does the $40-per-ton tax generate for the government?
A) $600 million
B) $700 million
C) $2.4 billion
D) $2.8 billion
Figure 4-8
Refer to Figure 4-8. How much revenue does the $40-per-ton tax generate for the government?
A) $600 million
B) $700 million
C) $2.4 billion
D) $2.8 billion
Unlock Deck
Unlock for access to all 270 flashcards in this deck.
Unlock Deck
k this deck
39
Use the figure below to answer the following question(s).
Figure 4-4
Given the demand and supply conditions shown in Figure 4-4, what will happen as the result of imposing a price ceiling of a?
A) Demand for the product will decline.
B) Supply will increase.
C) There will be a shortage of the product.
D) Over time, the quality of the product offered by suppliers will increase.
Unlock Deck
Unlock for access to all 270 flashcards in this deck.
Unlock Deck
k this deck
40
Use the figure below to answer the following question(s).
Figure 4-8
Refer to Figure 4-8. The supply curve S1 and the demand curve D indicate initial conditions in the market for soft coal. A $40-per-ton tax on soft coal is levied, shifting the supply curve from S1 to S2. Imposing the tax increases the equilibrium price of soft coal from
A) $20 to $60 per ton.
B) $20 to $50 per ton.
C) $50 to $60 per ton.
D) $50 to $90 per ton.
Unlock Deck
Unlock for access to all 270 flashcards in this deck.
Unlock Deck
k this deck
41
Use the figure below to answer the following question(s).
Figure 4-13
Refer to Figure 4-13. The supply curve S and the demand curve D1 indicate initial conditions in the market for flu shots. A new government program is implemented that grants buyers a $25 subsidy when they buy a flu shot, shifting the demand curve from D1 to D2. Which of the following is true for this subsidy given the information provided in the exhibit?
A) Buyers of flu shots will receive an actual benefit of $10 from the subsidy, while sellers of flu shots will receive an actual benefit of $15 from the subsidy.
B) Buyers of flu shots will receive an actual benefit of $15 from the subsidy, while sellers of flu shots will receive an actual benefit of $10 from the subsidy.
C) Buyers of flu shots will receive the full $25 benefit from the subsidy.
D) Sellers of flu shots will receive the full $25 benefit from the subsidy.
Unlock Deck
Unlock for access to all 270 flashcards in this deck.
Unlock Deck
k this deck
42
Figure 4-17
Refer to Figure 4-17. Which of the following price controls would cause a shortage of 10 units of the good?
A) a price ceiling of $5.50
B) a price floor of $5.50
C) a price ceiling of $6.50
D) a price floor of $6.50
Refer to Figure 4-17. Which of the following price controls would cause a shortage of 10 units of the good?
A) a price ceiling of $5.50
B) a price floor of $5.50
C) a price ceiling of $6.50
D) a price floor of $6.50
Unlock Deck
Unlock for access to all 270 flashcards in this deck.
Unlock Deck
k this deck
43
Figure 4-17
Refer to Figure 4-17. Suppose a price ceiling of $4.50 is imposed. As a result,
A) there is a shortage of 15 units of the good.
B) the demand curve will shift to the left so as to now pass through the point (Q = 35, P = $4.50).
C) the situation is very much like the one created by a binding minimum wage.
D) the quantity of the good that is bought and sold is the same as it would have been had a price floor of $7.50 been imposed.
Unlock Deck
Unlock for access to all 270 flashcards in this deck.
Unlock Deck
k this deck
44
Figure 4-16
Refer to Figure 4-16. Some policymakers have argued that the government should establish a "living wage." A living wage would provide workers a reasonable standard of living in their city or region. If a living wage of $10 per hour is established in the market pictured here, we would expect
A) employment will increase to 14 million.
B) employment will decrease to 8 million.
C) the wage will actually rise to $20 per hour.
D) there will be a surplus of 14 million workers.
Unlock Deck
Unlock for access to all 270 flashcards in this deck.
Unlock Deck
k this deck
45
Use the figure below to answer the following question(s).
Figure 4-10
Figure 4-10 shows the market for a good before and after an excise tax is imposed. What does the triangular area C represent?
A) the deadweight loss accompanying the tax
B) the tax revenue derived from sellers
C) the tax revenue derived from buyers
D) the total tax revenue generated by the tax
Unlock Deck
Unlock for access to all 270 flashcards in this deck.
Unlock Deck
k this deck
46
Use the figure below to answer the following question(s).
Figure 4-12
Refer to Figure 4-12. The exhibit illustrates the impact of granting a subsidy on a particular good. Which of the following is true for this subsidy given the information provided in the exhibit?
A) The subsidy has been statutorily (legally) paid to buyers.
B) The subsidy results in an increase in the selling price of the good.
C) Sellers will receive a larger proportion of the benefit from this subsidy than buyers.
D) All of the above are true.
Unlock Deck
Unlock for access to all 270 flashcards in this deck.
Unlock Deck
k this deck
47
Use the figure below to answer the following question(s).
Figure 4-12
Refer to Figure 4-12. The supply curve S and the demand curve D1 indicate initial conditions in the market for college textbooks. A new government program is implemented that grants students a $30 per textbook subsidy on every textbook they purchase, shifting the demand curve from D1 to D2. Which of the following is true for this subsidy given the information provided in the exhibit?
A) Textbook buyers will receive an actual benefit of $10 from the subsidy, while textbook sellers will receive an actual benefit of $20 from the subsidy.
B) Textbook buyers will receive an actual benefit of $20 from the subsidy, while textbook sellers will receive an actual benefit of $10 from the subsidy.
C) Textbook buyers will receive the full $30 benefit from the subsidy.
D) Textbook sellers will receive the full $30 benefit from the subsidy.
Unlock Deck
Unlock for access to all 270 flashcards in this deck.
Unlock Deck
k this deck
48
Figure 4-14
Figure 4-14 depicts the milk market. The horizontal line, P, represents a price ceiling imposed by the government. Which of the following is true?
A) In equilibrium, the quantity demanded is 800 gallons.
B) At the ceiling price, there is a surplus.
C) The quantity demanded at the price ceiling will equal the quantity supplied.
D) The equilibrium price would be $1 per unit without the price ceiling.
E) The quantity sold will be 500 gallons.
Unlock Deck
Unlock for access to all 270 flashcards in this deck.
Unlock Deck
k this deck
49
Use the figure below to answer the following question(s).
Figure 4-10
Refer to Figure 4-11. On the Laffer curve shown, tax revenue could be increased by
A) decreasing the marginal tax rates if we were currently at point A.
B) decreasing the marginal tax rates if we were currently at point C.
C) increasing the marginal tax rates if we were currently at point B.
D) increasing the marginal tax rates if we were currently at point C.
Unlock Deck
Unlock for access to all 270 flashcards in this deck.
Unlock Deck
k this deck
50
Figure 4-18
Refer to Figure 4-18. If the government imposes a price ceiling of $2.00 in this market, the result is a
A) surplus of 30 units of the good.
B) shortage of 20 units of the good.
C) shortage of 30 units of the good.
D) shortage of 50 units of the good.
Refer to Figure 4-18. If the government imposes a price ceiling of $2.00 in this market, the result is a
A) surplus of 30 units of the good.
B) shortage of 20 units of the good.
C) shortage of 30 units of the good.
D) shortage of 50 units of the good.
Unlock Deck
Unlock for access to all 270 flashcards in this deck.
Unlock Deck
k this deck
51
Use the figure below to answer the following question(s).
Figure 4-12
Refer to Figure 4-12. The supply curve S and the demand curve D1 indicate initial conditions in the market for college textbooks. A new government program is implemented that grants students a $30 per textbook subsidy on every textbook they purchase, shifting the demand curve from D1 to D2. Which of the following is true for this subsidy given the information provided in the exhibit?
A) The original average selling price of textbooks was $100, and after the subsidy it rises to $120.
B) $90 represents the net price a buyer must pay for a textbook after taking into account the subsidy payment.
C) Textbook buyers will receive an actual benefit of $10 from the subsidy, while textbook sellers will receive an actual benefit of $20 from the subsidy.
D) All of the above are true.
Unlock Deck
Unlock for access to all 270 flashcards in this deck.
Unlock Deck
k this deck
52
Use the figure below to answer the following question(s).
Figure 4-10
Refer to Figure 4-11. On the Laffer curve shown, which of the following is true?
A) Tax revenue would increase if marginal tax rates were lowered from point C.
B) Tax revenue would decrease if marginal tax rates were lowered from point A.
C) Tax revenues are maximized at a tax rate corresponding to point B.
D) All of the above are true.
Unlock Deck
Unlock for access to all 270 flashcards in this deck.
Unlock Deck
k this deck
53
Figure 4-17
Refer to Figure 4-17. If the government imposes a price ceiling in this market at a price of $5.00, the result would be a
A) shortage of 20 units.
B) shortage of 10 units.
C) surplus of 20 units.
D) surplus of 10 units.
Refer to Figure 4-17. If the government imposes a price ceiling in this market at a price of $5.00, the result would be a
A) shortage of 20 units.
B) shortage of 10 units.
C) surplus of 20 units.
D) surplus of 10 units.
Unlock Deck
Unlock for access to all 270 flashcards in this deck.
Unlock Deck
k this deck
54
Figure 4-17
Refer to Figure 4-17. Suppose a price floor of $7.00 is imposed. As a result,
A) buyers' total expenditure on the good decreases by $20.00.
B) the supply curve will shift to the left so as to now pass through the point (Q = 40, P = $7.00).
C) the quantity of the good demanded decreases by 20 units.
D) the price of the good continues to serve as the rationing mechanism.
Unlock Deck
Unlock for access to all 270 flashcards in this deck.
Unlock Deck
k this deck
55
Figure 4-14
In Figure 4-14, which of the following is true at the price ceiling, P?
A) The excess quantity supplied equals 300 gallons.
B) The excess quantity demanded equals 300 gallons.
C) The excess quantity supplied equals 500 gallons.
D) The excess quantity demanded equals 800 gallons.
E) Sales will be equal to 800 gallons.
Unlock Deck
Unlock for access to all 270 flashcards in this deck.
Unlock Deck
k this deck
56
Figure 4-15
In Figure 4-15, suppose a price floor is established at $20.00. What is the result?
A) a shortage of 10 units
B) a surplus of 10 units
C) a shortage of 20 units
D) a surplus of 20 units
E) there is no change from the situation that exists at the equilibrium price
In Figure 4-15, suppose a price floor is established at $20.00. What is the result?
A) a shortage of 10 units
B) a surplus of 10 units
C) a shortage of 20 units
D) a surplus of 20 units
E) there is no change from the situation that exists at the equilibrium price
Unlock Deck
Unlock for access to all 270 flashcards in this deck.
Unlock Deck
k this deck
57
Figure 4-18
Refer to Figure 4-18. In this market, which of the following price controls would be binding?
A) a price ceiling of $2.00, and it would cause a shortage
B) a price ceiling of $5.00, and it would cause a surplus
C) a price floor of $2.00, and it would cause a shortage
D) All of the above are correct.
Unlock Deck
Unlock for access to all 270 flashcards in this deck.
Unlock Deck
k this deck
58
Use the figure below to answer the following question(s).
Figure 4-13
Refer to Figure 4-13. The exhibit illustrates the impact of granting a subsidy on a particular good. Which of the following is true for this subsidy given the information provided in the exhibit?
A) The subsidy has been statutorily (legally) paid to sellers.
B) The subsidy results in a decrease in the market selling price of the good.
C) Sellers will receive a larger proportion of the benefit from this subsidy than buyers.
D) The subsidy results in a reduction in the quantity purchased.
Unlock Deck
Unlock for access to all 270 flashcards in this deck.
Unlock Deck
k this deck
59
Use the figure below to answer the following question(s).
Figure 4-13
Refer to Figure 4-13. The supply curve S and the demand curve D1 indicate initial conditions in the market for flu shots. A new government program is implemented that grants buyers a $25 subsidy when they buy a flu shot, shifting the demand curve from D1 to D2. Which of the following is true for this subsidy given the information provided in the figure?
A) The original price of a flu shot was $75, and after the subsidy, it rises to $90.
B) $65 represents the net price a buyer must pay for a flu shot after taking into account the subsidy payment.
C) Buyers of flu shots will receive an actual benefit of $10 from the subsidy, while sellers of flu shots will receive an actual benefit of $15 from the subsidy.
D) All of the above are true.
Unlock Deck
Unlock for access to all 270 flashcards in this deck.
Unlock Deck
k this deck
60
Use the figure below to answer the following question(s).
Figure 4-10
Refer to Figure 4-10. The accompanying graph shows the market for a good before and after an excise tax is imposed. The total tax revenue generated is indicated by
A) area A + area B + area D.
B) area A + area B + area C.
C) area A + area B.
D) area D only.
Figure 4-10
Refer to Figure 4-10. The accompanying graph shows the market for a good before and after an excise tax is imposed. The total tax revenue generated is indicated by
A) area A + area B + area D.
B) area A + area B + area C.
C) area A + area B.
D) area D only.
Unlock Deck
Unlock for access to all 270 flashcards in this deck.
Unlock Deck
k this deck
61
Figure 4-21
Refer to Figure 4-21. The price received by sellers after the tax is imposed is
A) $18.
B) $14.
C) $12.
D) $8.
Refer to Figure 4-21. The price received by sellers after the tax is imposed is
A) $18.
B) $14.
C) $12.
D) $8.
Unlock Deck
Unlock for access to all 270 flashcards in this deck.
Unlock Deck
k this deck
62
Figure 4-20
Refer to Figure 4-20. As the figure is drawn, who sends the tax payments to the government?
A) the buyers
B) the sellers
C) A portion of the tax payments is sent by the buyers and the remaining portion is sent by the sellers.
D) The question of who sends the tax payments cannot be determined from the figure.
Unlock Deck
Unlock for access to all 270 flashcards in this deck.
Unlock Deck
k this deck
63
Figure 4-20
Refer to Figure 4-20. The price that sellers receive after the tax is imposed is
A) $8.
B) $6.
C) $5.
D) $3.
Refer to Figure 4-20. The price that sellers receive after the tax is imposed is
A) $8.
B) $6.
C) $5.
D) $3.
Unlock Deck
Unlock for access to all 270 flashcards in this deck.
Unlock Deck
k this deck
64
Figure 4-20
Refer to Figure 4-20. The price that buyers pay after the tax is imposed is
A) $8.
B) $6.
C) $5.
D) $3.
Refer to Figure 4-20. The price that buyers pay after the tax is imposed is
A) $8.
B) $6.
C) $5.
D) $3.
Unlock Deck
Unlock for access to all 270 flashcards in this deck.
Unlock Deck
k this deck
65
Figure 4-20
Refer to Figure 4-20. The burden of the tax on buyers is
A) $1.00 per unit.
B) $1.50 per unit.
C) $2.00 per unit.
D) $3.00 per unit.
Refer to Figure 4-20. The burden of the tax on buyers is
A) $1.00 per unit.
B) $1.50 per unit.
C) $2.00 per unit.
D) $3.00 per unit.
Unlock Deck
Unlock for access to all 270 flashcards in this deck.
Unlock Deck
k this deck
66
Figure 4-20
Refer to Figure 4-20. The equilibrium price in the market before the tax is imposed is
A) $8.
B) $6.
C) $5.
D) $3.
Refer to Figure 4-20. The equilibrium price in the market before the tax is imposed is
A) $8.
B) $6.
C) $5.
D) $3.
Unlock Deck
Unlock for access to all 270 flashcards in this deck.
Unlock Deck
k this deck
67
Figure 4-21
Refer to Figure 4-21. The per-unit burden of the tax is
A) $4 on buyers and $4 on sellers.
B) $5 on buyers and $5 on sellers.
C) $4 on buyers and $6 on sellers.
D) $6 on buyers and $4 on sellers.
Refer to Figure 4-21. The per-unit burden of the tax is
A) $4 on buyers and $4 on sellers.
B) $5 on buyers and $5 on sellers.
C) $4 on buyers and $6 on sellers.
D) $6 on buyers and $4 on sellers.
Unlock Deck
Unlock for access to all 270 flashcards in this deck.
Unlock Deck
k this deck
68
Figure 4-19
Refer to Figure 4-19. When the price ceiling applies in this market and the supply curve for gasoline shifts from S1 to S2, the resulting quantity of gasoline that is bought and sold is
A) less than Q3.
B) Q3
C) between Q1 and Q3.
D) at least Q1.
Refer to Figure 4-19. When the price ceiling applies in this market and the supply curve for gasoline shifts from S1 to S2, the resulting quantity of gasoline that is bought and sold is
A) less than Q3.
B) Q3
C) between Q1 and Q3.
D) at least Q1.
Unlock Deck
Unlock for access to all 270 flashcards in this deck.
Unlock Deck
k this deck
69
Figure 4-18
Refer to Figure 4-18. The price of the good would continue to serve as the rationing mechanism if
A) a price ceiling of $4.00 were imposed.
B) a price ceiling of $5.00 were imposed.
C) a price floor of $3.00 were imposed.
D) All of the above are correct.
Refer to Figure 4-18. The price of the good would continue to serve as the rationing mechanism if
A) a price ceiling of $4.00 were imposed.
B) a price ceiling of $5.00 were imposed.
C) a price floor of $3.00 were imposed.
D) All of the above are correct.
Unlock Deck
Unlock for access to all 270 flashcards in this deck.
Unlock Deck
k this deck
70
Figure 4-20
Refer to Figure 4-20. Suppose the same S and D curves apply, and a tax of the same amount per unit as shown here is imposed. Now, however, the sellers of the good, rather than the buyers, are required to pay the tax to the government. Now, relative to the case depicted in the figure,
A) the burden on buyers will be larger and the burden on sellers will be smaller.
B) the burden on buyers will be smaller and the burden on sellers will be larger.
C) the burden on buyers will be the same and the burden on sellers will be the same.
D) The relative burdens in the two cases cannot be determined without further information.
Unlock Deck
Unlock for access to all 270 flashcards in this deck.
Unlock Deck
k this deck
71
Figure 4-21
Refer to Figure 4-21. The price paid by buyers after the tax is imposed is
A) $18.
B) $14.
C) $12.
D) $8.
Refer to Figure 4-21. The price paid by buyers after the tax is imposed is
A) $18.
B) $14.
C) $12.
D) $8.
Unlock Deck
Unlock for access to all 270 flashcards in this deck.
Unlock Deck
k this deck
72
Figure 4-22
Refer to Figure 4-22. The equilibrium price in the market before the tax is imposed is
A) $1.00.
B) $3.50.
C) $5.00.
D) $6.00.
Refer to Figure 4-22. The equilibrium price in the market before the tax is imposed is
A) $1.00.
B) $3.50.
C) $5.00.
D) $6.00.
Unlock Deck
Unlock for access to all 270 flashcards in this deck.
Unlock Deck
k this deck
73
Figure 4-20
Refer to Figure 4-20. The amount of the tax per unit is
A) $1.
B) $2.
C) $3.
D) $5.
Refer to Figure 4-20. The amount of the tax per unit is
A) $1.
B) $2.
C) $3.
D) $5.
Unlock Deck
Unlock for access to all 270 flashcards in this deck.
Unlock Deck
k this deck
74
Figure 4-20
Refer to Figure 4-20. The burden of the tax on sellers is
A) $1.00 per unit.
B) $1.50 per unit.
C) $2.00 per unit.
D) $3.00 per unit.
Refer to Figure 4-20. The burden of the tax on sellers is
A) $1.00 per unit.
B) $1.50 per unit.
C) $2.00 per unit.
D) $3.00 per unit.
Unlock Deck
Unlock for access to all 270 flashcards in this deck.
Unlock Deck
k this deck
75
Figure 4-21
Refer to Figure 4-21. The amount of the tax per unit is
A) $10.
B) $6.
C) $4.
D) $2.
Refer to Figure 4-21. The amount of the tax per unit is
A) $10.
B) $6.
C) $4.
D) $2.
Unlock Deck
Unlock for access to all 270 flashcards in this deck.
Unlock Deck
k this deck
76
Figure 4-22
Refer to Figure 4-22. The effective price sellers receive after the tax is imposed is
A) $1.00.
B) $3.50.
C) $5.00.
D) $6.00.
Refer to Figure 4-22. The effective price sellers receive after the tax is imposed is
A) $1.00.
B) $3.50.
C) $5.00.
D) $6.00.
Unlock Deck
Unlock for access to all 270 flashcards in this deck.
Unlock Deck
k this deck
77
Figure 4-21
Refer to Figure 4-21. How much tax revenue does this tax produce for the government?
A) $480
B) $600
C) $800
D) $1,080
Refer to Figure 4-21. How much tax revenue does this tax produce for the government?
A) $480
B) $600
C) $800
D) $1,080
Unlock Deck
Unlock for access to all 270 flashcards in this deck.
Unlock Deck
k this deck
78
Figure 4-19
Refer to Figure 4-19. When the price ceiling applies in this market and the supply curve for gasoline shifts from S1 to S2,
A) the price will increase to P3.
B) a surplus will occur at the new market price of P2.
C) the market price will stay at P1 due to the price ceiling.
D) a shortage will occur at the price ceiling of P2.
Unlock Deck
Unlock for access to all 270 flashcards in this deck.
Unlock Deck
k this deck
79
Figure 4-22
Refer to Figure 4-22. The amount of the tax per unit is
A) $1.00.
B) $1.50.
C) $2.50.
D) $3.50.
Refer to Figure 4-22. The amount of the tax per unit is
A) $1.00.
B) $1.50.
C) $2.50.
D) $3.50.
Unlock Deck
Unlock for access to all 270 flashcards in this deck.
Unlock Deck
k this deck
80
Figure 4-22
Refer to Figure 4-22. The price paid by buyers after the tax is imposed is
A) $1.00.
B) $3.50.
C) $5.00.
D) $6.00.
Refer to Figure 4-22. The price paid by buyers after the tax is imposed is
A) $1.00.
B) $3.50.
C) $5.00.
D) $6.00.
Unlock Deck
Unlock for access to all 270 flashcards in this deck.
Unlock Deck
k this deck
Unlock Deck
Unlock for access to all 270 flashcards in this deck.


