Deck 24: Quantitative Genetics
Full screen (f)
Question
Question
Question
Question
Question
Question
Question
Question
Question
Question
Question
Question
Question
Question
Question
Question
Question
Question
Question
Question
Question
Question
Question
Question
Question
Question
Question
Question
Question
Question
Question
Question
Question
Distributions A and B in the figure below have: 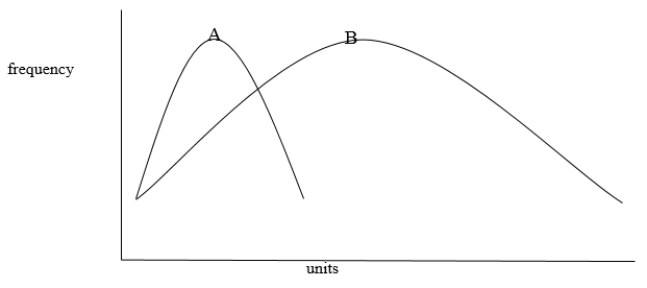
A) the same mean and the same variance.
B) different means and different variances.
C) the same mean but different variances.
D) different means but the same variance.
E) different means but are correlated.
A) the same mean and the same variance.
B) different means and different variances.
C) the same mean but different variances.
D) different means but the same variance.
E) different means but are correlated.
Question
Question
Question
Question
Question
Question
Question
Question
Question
Question
Question
The graph below shows how yield in two varieties of corn respond to different environmental conditions. 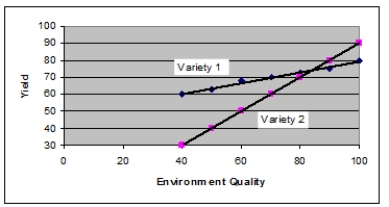 Which of the following statements is TRUE?
A) Under tested conditions, variety 1 has a higher yield than variety 2.
B) Under tested conditions, variety 2 has a higher yield than variety 1.
C) Under tested conditions, variety 2 is more sensitive to environment quality than variety 1.
D) Variety 1 is genetically superior to variety 2.
E) Variety 2 is genetically superior to variety 1.
Which of the following statements is TRUE?A) Under tested conditions, variety 1 has a higher yield than variety 2.
B) Under tested conditions, variety 2 has a higher yield than variety 1.
C) Under tested conditions, variety 2 is more sensitive to environment quality than variety 1.
D) Variety 1 is genetically superior to variety 2.
E) Variety 2 is genetically superior to variety 1.
Question
Question
Question
Question
Question
Question
Question
Question
Question
Question
Question
Question
Question
Question
The height and weight for three dogs are shown below. 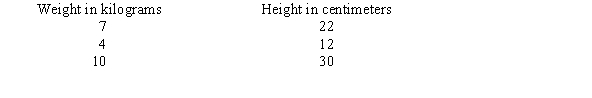 a. Use the data to fill in the blanks in the following table. Round each to the nearest whole number and include the correct units.
 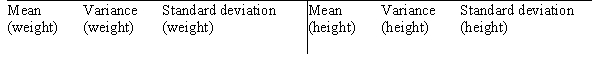 b. Fill in the blanks for the following table.
 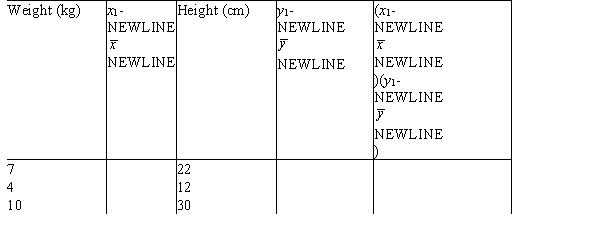 c. For the data in the previous question, what are the values for covariance and correlation coefficient?
a. Use the data to fill in the blanks in the following table. Round each to the nearest whole number and include the correct units. b. Fill in the blanks for the following table. c. For the data in the previous question, what are the values for covariance and correlation coefficient? Question
Question
Question
Question
Question
Question
Question
Question
Question
Question
Question
Question
Question
A study was conducted to investigate the levels of calcium and growth hormone excreted in chicken dung on a major chicken farm. The variances (V) were calculated and are shown below.  a. Calculate the narrow-sense heritability for both traits (calcium and growth hormone levels).
b. Which trait, if any, will more likely respond to artificial selection?
a. Calculate the narrow-sense heritability for both traits (calcium and growth hormone levels).b. Which trait, if any, will more likely respond to artificial selection?
Question
A plant breeder has determined the following variances for yield of corn in his fields:  Assume that there is no genetic-environmental interaction or other variances.
a. Calculate the total genetic variance.
b. Calculate the broad-sense heritability indicated by the data.
c. Calculate the narrow-sense heritability indicated by the data.
d. The breeder wishes to improve yield. If the average yield in the starting population is 400 and the breeder selects for breeding plants with an average yield of 500, what will be the expected average yield among the offspring of the selected plants?
Assume that there is no genetic-environmental interaction or other variances.a. Calculate the total genetic variance.
b. Calculate the broad-sense heritability indicated by the data.
c. Calculate the narrow-sense heritability indicated by the data.
d. The breeder wishes to improve yield. If the average yield in the starting population is 400 and the breeder selects for breeding plants with an average yield of 500, what will be the expected average yield among the offspring of the selected plants?
Question
Question
The table below shows narrow-sense heritability estimates for body weight and egg production in chickens. 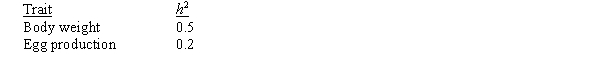 a. Which chicken trait would respond best to selection? Explain your answer.
b. Explain the expected gain if high-egg-producing chickens are selectively bred.
c. Explain how and why the h2 would change over generations of selective breeding for high egg production.
a. Which chicken trait would respond best to selection? Explain your answer.b. Explain the expected gain if high-egg-producing chickens are selectively bred.
c. Explain how and why the h2 would change over generations of selective breeding for high egg production.
Question
Question
Question
Question
Question
Question

Unlock Deck
Sign up to unlock the cards in this deck!
Unlock Deck
Unlock Deck
1/81
Play
Full screen (f)
Deck 24: Quantitative Genetics
1
Use the following to answer questions
The height of a type of bean plant is determined by five unlinked genes called A, B, C, D, and E. Each gene has two alleles: additive (uppercase letter) and nonadditive (lowercase letter). The shortest plants are 130 cm. The tallest plants are 220 cm. The genotypes are known for two bean plants. Plant 1 is genotype AABbccDdEE. Plant 2 is genotype aaBBCcDdEE.
Estimate how many centimeters each allele contributes to the height difference of 90 cm.
A) 8 cm
B) 9 cm
C) 11.25 cm
D) 22.5 cm
E) 55 cm
B
2
Use the following to answer questions
The height of a type of bean plant is determined by five unlinked genes called A, B, C, D, and E. Each gene has two alleles: additive (uppercase letter) and nonadditive (lowercase letter). The shortest plants are 130 cm. The tallest plants are 220 cm. The genotypes are known for two bean plants. Plant 1 is genotype AABbccDdEE. Plant 2 is genotype aaBBCcDdEE.
What are their heights?
A) 9 cm
B) 54 cm
C) 130 cm
D) 184 cm
E) 202 cm
D
3
Flower diameter in sunflowers is a quantitative trait. A plant with 6-cm flowers, from a highly inbred strain, is crossed to a plant with 30-cm flowers, also from a highly inbred strain. The F1 have 18-cm flowers. F1 × F1 crosses yield F2 plants with flowers ranging from 6 to 30 cm in diameter, in approximately 4-cm intervals (6, 10, 14, 18, 22, 26, 30). An 18-cm F1 plant is crossed to a 6-cm plant. What is the probability of an offspring with one additive allele, if all genes that influence this trait are unlinked?
A) 1/3
B) 1/4
C) 1/6
D) 3/8
E) 1/16
A) 1/3
B) 1/4
C) 1/6
D) 3/8
E) 1/16
D
4
Use the following to answer questions
The height of a type of bean plant is determined by five unlinked genes called A, B, C, D, and E. Each gene has two alleles: additive (uppercase letter) and nonadditive (lowercase letter). The shortest plants are 130 cm. The tallest plants are 220 cm. The genotypes are known for two bean plants. Plant 1 is genotype AABbccDdEE. Plant 2 is genotype aaBBCcDdEE.
All the genes are unlinked. Determine the probability of an AbcdE gamete from plant 1(AABbccDdEE) and an aBcdE gamete from plant 2 (aaBBCcDdEE).
A) 1/2 chance from plant 1; 1/2 chance from plant 2
B) 1/4 chance from plant 1; 1/4 chance from plant 2
C) 1/2 chance from plant 1; 1/4 chance from plant 2
D) 1/4 chance from plant 1; 1/2 chance from plant 2
E) 1/4 chance from plant 1; 3/4 chance from plant 2
Unlock Deck
Unlock for access to all 81 flashcards in this deck.
Unlock Deck
k this deck
5
Do the principles discovered by Mendel for discontinuous traits also apply to the inheritance of traits that exhibit continuous variation? Why or why not?
A) Yes. The environmental factors that control continuous traits also control discontinuous traits according to Mendel's principles.
B) Yes. Quantitative characteristics can be explained by additive effects of multiple genes, but the behavior of each gene can be determined by Mendel's principles.
C) No. Continuous traits are controlled by both genes and the environment and, therefore, Mendel's principles would not apply.
D) No. Discontinuous traits are the result of multiple genes that have additive effects and the behavior of continuous traits as defined by Mendel is the result of just a few loci.
E) No. Mendel's principles of inheritance cannot be applied to quantitative traits because they do not involve dominance relationships.
Unlock Deck
Unlock for access to all 81 flashcards in this deck.
Unlock Deck
k this deck
6
Is it possible for a trait to be discontinuous and yet determined by multiple genetic and environmental factors? Explain.
Unlock Deck
Unlock for access to all 81 flashcards in this deck.
Unlock Deck
k this deck
7
A series of experiments shows that oil content in a diploid grain is influenced by five genes (a through e) with additive alleles. The highest-producing strain has 20% oil content; the lowest has close to 0%. A plant of unknown genotype has an oil content of 12%. What is a possible genotype for this plant (+ = additive alleles)?
A) a+a+b+b+c+c+d+de+e
B) a+a+b+b+ ccddee
C) a+a+b+bccddee
D) aab+bc+cd+d+e+e+
E) a+a+b+b+c+c+d+dee
A) a+a+b+b+c+c+d+de+e
B) a+a+b+b+ ccddee
C) a+a+b+bccddee
D) aab+bc+cd+d+e+e+
E) a+a+b+b+c+c+d+dee
Unlock Deck
Unlock for access to all 81 flashcards in this deck.
Unlock Deck
k this deck
8
Use the following to answer questions
The height of a type of bean plant is determined by five unlinked genes called A, B, C, D, and E. Each gene has two alleles: additive (uppercase letter) and nonadditive (lowercase letter). The shortest plants are 130 cm. The tallest plants are 220 cm. The genotypes are known for two bean plants. Plant 1 is genotype AABbccDdEE. Plant 2 is genotype aaBBCcDdEE.
What will be the genotype and phenotype of a plant from an AbcdE gamete from plant 1(AABbccDdEE) and an aBcdE gamete from plant 2 (aaBBCcDdEE), and what is the probability of a plant with this genotype?
A) There is a 1/4 chance of an AaBbccddEE genotype, and it will be 166 cm in height.
B) There is a 1/2 chance of an AaBbccddEE genotype, and it will be 148 cm in height.
C) There is a 1/16 chance of an AaBbccddEE genotype, and it will be 148 cm in height.
D) There is a 1/2 chance of an AaBbccddEE genotype, and it will be 115 cm in height.
E) There is a 1/16 chance of an AaBbccddEE genotype, and it will be 166 cm in height.
Unlock Deck
Unlock for access to all 81 flashcards in this deck.
Unlock Deck
k this deck
9
Use the following to answer questions
The height of a type of bean plant is determined by five unlinked genes called A, B, C, D, and E. Each gene has two alleles: additive (uppercase letter) and nonadditive (lowercase letter). The shortest plants are 130 cm. The tallest plants are 220 cm. The genotypes are known for two bean plants. Plant 1 is genotype AABbccDdEE. Plant 2 is genotype aaBBCcDdEE.
If the progeny plant from an AbcdE gamete from plant 1(AABbccDdEE) and an aBcdE gamete from plant 2 (aaBBCcDdEE) was a few centimeters taller than your prediction, how would you explain it?
A) Crossing over occurred within the A-E region that created recombination in the progeny.
B) The height trait is likely also influenced by environmental conditions as well.
C) The genes A-E do not actually work in an additive manner but rather in a dominant mode of inheritance.
D) Multiple alleles must be present in at least two of the loci involved.
E) There are actually more loci involved than just genes A-E.
Unlock Deck
Unlock for access to all 81 flashcards in this deck.
Unlock Deck
k this deck
10
Unlike most examples of this trait, the height characteristic that Mendel studied in pea plants exhibited _____ variation.
A) continuous
B) discontinuous
C) meristic
D) threshold
E) quantitative
A) continuous
B) discontinuous
C) meristic
D) threshold
E) quantitative
Unlock Deck
Unlock for access to all 81 flashcards in this deck.
Unlock Deck
k this deck
11
Do the principles discovered by Mendel for discontinuous traits also apply to the inheritance of traits that exhibit continuous variation? Explain your answer.
Unlock Deck
Unlock for access to all 81 flashcards in this deck.
Unlock Deck
k this deck
12
Cleft palate is a birth defect in which the two sides of the roof of the mouth do not fuse before birth. Cleft palate is considered to be a threshold trait. Define "threshold trait" and explain how cleft palate is an example of one.
Unlock Deck
Unlock for access to all 81 flashcards in this deck.
Unlock Deck
k this deck
13
Flower diameter in sunflowers is a quantitative trait. A plant with 6-cm flowers, from a highly inbred strain, is crossed to a plant with 30-cm flowers, also from a highly inbred strain. The F1 have 18-cm flowers. F1 × F1 crosses yield F2 plants with flowers ranging from 6 to 30 cm in diameter, in approximately 4-cm intervals (6, 10, 14, 18, 22, 26, 30). The number of different genes influencing flower diameter in this plant is:
A) three.
B) four.
C) five.
D) six.
E) seven.
A) three.
B) four.
C) five.
D) six.
E) seven.
Unlock Deck
Unlock for access to all 81 flashcards in this deck.
Unlock Deck
k this deck
14
Suppose a new species of shark is discovered, and the dorsal fin length is found to be determined by additive alleles at three independently assorting loci (A and a, B and b, C and c). The dorsal fin length of aabbcc sharks is 12 cm and the dorsal fin length of AABBCC sharks is 30 cm. Assuming that the alleles contribute equally, which of the following genotypes would represent a shark with a dorsal fin length of 18 cm?
A) aaBbcc
B) AAbbcc
C) AaBbCc
D) AABBcc
E) AaBbcc
A) aaBbcc
B) AAbbcc
C) AaBbCc
D) AABBcc
E) AaBbcc
Unlock Deck
Unlock for access to all 81 flashcards in this deck.
Unlock Deck
k this deck
15
A QTL:
A) is one of the genes that influences a trait
B) is a chromosomal region containing genes that influence a quantitative trait
C) will not contain any genes other than the ones influencing a trait
D) is a measure of the phenotypic variation in a quantitative trait
E) is a measure of the genetic variation in a quantitative trait
Unlock Deck
Unlock for access to all 81 flashcards in this deck.
Unlock Deck
k this deck
16
Two highly inbred tobacco plants are crossed. One has dark green leaves. The other has yellow leaves. The F1 have light green leaves. Five hundred progeny from F1 × F1 crosses are analyzed. Their leaves show continuous variation in color, but none has dark green or yellow leaves. What do these data suggest about the number of genes determining this trait?
A) There are two genes that determine this trait.
B) There are three genes that determine this trait.
C) There are four genes that determine this trait.
D) There are more than four genes that determine this trait.
E) There is not enough information to estimate the number of genes.
A) There are two genes that determine this trait.
B) There are three genes that determine this trait.
C) There are four genes that determine this trait.
D) There are more than four genes that determine this trait.
E) There is not enough information to estimate the number of genes.
Unlock Deck
Unlock for access to all 81 flashcards in this deck.
Unlock Deck
k this deck
17
Use the following to answer questions
The height of a type of bean plant is determined by five unlinked genes called A, B, C, D, and E. Each gene has two alleles: additive (uppercase letter) and nonadditive (lowercase letter). The shortest plants are 130 cm. The tallest plants are 220 cm. The genotypes are known for two bean plants. Plant 1 is genotype AABbccDdEE. Plant 2 is genotype aaBBCcDdEE.
a. Estimate how many centimeters each allele contributes to the height difference of 90 cm.
b. The genotypes are known for two bean plants. Plant 1 is genotype AABbccDdEE. Plant 2 is genotype aaBBCcDdEE. What are their heights?
c. If the two plants in the previous question are crossed, could they produce a plant that is taller than either parent? How?
d. All the genes are unlinked. Determine the probability of an AbcdE gamete from plant 1 and an aBcdE gamete from plant 2.
e. What will be the genotype and phenotype of a plant from these gametes, and what is the probability of a plant with this genotype?
f. If the progeny plant from the cross in the previous question was only 60 cm because of an allele in a gene other than A-E, what genetic phenomena are at work?
g. If the progeny plant with the genotype in part (d) was a few centimeters taller than your prediction, how would you explain it?
Unlock Deck
Unlock for access to all 81 flashcards in this deck.
Unlock Deck
k this deck
18
Use the following to answer questions
The height of a type of bean plant is determined by five unlinked genes called A, B, C, D, and E. Each gene has two alleles: additive (uppercase letter) and nonadditive (lowercase letter). The shortest plants are 130 cm. The tallest plants are 220 cm. The genotypes are known for two bean plants. Plant 1 is genotype AABbccDdEE. Plant 2 is genotype aaBBCcDdEE.
If these two plants are crossed, could they produce a plant that is taller than either parent? How?
A) No. Even if the progeny plants had seven additive alleles, it is not possible for it to be taller than either of the parents.
B) No. Environmental factors would prevent the offspring of the cross from inheriting additional additive alleles.
C) Yes. It is possible for these plants to produce a plant that has seven or eight additive alleles, making it taller than either parent.
D) Yes. It is possible for the progeny plants to be taller than either parent, but only if a nondisjunction event occurred in either of the parents when making gametes.
E) No. Because the parent plants are homozygous for most of the genes, they will be taller than any progeny plants they produce.
Unlock Deck
Unlock for access to all 81 flashcards in this deck.
Unlock Deck
k this deck
19
_____ can cause a single genotype to produce a range of potential phenotypes.
A) Epistasis
B) Genetic variance
C) Threshold effects
D) Environmental effects
E) Heritability
A) Epistasis
B) Genetic variance
C) Threshold effects
D) Environmental effects
E) Heritability
Unlock Deck
Unlock for access to all 81 flashcards in this deck.
Unlock Deck
k this deck
20
Use the following to answer questions
The height of a type of bean plant is determined by five unlinked genes called A, B, C, D, and E. Each gene has two alleles: additive (uppercase letter) and nonadditive (lowercase letter). The shortest plants are 130 cm. The tallest plants are 220 cm. The genotypes are known for two bean plants. Plant 1 is genotype AABbccDdEE. Plant 2 is genotype aaBBCcDdEE.
If the progeny plant resulting from an AbcdE gamete from plant 1(AABbccDdEE) and an aBcdE gamete from plant 2 (aaBBCcDdEE) was only 60 cm because of an allele in a gene other than A-E, what genetic phenomenon is at work?
A) A mutation occurred that is epistatic to the height genes because, no matter what genotype the plant has for the genes A-E, the phenotype is still 60 cm.
B) Crossing over occurred within the A-E region that created recombination in the progeny.
C) There must have been a change in the environment, such as low water, that caused the stunted growth in the plant.
D) The genes A-E do not actually work in an additive manner but rather in a dominant mode of inheritance.
E) Multiple alleles must be present in at least two of the loci involved.
Unlock Deck
Unlock for access to all 81 flashcards in this deck.
Unlock Deck
k this deck
21
Use the following to answer questions
The height and weight for three dogs are shown below.
-What is the value of the covariance?
A) 0
B) 1
C) 3
D) 9
E) 27
The height and weight for three dogs are shown below.
-What is the value of the covariance?
A) 0
B) 1
C) 3
D) 9
E) 27
Unlock Deck
Unlock for access to all 81 flashcards in this deck.
Unlock Deck
k this deck
22
In a normal distribution, 99% of the measurements fall within:
A) 1% of the mean.
B) 5% of the mean.
C) plus or minus one standard deviation of the mean.
D) plus or minus two standard deviations of the mean.
E) plus or minus three standard deviations of the mean.
A) 1% of the mean.
B) 5% of the mean.
C) plus or minus one standard deviation of the mean.
D) plus or minus two standard deviations of the mean.
E) plus or minus three standard deviations of the mean.
Unlock Deck
Unlock for access to all 81 flashcards in this deck.
Unlock Deck
k this deck
23
A _____ allows us to predict the value of one variable from the value of a correlated variable.
A) regression
B) covariance
C) correlation
D) variance
E) standard deviation
A) regression
B) covariance
C) correlation
D) variance
E) standard deviation
Unlock Deck
Unlock for access to all 81 flashcards in this deck.
Unlock Deck
k this deck
24
Use the following to answer questions
The height and weight for three dogs are shown below.
-What is the mean of the weight? Round to the nearest whole number.
A) 7
B) 12
C) 21
D) 22
E) 80
The height and weight for three dogs are shown below.
-What is the mean of the weight? Round to the nearest whole number.
A) 7
B) 12
C) 21
D) 22
E) 80
Unlock Deck
Unlock for access to all 81 flashcards in this deck.
Unlock Deck
k this deck
25
Quantitative characters often exhibit a _____ distribution.
A) skewed
B) normal
C) bimodal
D) covariance
E) tangential
A) skewed
B) normal
C) bimodal
D) covariance
E) tangential
Unlock Deck
Unlock for access to all 81 flashcards in this deck.
Unlock Deck
k this deck
26
Use the following to answer questions
The height and weight for three dogs are shown below.
-What is the mean of the height? Round to the nearest whole number.
A) 7
B) 12
C) 21
D) 22
E) 80
The height and weight for three dogs are shown below.
-What is the mean of the height? Round to the nearest whole number.
A) 7
B) 12
C) 21
D) 22
E) 80
Unlock Deck
Unlock for access to all 81 flashcards in this deck.
Unlock Deck
k this deck
27
Use the following to answer questions
The height and weight for three dogs are shown below.
-What is the standard deviation of the weight? Round to the nearest whole number.
A) 3
B) 9
C) 21
D) 42
E) 81
The height and weight for three dogs are shown below.
-What is the standard deviation of the weight? Round to the nearest whole number.
A) 3
B) 9
C) 21
D) 42
E) 81
Unlock Deck
Unlock for access to all 81 flashcards in this deck.
Unlock Deck
k this deck
28
Use the following to answer questions
The height and weight for three dogs are shown below.
-What is the variance of the height? Round to the nearest whole number.
A) 7
B) 9
C) 21
D) 22
E) 81
The height and weight for three dogs are shown below.
-What is the variance of the height? Round to the nearest whole number.
A) 7
B) 9
C) 21
D) 22
E) 81
Unlock Deck
Unlock for access to all 81 flashcards in this deck.
Unlock Deck
k this deck
29
In a group of 10 black bears, the length of the longest claw was measured in each bear. These lengths are listed below in cm. What is the mean of these lengths? 2.8, 3.1, 3.8, 3.2, 3.3, 2.9, 3.2, 3.1, 3.5, 3.0
A) 3.19
B) 3.08
C) 3.11
D) 3.30
E) 3.16
A) 3.19
B) 3.08
C) 3.11
D) 3.30
E) 3.16
Unlock Deck
Unlock for access to all 81 flashcards in this deck.
Unlock Deck
k this deck
30
_____ is measured in terms of the original units squared.
A) Mean
B) Standard deviation
C) Variance
D) Correlation coefficient
E) Narrow-sense heritability
A) Mean
B) Standard deviation
C) Variance
D) Correlation coefficient
E) Narrow-sense heritability
Unlock Deck
Unlock for access to all 81 flashcards in this deck.
Unlock Deck
k this deck
31
Astronomers are able to measure precisely the distance between Earth and Margalit's comet on its approach toward the Sun. During the same time period, the price of oil increases. You measure the correlation coefficient between the price of oil and the distance between Earth and the comet and discover that the correlation coefficient is equal to -1. How would you interpret this correlation?
Unlock Deck
Unlock for access to all 81 flashcards in this deck.
Unlock Deck
k this deck
32
Use the following to answer questions
The height and weight for three dogs are shown below.
-What is the standard deviation of the height? Round to the nearest whole number.
A) 3
B) 9
C) 21
D) 42
E) 81
The height and weight for three dogs are shown below.
-What is the standard deviation of the height? Round to the nearest whole number.
A) 3
B) 9
C) 21
D) 42
E) 81
Unlock Deck
Unlock for access to all 81 flashcards in this deck.
Unlock Deck
k this deck
33
Distributions A and B in the figure below have:
A) the same mean and the same variance.
B) different means and different variances.
C) the same mean but different variances.
D) different means but the same variance.
E) different means but are correlated.
A) the same mean and the same variance.
B) different means and different variances.
C) the same mean but different variances.
D) different means but the same variance.
E) different means but are correlated.
Unlock Deck
Unlock for access to all 81 flashcards in this deck.
Unlock Deck
k this deck
34
Use the following to answer questions
The height and weight for three dogs are shown below.
-What is the value of the correlation coefficient?
A) 0
B) 1
C) 3
D) 9
E) 27
The height and weight for three dogs are shown below.
-What is the value of the correlation coefficient?
A) 0
B) 1
C) 3
D) 9
E) 27
Unlock Deck
Unlock for access to all 81 flashcards in this deck.
Unlock Deck
k this deck
35
The _____ is the statistic that measures the spread of a distribution around the mean.
A) covariance
B) correlation coefficient
C) regression coefficient
D) variance
E) average
A) covariance
B) correlation coefficient
C) regression coefficient
D) variance
E) average
Unlock Deck
Unlock for access to all 81 flashcards in this deck.
Unlock Deck
k this deck
36
Use the following to answer questions
The height and weight for three dogs are shown below.
-What is the variance of the weight? Round to the nearest whole number.
A) 7
B) 9
C) 21
D) 22
E) 81
The height and weight for three dogs are shown below.
-What is the variance of the weight? Round to the nearest whole number.
A) 7
B) 9
C) 21
D) 22
E) 81
Unlock Deck
Unlock for access to all 81 flashcards in this deck.
Unlock Deck
k this deck
37
Since the entire population is too large to work with, a sample is often used to characterize the population. This sample should:
A) be at most 5% of the population size to minimize the computational efforts.
B) be randomly selected so that it represents the entire population.
C) include individuals that are selected to fully represent the extreme values in the distribution.
D) be small enough to mitigate against chance events skewing the distribution of the sample.
Unlock Deck
Unlock for access to all 81 flashcards in this deck.
Unlock Deck
k this deck
38
In a group of 10 black bears, the length of the longest claw was measured in each bear. These lengths are listed below in cm. What is the variance of these lengths? 2.8, 3.1, 3.8, 3.2, 3.3, 2.9, 3.2, 3.1, 3.5, 3.0
A) 3.19
B) 3.08
C) 3.11
D) 3.30
E) 3.16
A) 3.19
B) 3.08
C) 3.11
D) 3.30
E) 3.16
Unlock Deck
Unlock for access to all 81 flashcards in this deck.
Unlock Deck
k this deck
39
Phenotypic variation in a trait is often represented as a _____, which graphs the number of each phenotypic class in a sample.
A) bimodal distribution
B) frequency distribution
C) regression line
D) correlation
E) variance plot
A) bimodal distribution
B) frequency distribution
C) regression line
D) correlation
E) variance plot
Unlock Deck
Unlock for access to all 81 flashcards in this deck.
Unlock Deck
k this deck
40
_____ is a way to measure the strength of the association between two variables.
A) Regression
B) Covariance
C) Correlation
D) Variance
E) Standard deviation
A) Regression
B) Covariance
C) Correlation
D) Variance
E) Standard deviation
Unlock Deck
Unlock for access to all 81 flashcards in this deck.
Unlock Deck
k this deck
41
Suppose that researchers estimate that broad-sense heritability of IQ in Sweden is 0.8. Which of the following conclusions is valid, assuming that the estimate is accurate?
A) Most variance for IQ in Sweden is due to total genetic variance.
B) In Sweden, the environment does not play a large role in determining the IQ of individuals.
C) Enriching the environment of poor children in Sweden would not lead to a big improvement on IQ tests.
D) Broad-sense heritability of IQ in the United States is probably also close to 0.8.
E) If another country has a lower broad-sense heritability for IQ, then this difference must be genetically based.
Unlock Deck
Unlock for access to all 81 flashcards in this deck.
Unlock Deck
k this deck
42
Total phenotypic variance CANNOT be broken down into which component?
A) genetic-environmental interaction variance
B) genetic variance
C) environmental variance
D) heritability
E) genic interaction variance
A) genetic-environmental interaction variance
B) genetic variance
C) environmental variance
D) heritability
E) genic interaction variance
Unlock Deck
Unlock for access to all 81 flashcards in this deck.
Unlock Deck
k this deck
43
Which model BEST explains inheritance of complex traits such as height, weight, and IQ?
A) control of the traits by a single gene with dominant and recessive alleles
B) control of the traits by two genes with independent assortment
C) control of the traits by more than one gene with no effect of the environment
D) control of the traits by more than one gene plus environmental effects
E) control of the traits by environmental factors and not genetic factors
Unlock Deck
Unlock for access to all 81 flashcards in this deck.
Unlock Deck
k this deck
44
The graph below shows how yield in two varieties of corn respond to different environmental conditions. Which of the following statements is TRUE?
A) Under tested conditions, variety 1 has a higher yield than variety 2.
B) Under tested conditions, variety 2 has a higher yield than variety 1.
C) Under tested conditions, variety 2 is more sensitive to environment quality than variety 1.
D) Variety 1 is genetically superior to variety 2.
E) Variety 2 is genetically superior to variety 1.
Which of the following statements is TRUE?A) Under tested conditions, variety 1 has a higher yield than variety 2.
B) Under tested conditions, variety 2 has a higher yield than variety 1.
C) Under tested conditions, variety 2 is more sensitive to environment quality than variety 1.
D) Variety 1 is genetically superior to variety 2.
E) Variety 2 is genetically superior to variety 1.
Unlock Deck
Unlock for access to all 81 flashcards in this deck.
Unlock Deck
k this deck
45
Knowing the _____ of a trait has great practical importance because it allows statistical predictions regarding the phenotypes of offspring to be made on the basis of the parents' phenotypes.
A) variance
B) inbreeding coefficient
C) heritability
D) genotype
E) mean
A) variance
B) inbreeding coefficient
C) heritability
D) genotype
E) mean
Unlock Deck
Unlock for access to all 81 flashcards in this deck.
Unlock Deck
k this deck
46
If broad-sense heritability for a trait is very high and narrow-sense heritability is very low, which of the following statements must be TRUE?
A) Additive variance must be high relative to total phenotypic variance.
B) Dominance variance must be high relative to total phenotypic variance.
C) Environmental variance must be high relative to total phenotypic variance.
D) Genotypic-environmental covariance must be high relative to total phenotypic variance.
E) No conclusions can be drawn without additional information.
Unlock Deck
Unlock for access to all 81 flashcards in this deck.
Unlock Deck
k this deck
47
QTL mapping requires which of the following? (Select all that apply.)
A) genetic markers
B) offspring
C) a genetic map
D) a controlled cross
E) an estimate of homozygosity in the population
A) genetic markers
B) offspring
C) a genetic map
D) a controlled cross
E) an estimate of homozygosity in the population
Unlock Deck
Unlock for access to all 81 flashcards in this deck.
Unlock Deck
k this deck
48
When _____ is high for a particular trait, offspring tend to resemble their parents for that trait.
A) phenotypic variance
B) the number of genes controlling a trait
C) narrow-sense heritability
D) genetic-environmental interaction
E) environmental variance
A) phenotypic variance
B) the number of genes controlling a trait
C) narrow-sense heritability
D) genetic-environmental interaction
E) environmental variance
Unlock Deck
Unlock for access to all 81 flashcards in this deck.
Unlock Deck
k this deck
49
Estimates of heritability made by comparing related individuals assume that the environments of related individuals:
A) are more similar than those in which unrelated individuals are raised.
B) are not any more similar than those in which unrelated individuals are raised.
C) are manipulated so that some siblings within each family experience either one of the extreme ends of the environmental range.
D) have no effect at all on phenotypic variance in the family.
E) are identical for every sibling in the family.
Unlock Deck
Unlock for access to all 81 flashcards in this deck.
Unlock Deck
k this deck
50
The regression coefficient measures the _____ of the line depicting the relationship between two variables.
A) variance
B) slope
C) distribution
D) covariance
E) mean
A) variance
B) slope
C) distribution
D) covariance
E) mean
Unlock Deck
Unlock for access to all 81 flashcards in this deck.
Unlock Deck
k this deck
51
In a population of geese, the narrow-sense heritability for wing span is 0.5. The phenotypic variance is 0.8 and the environmental inheritance is 0.2. What is the additive genetic variance?
A) 0.25
B) 0.4
C) 0.5
D) 0.75
E) 1.5
A) 0.25
B) 0.4
C) 0.5
D) 0.75
E) 1.5
Unlock Deck
Unlock for access to all 81 flashcards in this deck.
Unlock Deck
k this deck
52
The estimated broad-sense heritability for milk production in a herd of dairy cattle is high. Which of the following statements is a valid inference?
A) Most of the variation in milk production in the herd is due to additive genetic variance within the herd.
B) Most of the variation in milk production in the herd is due to dominant genetic variance.
C) Little of the variation in milk production is due to environmental variation within the herd.
D) Selective breeding for high milk production in this herd will be effective.
E) Broad-sense heritability for milk production will be high in most other herds of dairy cattle.
Unlock Deck
Unlock for access to all 81 flashcards in this deck.
Unlock Deck
k this deck
53
You are hired as a consultant for a new venture: pet-squirrel breeding! Because customers prefer bushy tails on their pet squirrels, you are asked to help produce bushy-tailed squirrels from a local population as quickly and efficiently as possible. Of course, you know that bushy tails are a quantitative genetic trait in squirrels. What information would you need to obtain in order to accomplish this task?
A) the response to selection in the local squirrel population
B) the narrow-sense heritability in the local squirrel population
C) the selection differential in the local squirrel population
D) the dominance variance in the local squirrel population
E) the environmental variance in the local squirrel population
Unlock Deck
Unlock for access to all 81 flashcards in this deck.
Unlock Deck
k this deck
54
Genetic variance is comprised of all of the following components EXCEPT: (Select all that apply.)
A) additive genetic variance
B) dominance genetic variance
C) broad-sense heritability
D) genic interaction variance
E) genetic-environmental interaction variance
A) additive genetic variance
B) dominance genetic variance
C) broad-sense heritability
D) genic interaction variance
E) genetic-environmental interaction variance
Unlock Deck
Unlock for access to all 81 flashcards in this deck.
Unlock Deck
k this deck
55
_____ measures the effect of alleles at a locus interacting in a nonadditive fashion.
A) Additive genetic variance
B) Dominance genetic variance
C) Genetic variance
D) Genetic-environmental interaction variance
E) Phenotypic variance
A) Additive genetic variance
B) Dominance genetic variance
C) Genetic variance
D) Genetic-environmental interaction variance
E) Phenotypic variance
Unlock Deck
Unlock for access to all 81 flashcards in this deck.
Unlock Deck
k this deck
56
Phenotypic variation in tail length of unicorns has the following components: What is the broad-sense heritability for tail length in these unicorns?
A) 0.14
B) 0.3
C) 0.5
D) 0.7
E) 1.4
A) 0.14
B) 0.3
C) 0.5
D) 0.7
E) 1.4
Unlock Deck
Unlock for access to all 81 flashcards in this deck.
Unlock Deck
k this deck
57
You are hired as a consultant for a new venture: pet-squirrel breeding! Because customers prefer bushy tails on their pet squirrels, you are asked to help produce bushy-tailed squirrels from a local population as quickly and efficiently as possible. Of course, you know that bushy tails are a quantitative genetic trait in squirrels. Suppose you are hired by a breeder in Canada to help set up a breeding program. You hate the cold weather and want to avoid any unnecessary trips to Canada. Can you take what you have learned about your local population of squirrels and apply it to the Canadian population? Why or why not?
A) Yes. You can compare the two populations as long as you are studying the same trait in both populations.
B) Yes. You can compare the two populations because their narrow-sense heritabilities will be very similar.
C) Yes. You can compare the two populations because heritability calculations require environmental differences between populations to be omitted.
D) No. Heritability only applies to a particular population in a particular environment.
E) No. While heritability can apply across different populations, it would not apply here because the populations vary too greatly in their environments.
Unlock Deck
Unlock for access to all 81 flashcards in this deck.
Unlock Deck
k this deck
58
The height and weight for three dogs are shown below. a. Use the data to fill in the blanks in the following table. Round each to the nearest whole number and include the correct units. b. Fill in the blanks for the following table. c. For the data in the previous question, what are the values for covariance and correlation coefficient?
a. Use the data to fill in the blanks in the following table. Round each to the nearest whole number and include the correct units. b. Fill in the blanks for the following table. c. For the data in the previous question, what are the values for covariance and correlation coefficient? Unlock Deck
Unlock for access to all 81 flashcards in this deck.
Unlock Deck
k this deck
59
Heritability indicates the:
A) degree to which a characteristic is genetically determined.
B) proportion of phenotypic variation in a trait that is due to genetic differences.
C) degree to which a characteristic is environmentally determined.
D) proportion of phenotypic variation in a trait that is due to the environment.
E) extent to which identical twins are phenotypically similar.
Unlock Deck
Unlock for access to all 81 flashcards in this deck.
Unlock Deck
k this deck
60
Which of the following statement(s) about heritability is/are TRUE? (Select all that apply.)
A) Measures of heritability are specific to a defined population in a given environment.
B) The heritability of an individual cannot be estimated.
C) If heritability for a trait is high in a particular population, improving the environment is unlikely to result in a significant improvement in the trait over time.
D) Heritability does not indicate the degree to which a characteristic is genetically determined.
E) Heritability says nothing about the nature of differences between populations in a characteristic.
Unlock Deck
Unlock for access to all 81 flashcards in this deck.
Unlock Deck
k this deck
61
Narrow-sense heritability for IQ scores has been estimated as 0.4. If the mean IQ score in the population is 100, what is the predicted IQ for a group of children whose parents had a mean IQ score of 150?
Unlock Deck
Unlock for access to all 81 flashcards in this deck.
Unlock Deck
k this deck
62
In a natural population of outbreeding plants, the variance of the total number of seeds per plant is 16. From the natural population, 20 plants are taken into the laboratory and developed into separate true-breeding lines by self-fertilization-with selection for high, low, or moderate number of seeds-for 10 generations. The average variance in the tenth generation in each of the 20 sets is about equal and averages 5.8 across all the sets. Estimate the broad-sense heritability for seed number in this population.
Unlock Deck
Unlock for access to all 81 flashcards in this deck.
Unlock Deck
k this deck
63
Two varieties-X (susceptible) and Y (resistant)-of eggplant were used to characterize the genetics of resistance to a necrotizing plant pathogen. Eight thousand plants from each variety were inoculated, and the average number of necrotic lesions produced per leaf was recorded. Variety X averaged 52 lesions per leaf, whereas variety Y averaged six lesions per leaf. The F1 progeny from a cross between variety X and variety Y plants averaged 21 lesions per leaf, with a standard deviation of 3.7. Of the F2 progeny, 8000 were again tested by inoculation, and a total of four plants produced were phenotypically similar to the original parental plants-two plants for each extreme (i.e., parental) phenotype. Overall, the F2 plants averaged 18 lesions per leaf with a standard deviation of 7.5.
-How many gene pairs control resistance to this pathogen?
A) two
B) four
C) five
D) six
E) nine
-How many gene pairs control resistance to this pathogen?
A) two
B) four
C) five
D) six
E) nine
Unlock Deck
Unlock for access to all 81 flashcards in this deck.
Unlock Deck
k this deck
64
A population may eventually stop responding to artificial selection because:
A) individuals in the population have become homozygous for the alleles responsible for the trait.
B) natural selection opposes any further change in the characteristic.
C) natural selection can no longer enhance the results of artificial selection.
D) individuals in the population have become homozygous for the alleles responsible for the trait and natural selection opposes any further change in the characteristic.
E) individuals in the population have become homozygous for the alleles responsible for the trait and natural selection can no longer enhance the results of artificial selection.
Unlock Deck
Unlock for access to all 81 flashcards in this deck.
Unlock Deck
k this deck
65
Garter snakes eat poisonous newts. Selection favors increased resistance to the poison. Garter snakes must also escape their own predators, and they do so by crawling away (fast snakes are more likely to escape than slow snakes are). After studying snakes for some time, you discover that (1) both resistance and speed are highly heritable and (2) selection on resistance and speed is strong. Nonetheless, you find that neither trait increases very much each generation. Explain this result.
Unlock Deck
Unlock for access to all 81 flashcards in this deck.
Unlock Deck
k this deck
66
Two varieties-X (susceptible) and Y (resistant)-of eggplant were used to characterize the genetics of resistance to a necrotizing plant pathogen. Eight thousand plants from each variety were inoculated, and the average number of necrotic lesions produced per leaf was recorded. Variety X averaged 52 lesions per leaf, whereas variety Y averaged six lesions per leaf. The F1 progeny from a cross between variety X and variety Y plants averaged 21 lesions per leaf, with a standard deviation of 3.7. Of the F2 progeny, 8000 were again tested by inoculation, and a total of four plants produced were phenotypically similar to the original parental plants-two plants for each extreme (i.e., parental) phenotype. Overall, the F2 plants averaged 18 lesions per leaf with a standard deviation of 7.5.
- Determine the broad-sense heritability of resistance to this particular pathogen among the F2 plants, assuming that there is no genetic-environmental interaction variance for this trait.
A) 0.426
B) 0.563
C) 0.500
D) 0.757
E) 0.832
- Determine the broad-sense heritability of resistance to this particular pathogen among the F2 plants, assuming that there is no genetic-environmental interaction variance for this trait.
A) 0.426
B) 0.563
C) 0.500
D) 0.757
E) 0.832
Unlock Deck
Unlock for access to all 81 flashcards in this deck.
Unlock Deck
k this deck
67
Recently, genome-wide association studies that locate genes influencing quantitative traits have been facilitated by the use of:
A) pedigrees.
B) controlled crosses.
C) clonal lineages.
D) RFLPs.
E) SNPs.
A) pedigrees.
B) controlled crosses.
C) clonal lineages.
D) RFLPs.
E) SNPs.
Unlock Deck
Unlock for access to all 81 flashcards in this deck.
Unlock Deck
k this deck
68
Two varieties-X (susceptible) and Y (resistant)-of eggplant were used to characterize the genetics of resistance to a necrotizing plant pathogen. Eight thousand plants from each variety were inoculated, and the average number of necrotic lesions produced per leaf was recorded. Variety X averaged 52 lesions per leaf, whereas variety Y averaged six lesions per leaf. The F1 progeny from a cross between variety X and variety Y plants averaged 21 lesions per leaf, with a standard deviation of 3.7. Of the F2 progeny, 8000 were again tested by inoculation, and a total of four plants produced were phenotypically similar to the original parental plants-two plants for each extreme (i.e., parental) phenotype. Overall, the F2 plants averaged 18 lesions per leaf with a standard deviation of 7.5.
a. How many gene pairs control resistance to this pathogen?
b. Determine the broad-sense heritability of resistance to this particular pathogen among the F2 plants, assuming that there is no genetic-environmental interaction variance for this trait.
a. How many gene pairs control resistance to this pathogen?
b. Determine the broad-sense heritability of resistance to this particular pathogen among the F2 plants, assuming that there is no genetic-environmental interaction variance for this trait.
Unlock Deck
Unlock for access to all 81 flashcards in this deck.
Unlock Deck
k this deck
69
You are hired as a consultant for a new venture: pet-squirrel breeding! Because customers prefer bushy tails on their pet squirrels, you are asked to help produce bushy-tailed squirrels from a local population as quickly and efficiently as possible. Of course, you know that bushy tails are a quantitative genetic trait in squirrels.
a. What information would you need to obtain in order to accomplish this task?
b. Given your success at this job, you are hired by a breeder in Canada to help set up a breeding program. You hate the cold weather and want to avoid any unnecessary trips to Canada. Can you take what you have learned about your local population of squirrels and apply it to the Canadian population? Why or why not?
Unlock Deck
Unlock for access to all 81 flashcards in this deck.
Unlock Deck
k this deck
70
Phenotypic correlation may be due to genetic correlations such as _____, which is when one gene influences two or more traits.
A) broad-sense heritability
B) dominance genetic variance
C) pleiotropy
D) QTL
E) thresholds
A) broad-sense heritability
B) dominance genetic variance
C) pleiotropy
D) QTL
E) thresholds
Unlock Deck
Unlock for access to all 81 flashcards in this deck.
Unlock Deck
k this deck
71
A study was conducted to investigate the levels of calcium and growth hormone excreted in chicken dung on a major chicken farm. The variances (V) were calculated and are shown below. a. Calculate the narrow-sense heritability for both traits (calcium and growth hormone levels).
b. Which trait, if any, will more likely respond to artificial selection?
a. Calculate the narrow-sense heritability for both traits (calcium and growth hormone levels).b. Which trait, if any, will more likely respond to artificial selection?
Unlock Deck
Unlock for access to all 81 flashcards in this deck.
Unlock Deck
k this deck
72
A plant breeder has determined the following variances for yield of corn in his fields: Assume that there is no genetic-environmental interaction or other variances.
a. Calculate the total genetic variance.
b. Calculate the broad-sense heritability indicated by the data.
c. Calculate the narrow-sense heritability indicated by the data.
d. The breeder wishes to improve yield. If the average yield in the starting population is 400 and the breeder selects for breeding plants with an average yield of 500, what will be the expected average yield among the offspring of the selected plants?
Assume that there is no genetic-environmental interaction or other variances.a. Calculate the total genetic variance.
b. Calculate the broad-sense heritability indicated by the data.
c. Calculate the narrow-sense heritability indicated by the data.
d. The breeder wishes to improve yield. If the average yield in the starting population is 400 and the breeder selects for breeding plants with an average yield of 500, what will be the expected average yield among the offspring of the selected plants?
Unlock Deck
Unlock for access to all 81 flashcards in this deck.
Unlock Deck
k this deck
73
Count Dracula is interested in raising vampire bats on his Transylvanian ranch. For obvious reasons, he would like his bats to be able to suck blood very quickly, and he needs to have this flock of vampire bats ready for next Halloween. As you might know, blood sucking is a quantitative genetic trait in bats. What information does Count Dracula need in order to know if he will be successful at breeding faster-sucking bats quickly, and how might he determine this information?
Unlock Deck
Unlock for access to all 81 flashcards in this deck.
Unlock Deck
k this deck
74
The table below shows narrow-sense heritability estimates for body weight and egg production in chickens. a. Which chicken trait would respond best to selection? Explain your answer.
b. Explain the expected gain if high-egg-producing chickens are selectively bred.
c. Explain how and why the h2 would change over generations of selective breeding for high egg production.
a. Which chicken trait would respond best to selection? Explain your answer.b. Explain the expected gain if high-egg-producing chickens are selectively bred.
c. Explain how and why the h2 would change over generations of selective breeding for high egg production.
Unlock Deck
Unlock for access to all 81 flashcards in this deck.
Unlock Deck
k this deck
75
Frankenstein tells Dracula that he thinks that fast-flying bats tend to suck blood faster than slow-flying bats do. Because flight speed is easier to measure than blood sucking is, Dracula considers how he might use this information in his breeding program. Could Dracula select on flight speed and get an increase in blood sucking? What information would Dracula need to be able to answer this question, and how might he determine this information?
Unlock Deck
Unlock for access to all 81 flashcards in this deck.
Unlock Deck
k this deck
76
Suppose that a study of college students in Sweden estimates heritability of IQ to be 0.8. Based on this evidence, a school board in a struggling urban school district in the United States concludes that improving teaching methods and the physical conditions of schools is useless because intellectual achievement is determined almost entirely by genes and relatively little by the educational environment. Critique this conclusion based on your understanding of heritability.
Unlock Deck
Unlock for access to all 81 flashcards in this deck.
Unlock Deck
k this deck
77
Two different varieties of pumpkin have the same mean fresh weight of 22.5 lb. However, one variety (LV) has a very low variance, while the other (HV) has a much higher variance in fresh weight.
a. What are some possible reasons for the differences in the variance between these two varieties?
b. If you were a pumpkin breeder and wanted to develop a heavier variety of pumpkin, which of these two varieties would you select to start your breeding program? Explain why.
a. What are some possible reasons for the differences in the variance between these two varieties?
b. If you were a pumpkin breeder and wanted to develop a heavier variety of pumpkin, which of these two varieties would you select to start your breeding program? Explain why.
Unlock Deck
Unlock for access to all 81 flashcards in this deck.
Unlock Deck
k this deck
78
You and a close friend from the University of Tennessee go hiking in the mountains. You are surprised to see a salamander that is bright orange in color. Thinking that some overzealous Tennessee fans have painted this particular amphibian, you walk on. As you continue your hike, you find other salamanders of this species and note that there is variation in the coloration: some individuals are bright orange, but others are drab in color. You also note that these salamanders often eat bright orange insects. How might you explain the presence of the color polymorphism in this salamander species?
Unlock Deck
Unlock for access to all 81 flashcards in this deck.
Unlock Deck
k this deck
79
Cloning is a procedure by which exact genetic duplicates are made. A litter of cloned rabbits was born from a single surrogate mother rabbit. Despite being genetically identical, each of the baby rabbits looked very different from one another. Explain in detail why this might have occurred.
Unlock Deck
Unlock for access to all 81 flashcards in this deck.
Unlock Deck
k this deck
80
In a population of pigs, the average body weight is 178 kg. Suppose you select the 15 largest pigs, whose average body weight is 205 kg, and interbreed them. The average body weight of the offspring of the selected pigs is 191 kg. If you were to select pigs that have an average weight of 240 kg, what would be the predicted weight of the progeny produced by the selected pigs?
A) 30
B) 62
C) 115
D) 208
E) 270
A) 30
B) 62
C) 115
D) 208
E) 270
Unlock Deck
Unlock for access to all 81 flashcards in this deck.
Unlock Deck
k this deck
Unlock Deck
Unlock for access to all 81 flashcards in this deck.


