Deck 15: Correlation
Full screen (f)
Question
Question
Question
Question
Question
Question
Question
Question
Question
Question
Question
Question
Question
Question
Use the following to answer questions
The relation between a hockey player's age and the number of minutes he spent in the penalty box during the regular 2006-2007 season is shown in the figure.The 18 players were members of the New Jersey Devils hockey team who played in more than 40 games that season.
Figure: Age and Penalty Minutes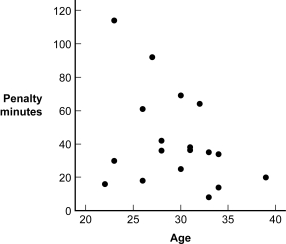
(Figure: Age and Penalty Minutes) Based on the scatterplot, what is the relation between a hockey player's age and the number of minutes he spent in the penalty box?
A) perfect positive
B) positive
C) negative
D) no relation
Question
Use the following to answer question
Nietfeld and Ender (2003) performed a study investigating the relation between the intelligence of student teachers and their efficacy in the classroom.This relation is depicted in the scatterplot, which shows fictional data that replicate the pattern of performance observed by the researchers.
Figure: Teaching Efficacy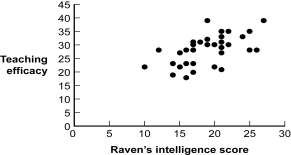
(Figure: Teaching Efficacy) Based on the scatterplot, what kind of relation between intelligence and teaching efficacy did Nietfeld and Ender find?
A) perfect positive
B) positive
C) negative
D) no relation
Question
Question
Question
Question
Use the following to answer questions
The relation between a hockey player's age and the number of minutes he spent in the penalty box during the regular 2006-2007 season is shown in the figure.The 18 players were members of the New Jersey Devils hockey team who played in more than 40 games that season.
Figure: Age and Penalty Minutes
(Figure: Age and Penalty Minutes) Based on the scatterplot, it appears that as a hockey player's age increases, the number of minutes spent in the penalty box:
A) increases.
B) decreases.
C) remains the same.
D) is unrelated.
Question
Question
Question
Question
Question
Question
Question
Question
Question
Question
Question
Question
Question
Question
Question
Question
Question
Question
Question
Use the following to answer question
The scatterplot, created from 1995 U.S.News & World Report data on approximately 1,300 U.S.colleges and universities, depicts the relation between the student-faculty ratio at the school and the number of admissions applications the school received.
Figure: Student-Faculty Ratio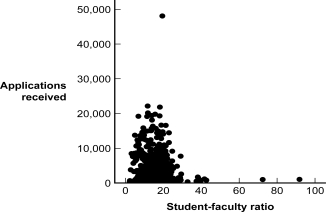
(Figure: Student-Faculty Ratio) Based on the scatterplot, what is the relation between an institution's student-faculty ratio and the number of applications it receives?
A) perfect positive
B) positive
C) negative
D) no relation
Question
Question
Question
Question
Question
Question
Question
Question
Question
Question
Question
Question
Question
Question
Question
Question
Question
Question
Question
Question
Question
Question
Question
Question
Question
Question
Question
Question
Question
Question
Question
Question
Question
Question
Question
Question
Question
Question
Question
Question
Question
Question

Unlock Deck
Sign up to unlock the cards in this deck!
Unlock Deck
Unlock Deck
1/139
Play
Full screen (f)
Deck 15: Correlation
1
If a positive relation exists between two variables, then low scores on one variable will be associated with _____ scores on the other variable.
A) low
B) high
C) both high and low
D) neither high nor low
A) low
B) high
C) both high and low
D) neither high nor low
low
2
"The incidence of depression among college students is negatively correlated with the number of sunny days each year in the locale where they attend college." This statement means that:
A) the chances of a college student being depressed tend to increase with fewer sunny days.
B) a student attending college in a locale with very few sunny days will become depressed.
C) the chances of a college student being depressed tend to increase as the number of sunny days increases.
D) a depressed student who moves to a locale with more sunny days will become less depressed.
the chances of a college student being depressed tend to increase with fewer sunny days.
3
What kind of correlation would one expect to find between levels of family income and household spending on consumer goods?
A) positive
B) zero
C) negative
D) perfect positive
A) positive
B) zero
C) negative
D) perfect positive
positive
4
A negative correlation between a hockey player's age and the number of minutes he spends in the penalty box indicates that:
A) spending more time on the ice leads hockey players to become skilled at avoiding the referees.
B) older players make fewer penalties because they have reduced testosterone levels.
C) the older a player is, the less time he spends in the penalty box.
D) an older player's greater experience has taught him how to avoid making penalties.
Unlock Deck
Unlock for access to all 139 flashcards in this deck.
Unlock Deck
k this deck
5
Researchers who study the process of reading in children have discovered that better readers watch fewer hours of television.If a scatterplot of the data is drawn, the points on the graph would likely run from _____ left to _____ right.
A) upper; lower
B) lower; upper
C) upper; upper
D) lower; lower
A) upper; lower
B) lower; upper
C) upper; upper
D) lower; lower
Unlock Deck
Unlock for access to all 139 flashcards in this deck.
Unlock Deck
k this deck
6
The numerical value for a correlation ranges between _____ and _____.
A) 0; 1.00
B) -1.00; 1.00
C) -1.00; 0
D) negative infinity; positive infinity
A) 0; 1.00
B) -1.00; 1.00
C) -1.00; 0
D) negative infinity; positive infinity
Unlock Deck
Unlock for access to all 139 flashcards in this deck.
Unlock Deck
k this deck
7
A positive correlation between head size and foot size indicates that:
A) having a large head causes a person to have large feet.
B) having large feet causes a person to have a large head.
C) people with larger feet also tend to have larger heads.
D) people with larger feet tend to have smaller heads.
A) having a large head causes a person to have large feet.
B) having large feet causes a person to have a large head.
C) people with larger feet also tend to have larger heads.
D) people with larger feet tend to have smaller heads.
Unlock Deck
Unlock for access to all 139 flashcards in this deck.
Unlock Deck
k this deck
8
In a re-analysis of published studies, Twenge and Im (2007) found that for the time period 1958-2001, the need for social approval of people in the United States was negatively correlated with the U.S.divorce rate during the same period (the correlation coefficient was -0.38).This correlation means that:
A) the need for social approval prevented people from seeking divorce.
B) the need for social approval spurred people to divorce.
C) when the need for social approval was high, divorce rates were low.
D) when the need for social approval was high, divorce rates were high.
A) the need for social approval prevented people from seeking divorce.
B) the need for social approval spurred people to divorce.
C) when the need for social approval was high, divorce rates were low.
D) when the need for social approval was high, divorce rates were high.
Unlock Deck
Unlock for access to all 139 flashcards in this deck.
Unlock Deck
k this deck
9
If a negative relation exists between two variables, then low scores on one variable will be associated with _____ scores on the other variable.
A) low
B) high
C) both high and low
D) neither high nor low
A) low
B) high
C) both high and low
D) neither high nor low
Unlock Deck
Unlock for access to all 139 flashcards in this deck.
Unlock Deck
k this deck
10
A researcher discovers that length of time spent following a Mediterranean diet is negatively correlated with risk of developing cancer.Which statement logically follows from this information?
A) Eating a Mediterranean diet increases the risk of developing cancer.
B) Eating a Mediterranean diet reduces the risk of developing cancer.
C) People who ate a Mediterranean diet for longer periods were less likely to have cancer.
D) People who ate a Mediterranean diet for longer periods were more likely to have cancer.
Unlock Deck
Unlock for access to all 139 flashcards in this deck.
Unlock Deck
k this deck
11
What kind of correlation would one expect to find between the age of a car (nonclassic) and its value?
A) positive
B) zero
C) negative
D) perfect positive
A) positive
B) zero
C) negative
D) perfect positive
Unlock Deck
Unlock for access to all 139 flashcards in this deck.
Unlock Deck
k this deck
12
Researchers who study the process of reading in children have discovered that better readers make smoother eye movements across the page.If a scatterplot of the data is drawn, the points on the graph would likely run from _____ left to _____ right.
A) upper; lower
B) lower; upper
C) upper; upper
D) lower; lower
A) upper; lower
B) lower; upper
C) upper; upper
D) lower; lower
Unlock Deck
Unlock for access to all 139 flashcards in this deck.
Unlock Deck
k this deck
13
What kind of correlation would one expect to find between the severity of snowstorms and rates of attendance at college classes?
A) positive
B) zero
C) negative
D) perfect negative
A) positive
B) zero
C) negative
D) perfect negative
Unlock Deck
Unlock for access to all 139 flashcards in this deck.
Unlock Deck
k this deck
14
Use the following to answer questions
The relation between a hockey player's age and the number of minutes he spent in the penalty box during the regular 2006-2007 season is shown in the figure.The 18 players were members of the New Jersey Devils hockey team who played in more than 40 games that season.
Figure: Age and Penalty Minutes
(Figure: Age and Penalty Minutes) Based on the scatterplot, what is the relation between a hockey player's age and the number of minutes he spent in the penalty box?
A) perfect positive
B) positive
C) negative
D) no relation
Unlock Deck
Unlock for access to all 139 flashcards in this deck.
Unlock Deck
k this deck
15
Use the following to answer question
Nietfeld and Ender (2003) performed a study investigating the relation between the intelligence of student teachers and their efficacy in the classroom.This relation is depicted in the scatterplot, which shows fictional data that replicate the pattern of performance observed by the researchers.
Figure: Teaching Efficacy
(Figure: Teaching Efficacy) Based on the scatterplot, what kind of relation between intelligence and teaching efficacy did Nietfeld and Ender find?
A) perfect positive
B) positive
C) negative
D) no relation
Unlock Deck
Unlock for access to all 139 flashcards in this deck.
Unlock Deck
k this deck
16
In a re-analysis of published studies, Twenge and Im (2007) found that for the time period 1958-2001, the need for social approval of people in the United States was negatively correlated with the U.S.violent crime rate during the same period (the correlation coefficient was -0.31).This correlation means that:
A) the need for social approval prevented people from committing violent crimes.
B) the need for social approval spurred people to commit violent crimes.
C) as the need for social approval went up, the number of violent crimes also increased.
D) as the need for social approval went up, the number of violent crimes decreased.
Unlock Deck
Unlock for access to all 139 flashcards in this deck.
Unlock Deck
k this deck
17
If a positive relation exists between two variables, then high scores on one variable will be associated with _____ scores on the other variable.
A) low
B) high
C) both high and low
D) neither high nor low
A) low
B) high
C) both high and low
D) neither high nor low
Unlock Deck
Unlock for access to all 139 flashcards in this deck.
Unlock Deck
k this deck
18
If a negative relation exists between two variables, then high scores on one variable will be associated with _____ scores on the other variable.
A) low
B) high
C) both high and low
D) neither high nor low
A) low
B) high
C) both high and low
D) neither high nor low
Unlock Deck
Unlock for access to all 139 flashcards in this deck.
Unlock Deck
k this deck
19
Use the following to answer questions
The relation between a hockey player's age and the number of minutes he spent in the penalty box during the regular 2006-2007 season is shown in the figure.The 18 players were members of the New Jersey Devils hockey team who played in more than 40 games that season.
Figure: Age and Penalty Minutes
(Figure: Age and Penalty Minutes) Based on the scatterplot, it appears that as a hockey player's age increases, the number of minutes spent in the penalty box:
A) increases.
B) decreases.
C) remains the same.
D) is unrelated.
Unlock Deck
Unlock for access to all 139 flashcards in this deck.
Unlock Deck
k this deck
20
What is the correlation between a person's weight as measured in grams and a person's weight as measured in pounds?
A) -1.00
B) 0.00
C) +0.50
D) +1.00
A) -1.00
B) 0.00
C) +0.50
D) +1.00
Unlock Deck
Unlock for access to all 139 flashcards in this deck.
Unlock Deck
k this deck
21
According to guidelines published by Cohen (1988), a correlation value of -0.48 would be considered:
A) small.
B) medium.
C) large.
D) very large.
A) small.
B) medium.
C) large.
D) very large.
Unlock Deck
Unlock for access to all 139 flashcards in this deck.
Unlock Deck
k this deck
22
Based on research with her patients, Dr.Sabine knows that the correlation coefficient between scores on an anxiety scale and comfort at a social gathering is -0.46.According to guidelines established by Cohen, how would the strength of this relationship be characterized?
A) small
B) medium
C) large
D) very large
A) small
B) medium
C) large
D) very large
Unlock Deck
Unlock for access to all 139 flashcards in this deck.
Unlock Deck
k this deck
23
Which of these represents a perfect correlation?
A) -1.00 only
B) 1.00 only
C) 0
D) -1.00 or 1.00
A) -1.00 only
B) 1.00 only
C) 0
D) -1.00 or 1.00
Unlock Deck
Unlock for access to all 139 flashcards in this deck.
Unlock Deck
k this deck
24
What is the relationship between correlation and causation?
A) There is no relationship between correlation and causation.
B) Correlation is necessary for causation.
C) Correlation is sufficient for causation.
D) Correlation is both necessary and sufficient for causation.
A) There is no relationship between correlation and causation.
B) Correlation is necessary for causation.
C) Correlation is sufficient for causation.
D) Correlation is both necessary and sufficient for causation.
Unlock Deck
Unlock for access to all 139 flashcards in this deck.
Unlock Deck
k this deck
25
Which of these values indicates the strongest relationship between two variables?
A) 0.65
B) 0.59
C) -0.25
D) -0.72
A) 0.65
B) 0.59
C) -0.25
D) -0.72
Unlock Deck
Unlock for access to all 139 flashcards in this deck.
Unlock Deck
k this deck
26
Which of these values indicates the strongest relationship between two variables?
A) 0.48
B) 0.36
C) -0.25
D) -0.45
A) 0.48
B) 0.36
C) -0.25
D) -0.45
Unlock Deck
Unlock for access to all 139 flashcards in this deck.
Unlock Deck
k this deck
27
According to guidelines published by Cohen (1988), a correlation value of -0.55 would be considered:
A) small.
B) medium.
C) large.
D) very large.
A) small.
B) medium.
C) large.
D) very large.
Unlock Deck
Unlock for access to all 139 flashcards in this deck.
Unlock Deck
k this deck
28
According to guidelines published by Cohen (1988), a correlation value of _____ is considered small, _____ is medium, and _____ is strong.
A) 0.10; 0.30; 0.50
B) 0.25; 0.50; 0.75
C) 0.40; 0.60; 0.80
D) 1.00; 2.00; 3.00
A) 0.10; 0.30; 0.50
B) 0.25; 0.50; 0.75
C) 0.40; 0.60; 0.80
D) 1.00; 2.00; 3.00
Unlock Deck
Unlock for access to all 139 flashcards in this deck.
Unlock Deck
k this deck
29
If all the points on a scatterplot fall on a single line:
A) there is no relation between the variables.
B) the relation between the variables is perfect.
C) the variables are causally related.
D) the relation between the variables is positive.
A) there is no relation between the variables.
B) the relation between the variables is perfect.
C) the variables are causally related.
D) the relation between the variables is positive.
Unlock Deck
Unlock for access to all 139 flashcards in this deck.
Unlock Deck
k this deck
30
In a re-analysis of published studies, Twenge and Im (2007) found that for the time period of 1958 to 2001, the need for social approval of people in the United States was positively correlated with changes in the Dow Jones Industrial Average during that same period (the correlation coefficient was 0.10).This means that:
A) the need for social approval caused people to invest more money in the stock market.
B) the need for social approval prevented people from investing money in the stock market.
C) when the need for social approval was high, the Dow Jones Industrial Average was also high.
D) when the need for social approval was high, the Dow Jones Industrial Average was low.
Unlock Deck
Unlock for access to all 139 flashcards in this deck.
Unlock Deck
k this deck
31
Which of these correlation coefficients allows a perfect prediction of scores on one variable from knowledge of scores on the other variable?
A) -1.00
B) 0
C) 0.50
D) 2.00
A) -1.00
B) 0
C) 0.50
D) 2.00
Unlock Deck
Unlock for access to all 139 flashcards in this deck.
Unlock Deck
k this deck
32
What kind of correlation would one expect to find between the results of two dice thrown simultaneously?
A) positive
B) zero
C) negative
D) perfect positive
A) positive
B) zero
C) negative
D) perfect positive
Unlock Deck
Unlock for access to all 139 flashcards in this deck.
Unlock Deck
k this deck
33
According to guidelines published by Cohen (1988), a correlation value of 0.29 would be considered:
A) small.
B) medium.
C) large.
D) very large.
A) small.
B) medium.
C) large.
D) very large.
Unlock Deck
Unlock for access to all 139 flashcards in this deck.
Unlock Deck
k this deck
34
The results of a study find a positive correlation between gum chewing and life expectancy.Which statement would be a statistically appropriate response to the results of the study?
A) You purchase a lifetime supply of gum because chewing gum is good for your health.
B) You bemoan the possibility of living so long that you will have to chew lots of gum.
C) You become curious about what third variables might cause both increases in gum chewing and increases in life expectancy.
D) You tell all your friends and family members to chew gum because it is good for their health.
Unlock Deck
Unlock for access to all 139 flashcards in this deck.
Unlock Deck
k this deck
35
Why do correlation coefficients greater than 0.50 rarely occur in the social sciences?
A) Human behavior is the product of many interacting variables; any single variable will be limited in its association with a behavior.
B) Social scientists fail to construct experiments carefully enough to detect larger correlations.
C) The highest value a correlation coefficient can take on is 0.60.
D) Social scientists have not yet discovered the variables that are the best predictors of human behavior.
Unlock Deck
Unlock for access to all 139 flashcards in this deck.
Unlock Deck
k this deck
36
Researchers who study the process of reading in children have discovered that better readers make smoother eye movements across the page (i.e., there is a positive correlation between reading skill and the smoothness of the eye movements).Which statement is a possible cause of the correlation between smooth eye movements and reading ability?
A) The ability to make smooth eye movements improves reading ability.
B) Having good reading skills allows a child to make smooth eye movements.
C) Some third factor might cause both smooth eye movements and improved reading ability.
D) All of these options are possible causes of the correlation.
A) The ability to make smooth eye movements improves reading ability.
B) Having good reading skills allows a child to make smooth eye movements.
C) Some third factor might cause both smooth eye movements and improved reading ability.
D) All of these options are possible causes of the correlation.
Unlock Deck
Unlock for access to all 139 flashcards in this deck.
Unlock Deck
k this deck
37
Which of these values of the correlation coefficient indicates the weakest relationship between two variables?
A) -0.87
B) -0.30
C) 0.42
D) 0.03
A) -0.87
B) -0.30
C) 0.42
D) 0.03
Unlock Deck
Unlock for access to all 139 flashcards in this deck.
Unlock Deck
k this deck
38
Use the following to answer question
The scatterplot, created from 1995 U.S.News & World Report data on approximately 1,300 U.S.colleges and universities, depicts the relation between the student-faculty ratio at the school and the number of admissions applications the school received.
Figure: Student-Faculty Ratio
(Figure: Student-Faculty Ratio) Based on the scatterplot, what is the relation between an institution's student-faculty ratio and the number of applications it receives?
A) perfect positive
B) positive
C) negative
D) no relation
Unlock Deck
Unlock for access to all 139 flashcards in this deck.
Unlock Deck
k this deck
39
Which of these values of the correlation coefficient indicates the weakest relationship between two variables?
A) -0.94
B) -0.62
C) 0.68
D) 0.95
A) -0.94
B) -0.62
C) 0.68
D) 0.95
Unlock Deck
Unlock for access to all 139 flashcards in this deck.
Unlock Deck
k this deck
40
The correlation coefficient between class attendance and number of problems missed on an exam is -0.77.Which statement regarding this finding is correct?
A) If you start attending class more regularly, the number of problems you miss on the next exam is certain to be increased.
B) There is no causal relationship between the two variables.
C) If you attend class regularly, you are more likely to do well on the exam than someone who does not attend class regularly.
D) The correlation demonstrates causality.
Unlock Deck
Unlock for access to all 139 flashcards in this deck.
Unlock Deck
k this deck
41
One assumption for using hypothesis testing for Pearson correlation is that one variable should vary equally at each level of the other variable.What is the easiest way to determine whether this assumption has been met?
A) Review the value of r; if it is high, then the assumption has been met.
B) Conduct a post hoc test following the calculation of r.
C) Draw a scatterplot to see whether the range of values is equal across all values of the other variable.
D) Calculate the cross-products of the deviation scores.If the result is positive, then the assumption has been met.
Unlock Deck
Unlock for access to all 139 flashcards in this deck.
Unlock Deck
k this deck
42
A _____ is a graphical representation of the relation between two variables.
A) correlation coefficient
B) scatterplot
C) histogram
D) polygon
A) correlation coefficient
B) scatterplot
C) histogram
D) polygon
Unlock Deck
Unlock for access to all 139 flashcards in this deck.
Unlock Deck
k this deck
43
What is the null hypothesis when testing for significance using the Pearson correlation coefficient?
A) 1 = 2
B) r = 0
C) r *0
D) = 0
A) 1 = 2
B) r = 0
C) r *0
D) = 0
Unlock Deck
Unlock for access to all 139 flashcards in this deck.
Unlock Deck
k this deck
44
When conducting a hypothesis test for the Pearson correlation coefficient, degrees of freedom is calculated by:
A) (X - MX)2.
B) (N1 - 1)(N2 - 1).
C) N - 1.
D) N - 2.
A) (X - MX)2.
B) (N1 - 1)(N2 - 1).
C) N - 1.
D) N - 2.
Unlock Deck
Unlock for access to all 139 flashcards in this deck.
Unlock Deck
k this deck
45
When conducting a hypothesis test for the Pearson correlation coefficient, the null hypothesis states that there is _______ between the two variables.
A) a correlation
B) no correlation
C) a positive correlation
D) a negative correlation
A) a correlation
B) no correlation
C) a positive correlation
D) a negative correlation
Unlock Deck
Unlock for access to all 139 flashcards in this deck.
Unlock Deck
k this deck
46
What is the formula for the Pearson correlation coefficient?
A)
B)
C)
D)
A)
B)
C)
D)
Unlock Deck
Unlock for access to all 139 flashcards in this deck.
Unlock Deck
k this deck
47
Which statement is an assumption that should be met before hypothesis testing with the correlation coefficient?
A) The two variables should be significantly related to one another.
B) At least one of the variables is ordinal or nominal.
C) The variability in one variable should not be the same as the variability in the other variable.
D) Each variable should vary equally, regardless of the magnitude of the other variable.
Unlock Deck
Unlock for access to all 139 flashcards in this deck.
Unlock Deck
k this deck
48
The Pearson correlation coefficient is symbolized by:
A) r.
B) x.
C) c.
D) t.
A) r.
B) x.
C) c.
D) t.
Unlock Deck
Unlock for access to all 139 flashcards in this deck.
Unlock Deck
k this deck
49
Using the Pearson correlation coefficient to analyze the relationship between two variables is only appropriate if the variables are:
A) scale variables.
B) ordinal variables.
C) linearly related.
D) linearly related and scale variables.
A) scale variables.
B) ordinal variables.
C) linearly related.
D) linearly related and scale variables.
Unlock Deck
Unlock for access to all 139 flashcards in this deck.
Unlock Deck
k this deck
50
The first step involved in calculating the Pearson correlation coefficient is to:
A) multiply each raw score in one variable by the corresponding raw score in the second variable.
B) square all the scores.
C) calculate the deviation of each score from its mean.
D) calculate the standard deviation for each variable.
A) multiply each raw score in one variable by the corresponding raw score in the second variable.
B) square all the scores.
C) calculate the deviation of each score from its mean.
D) calculate the standard deviation for each variable.
Unlock Deck
Unlock for access to all 139 flashcards in this deck.
Unlock Deck
k this deck
51
When a positive relation exists between two variables, what will be true in the calculation of the Pearson correlation coefficient?
A) The product of most pairs of deviations will be positive.
B) Most deviation scores will be positive.
C) Most deviation scores will be negative.
D) The product of most pairs of deviations will be negative.
A) The product of most pairs of deviations will be positive.
B) Most deviation scores will be positive.
C) Most deviation scores will be negative.
D) The product of most pairs of deviations will be negative.
Unlock Deck
Unlock for access to all 139 flashcards in this deck.
Unlock Deck
k this deck
52
What is the research hypothesis when testing for significance using the Pearson correlation coefficient?
A) 1 = 2
B) r = 0
C) *0
D) = 1
A) 1 = 2
B) r = 0
C) *0
D) = 1
Unlock Deck
Unlock for access to all 139 flashcards in this deck.
Unlock Deck
k this deck
53
The denominator of the Pearson correlation equation corrects for _____ and _____ issues present in the numerator.
A) sample size; variability
B) sample size; non-normality
C) negative values; variability
D) negative values; nonlinear data
A) sample size; variability
B) sample size; non-normality
C) negative values; variability
D) negative values; nonlinear data
Unlock Deck
Unlock for access to all 139 flashcards in this deck.
Unlock Deck
k this deck
54
The denominator (bottom half) of the Pearson correlation coefficient includes the:
A) sum of the product of the deviations for each variable.
B) square root of the product of the two sum of squares.
C) difference between the sample means.
D) square root of the deviations for each variable.
A) sum of the product of the deviations for each variable.
B) square root of the product of the two sum of squares.
C) difference between the sample means.
D) square root of the deviations for each variable.
Unlock Deck
Unlock for access to all 139 flashcards in this deck.
Unlock Deck
k this deck
55
The numerator (top half) of the Pearson correlation coefficient formula includes the:
A) sum of the product of the deviations for each variable.
B) square root of the product of the two sums of squares.
C) difference between the two sample means.
D) correction for variability and sample size.
A) sum of the product of the deviations for each variable.
B) square root of the product of the two sums of squares.
C) difference between the two sample means.
D) correction for variability and sample size.
Unlock Deck
Unlock for access to all 139 flashcards in this deck.
Unlock Deck
k this deck
56
Before calculating the correlation coefficient, it is advisable to create a _____ as a way of displaying the association between the two variables.
A) scatterplot
B) line graph
C) histogram
D) polygon
A) scatterplot
B) line graph
C) histogram
D) polygon
Unlock Deck
Unlock for access to all 139 flashcards in this deck.
Unlock Deck
k this deck
57
According to guidelines published by Cohen (1988), a correlation value of -0.09 would be considered:
A) small.
B) medium.
C) large.
D) very large.
A) small.
B) medium.
C) large.
D) very large.
Unlock Deck
Unlock for access to all 139 flashcards in this deck.
Unlock Deck
k this deck
58
A Pearson correlation coefficient is calculated for 48 individuals.What value of df should be used to determine statistical significance in hypothesis testing?
A) 48
B) 47
C) 46
D) 45
A) 48
B) 47
C) 46
D) 45
Unlock Deck
Unlock for access to all 139 flashcards in this deck.
Unlock Deck
k this deck
59
Which of these is NOT an assumption when conducting hypothesis testing for r?
A) The population distributions should be normal.
B) To insure generalizability, the data should be randomly selected.
C) The variability of scores on one variable should be equal across all levels of the second variable.
D) The variables being studied are positively correlated.
A) The population distributions should be normal.
B) To insure generalizability, the data should be randomly selected.
C) The variability of scores on one variable should be equal across all levels of the second variable.
D) The variables being studied are positively correlated.
Unlock Deck
Unlock for access to all 139 flashcards in this deck.
Unlock Deck
k this deck
60
The Pearson correlation coefficient is a statistic that measures:
A) the causal association between scale variables.
B) an association between scale, ordinal, and nominal variables.
C) a linear relation between two scale variables.
D) relatedness in terms of variability between variables.
A) the causal association between scale variables.
B) an association between scale, ordinal, and nominal variables.
C) a linear relation between two scale variables.
D) relatedness in terms of variability between variables.
Unlock Deck
Unlock for access to all 139 flashcards in this deck.
Unlock Deck
k this deck
61
If one wishes to assess the relation between a farming county's average annual temperature and the crop yield, it may be important to take into account the overlapping variability that crop yield and temperature share with rainfall.To do so, one would compute a:
A) split-half reliability.
B) partial correlation.
C) concurrent validity.
D) coefficient alpha.
A) split-half reliability.
B) partial correlation.
C) concurrent validity.
D) coefficient alpha.
Unlock Deck
Unlock for access to all 139 flashcards in this deck.
Unlock Deck
k this deck
62
If a test actually measures what it is intended to measure, then that test is:
A) reliable.
B) valid.
C) free of restriction of range problems.
D) internally consistent.
A) reliable.
B) valid.
C) free of restriction of range problems.
D) internally consistent.
Unlock Deck
Unlock for access to all 139 flashcards in this deck.
Unlock Deck
k this deck
63
If two variables are negatively correlated, then high scores on one variable would be associated with low scores on the other variable.
Unlock Deck
Unlock for access to all 139 flashcards in this deck.
Unlock Deck
k this deck
64
The average of all possible split-half correlations is:
A) coefficient alpha, a measure of validity.
B) coefficient alpha, a measure of reliability.
C) the test-retest reliability.
D) the test-retest validity.
A) coefficient alpha, a measure of validity.
B) coefficient alpha, a measure of reliability.
C) the test-retest reliability.
D) the test-retest validity.
Unlock Deck
Unlock for access to all 139 flashcards in this deck.
Unlock Deck
k this deck
65
Based on research with her patients, Dr.Sabine knows that the correlation coefficient between scores on an anxiety scale and comfort at a social gathering is -0.35.If the critical value for r is 0.330, what should she conclude?
A) The null hypothesis should be retained.
B) Scores on the anxiety scale are significantly related to feelings of comfort in a social gathering.
C) Scores on the anxiety scale are not significantly related to feelings of comfort in a social gathering.
D) Scores on the anxiety scale are causally related to feelings of comfort in a social gathering.
Unlock Deck
Unlock for access to all 139 flashcards in this deck.
Unlock Deck
k this deck
66
A technique that quantifies the degree of association between two variables after statistically removing the association of a third variable with both of those two variables is:
A) split-half reliability.
B) partial correlation.
C) concurrent validity.
D) coefficient alpha.
A) split-half reliability.
B) partial correlation.
C) concurrent validity.
D) coefficient alpha.
Unlock Deck
Unlock for access to all 139 flashcards in this deck.
Unlock Deck
k this deck
67
When conducting a hypothesis test for the Pearson correlation coefficient, the research hypothesis states that there is _______ between the two variables.
A) a correlation
B) no correlation
C) a positive correlation
D) a negative correlation
A) a correlation
B) no correlation
C) a positive correlation
D) a negative correlation
Unlock Deck
Unlock for access to all 139 flashcards in this deck.
Unlock Deck
k this deck
68
In an investigation of the psychometric properties of the Criminal Sentiments Scale (CSS), Witte et al.(2006) administered the scale to 72 sex offenders.They found that scores on the scale correlated positively with recidivism for nonsexual crimes, but not for sexual crimes.This research suggests that the CSS is:
A) a valid measure of sentiment to commit sexual crimes, but not a valid measure of the sentiment to commit nonsexual crimes.
B) a valid measure of sentiment to commit nonsexual crimes, but not a valid measure of the sentiment to commit sexual crimes.
C) a valid measure of sentiment to commit both nonsexual crimes and sexual crimes.
D) not a reliable measure.
Unlock Deck
Unlock for access to all 139 flashcards in this deck.
Unlock Deck
k this deck
69
The most widely used measure of reliability is:
A) the split-half correlation, in which the odd and even numbered items of a measure are correlated to assess internal consistency.
B) coefficient alpha, the average of all possible split-half correlations.
C) the test-retest reliability.
D) criterion-related reliability.
A) the split-half correlation, in which the odd and even numbered items of a measure are correlated to assess internal consistency.
B) coefficient alpha, the average of all possible split-half correlations.
C) the test-retest reliability.
D) criterion-related reliability.
Unlock Deck
Unlock for access to all 139 flashcards in this deck.
Unlock Deck
k this deck
70
If one wishes to assess the relation between race and access to healthcare, it may be important to take into account the overlapping variability that race and access to healthcare share with household income.If a correlation between race and access to healthcare is found after controlling for household income, it indicates that:
A) access to healthcare is not associated with race or household income.
B) race, access to healthcare, and household income are perfectly correlated with one another.
C) there are racial inequities in access to healthcare that cannot be accounted for by differences in household income.
D) any differences in access to healthcare are attributable to differences in household income.
Unlock Deck
Unlock for access to all 139 flashcards in this deck.
Unlock Deck
k this deck
71
Psychometricians are concerned with:
A) developing high-quality tests and measures.
B) fixing psychological issues in people.
C) studying illness and the onset of psychological illness.
D) statistics and computers.
A) developing high-quality tests and measures.
B) fixing psychological issues in people.
C) studying illness and the onset of psychological illness.
D) statistics and computers.
Unlock Deck
Unlock for access to all 139 flashcards in this deck.
Unlock Deck
k this deck
72
A correlation is computed using data from 28 people.What is the critical cutoff for a two-tailed hypothesis test with a p level of 0.05?
A) 0.317
B) 0.374
C) -0.317 and 0.317
D) -0.374 and 0.374
A) 0.317
B) 0.374
C) -0.317 and 0.317
D) -0.374 and 0.374
Unlock Deck
Unlock for access to all 139 flashcards in this deck.
Unlock Deck
k this deck
73
If two variables are positively correlated, then low scores on one variable would be associated with low scores on the other variable.
Unlock Deck
Unlock for access to all 139 flashcards in this deck.
Unlock Deck
k this deck
74
A coefficient alpha of _____ is considered a minimally acceptable level of reliability for measures that will be used in research studies in which individual scores will be averaged.
A) 0.95
B) 0.90
C) 0.80
D) 0.75
A) 0.95
B) 0.90
C) 0.80
D) 0.75
Unlock Deck
Unlock for access to all 139 flashcards in this deck.
Unlock Deck
k this deck
75
If two variables are negatively correlated, then low scores on one variable would be associated with low scores on the other variable.
Unlock Deck
Unlock for access to all 139 flashcards in this deck.
Unlock Deck
k this deck
76
A correlation is computed using data from 19 people.What is the critical cutoff for a two-tailed hypothesis test with a p level of 0.05?
A) -0.389 or 0.389
B) -0.456 and 0.456
C) -0.528 and 0.528
D) -0.575 or 0.575
A) -0.389 or 0.389
B) -0.456 and 0.456
C) -0.528 and 0.528
D) -0.575 or 0.575
Unlock Deck
Unlock for access to all 139 flashcards in this deck.
Unlock Deck
k this deck
77
Test-retest reliability is determined by:
A) administering the same measure to the same sample at two different points in time and calculating the correlation between an individual's performance on the two administrations.
B) administering the same measure to two different samples at two different points in time and calculating the correlation between an individual's performance at the two different times.
C) correlating the odd-numbered items of a measure with an individual's performance on the even-numbered items of that same measure.
D) correlating the odd-numbered items of a measure with an individual's performance on the even-numbered items of a different measure.
Unlock Deck
Unlock for access to all 139 flashcards in this deck.
Unlock Deck
k this deck
78
If two variables are positively correlated, then high scores on one variable would be associated with high scores on the other variable.
Unlock Deck
Unlock for access to all 139 flashcards in this deck.
Unlock Deck
k this deck
79
If two variables are positively correlated, then high scores on one variable would be associated with low scores on the other variable.
Unlock Deck
Unlock for access to all 139 flashcards in this deck.
Unlock Deck
k this deck
80
A coefficient alpha of _____ is considered a minimally acceptable level of reliability for measures that will be used to make decisions about individuals based on their scores on the measure.
A) 0.65
B) 0.80
C) 0.90
D) 1.00
A) 0.65
B) 0.80
C) 0.90
D) 1.00
Unlock Deck
Unlock for access to all 139 flashcards in this deck.
Unlock Deck
k this deck
Unlock Deck
Unlock for access to all 139 flashcards in this deck.


