Deck 5: Some Important Discrete Probability Distributions
Full screen (f)
Question
Question
Question
Question
Question
Question
Question
Question
Question
Question
Question
Question
Question
Question
Question
Question
Question
Question
Question
Question
Question
Question
Question
Question
Question
Question
Question
Question
Question
Question
Question
Question
Question
Question
Question
Question
Question
Question
Question
Question
Question
Question
Question
Question
 Two different designs on a new line of winter jackets for the coming winter are available for your manufacturing plants. Your profit (in thousands of dollars) will depend on the taste of the consumers when winter arrives. The probability of the three possible different tastes of the consumers and the corresponding profits are presented in the following table.
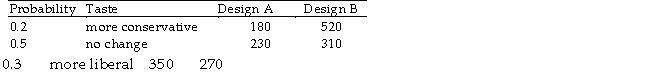
Referring to Table 5-8, if you decide to choose Design A for 90% of the production lines and Design B for the remaining production lines, what is the coefficient of variation of your investment?
Question
Question
Question
Question
Question
Question
TABLE 5-8
Two different designs on a new line of winter jackets for the coming winter are available for your manufacturing plants. Your profit (in thousands of dollars) will depend on the taste of the consumers when winter arrives. The probability of the three possible different tastes of the consumers and the corresponding profits are presented in the following table.
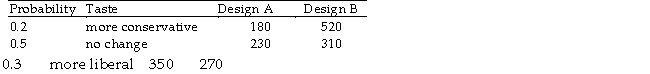
Referring to Table 5-8, what is the variance of your profit when Design A is chosen?
Two different designs on a new line of winter jackets for the coming winter are available for your manufacturing plants. Your profit (in thousands of dollars) will depend on the taste of the consumers when winter arrives. The probability of the three possible different tastes of the consumers and the corresponding profits are presented in the following table.
Referring to Table 5-8, what is the variance of your profit when Design A is chosen?
Question
Question
Question
Question
Question
Question
Question
Question
Question
Question
TABLE 5-7
There are two houses with almost identical characteristics available for investment in two different neighborhoods with drastically different demographic composition. The anticipated gain in value when the houses are sold in 10 years has the following probability distribution:
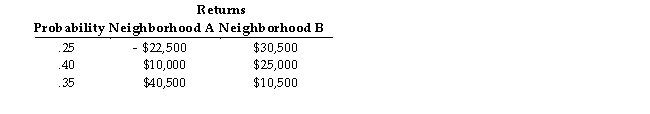
Referring to Table 5-7, if your investment preference is to maximize your expected return while exposing yourself to the minimal amount of risk, will you choose a portfolio that will consist of 10%, 30%, 50%, 70%, or 90% of your money on the house in neighborhood A and the remaining on the house in neighborhood B?
There are two houses with almost identical characteristics available for investment in two different neighborhoods with drastically different demographic composition. The anticipated gain in value when the houses are sold in 10 years has the following probability distribution:
Referring to Table 5-7, if your investment preference is to maximize your expected return while exposing yourself to the minimal amount of risk, will you choose a portfolio that will consist of 10%, 30%, 50%, 70%, or 90% of your money on the house in neighborhood A and the remaining on the house in neighborhood B?
Question
Question
Question
Question
TABLE 5-7
There are two houses with almost identical characteristics available for investment in two different neighborhoods with drastically different demographic composition. The anticipated gain in value when the houses are sold in 10 years has the following probability distribution:

Referring to Table 5-7, what is the covariance of the two houses?
There are two houses with almost identical characteristics available for investment in two different neighborhoods with drastically different demographic composition. The anticipated gain in value when the houses are sold in 10 years has the following probability distribution:
Referring to Table 5-7, what is the covariance of the two houses?
Question
Question
Question
Question
Question
Question
TABLE 5-7
There are two houses with almost identical characteristics available for investment in two different neighborhoods with drastically different demographic composition. The anticipated gain in value when the houses are sold in 10 years has the following probability distribution:
Referring to Table 5-7, what is the total standard deviation of value gain if you invest in both houses?
Question
Question
Question
TABLE 5-8
Two different designs on a new line of winter jackets for the coming winter are available for your manufacturing plants. Your profit (in thousands of dollars) will depend on the taste of the consumers when winter arrives. The probability of the three possible different tastes of the consumers and the corresponding profits are presented in the following table.
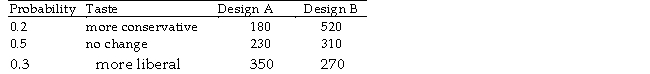
Referring to Table 5-8, what is your expected profit when Design B is chosen?
Two different designs on a new line of winter jackets for the coming winter are available for your manufacturing plants. Your profit (in thousands of dollars) will depend on the taste of the consumers when winter arrives. The probability of the three possible different tastes of the consumers and the corresponding profits are presented in the following table.
Referring to Table 5-8, what is your expected profit when Design B is chosen?
Question
Question
Question
Question
Question
Question
Question

Unlock Deck
Sign up to unlock the cards in this deck!
Unlock Deck
Unlock Deck
1/174
Play
Full screen (f)
Deck 5: Some Important Discrete Probability Distributions
1
A company has 125 personal computers. The probability that any one of them will require repair on a given day is 0.025. To find the probability that exactly 20 of the computers will require repair on a given day, one will use what type of probability distribution?
A) hypergeometric distribution
B) Poisson distribution
C) binomial distribution
D) none of the above
A) hypergeometric distribution
B) Poisson distribution
C) binomial distribution
D) none of the above
C
2
If n = 10 and p = 0.70, then the mean of the binomial distribution is
A) 14.29.
B) 7.00.
C) 0.07.
D) 1.45.
A) 14.29.
B) 7.00.
C) 0.07.
D) 1.45.
B
3
The local police department must write, on average, 5 tickets a day to keep department revenues at budgeted levels. Suppose the number of tickets written per day follows a Poisson distribution with a mean of 6.5 tickets per day. Interpret the value of the mean.
A) Half of the days have less than 6.5 tickets written and half of the days have more than 6.5 tickets written.
B) The number of tickets that is written most often is 6.5 tickets per day.
C) If we sampled all days, the arithmetic average or expected number of tickets written would be 6.5 tickets per day.
D) The mean has no interpretation since 0.5 ticket can never be written.
C
4
A lab orders 100 rats a week for each of the 52 weeks in the year for experiments that the lab conducts. Suppose the mean cost of rats used in lab experiments turned out to be $13.00 per week. Interpret this value.
A) The median cost for the distribution of rat costs is $13.00.
B) The expected or average cost for all weekly rat purchases is $13.00.
C) The rat cost that occurs more often than any other is $13.00.
D) Most of the weeks resulted in rat costs of $13.00.
A) The median cost for the distribution of rat costs is $13.00.
B) The expected or average cost for all weekly rat purchases is $13.00.
C) The rat cost that occurs more often than any other is $13.00.
D) Most of the weeks resulted in rat costs of $13.00.
Unlock Deck
Unlock for access to all 174 flashcards in this deck.
Unlock Deck
k this deck
5
A financial analyst is presented with information on the past records of 60 start-up companies and told that in fact only 3 of them have managed to become highly successful. He selected 3 companies from this group as the candidates for success. To analyze his ability to spot the companies that will eventually become highly successful, he will use what type of probability distribution?
A) Poisson distribution
B) binomial distribution
C) hypergeometric distribution
D) none of the above
A) Poisson distribution
B) binomial distribution
C) hypergeometric distribution
D) none of the above
Unlock Deck
Unlock for access to all 174 flashcards in this deck.
Unlock Deck
k this deck
6
The connotation "expected value" or "expected gain" from playing roulette at a casino means
A) the amount you expect to "gain" on a single play.
B) the amount you need to "break even" over many plays.
C) the amount you expect to "gain" in the long run over many plays.
D) the amount you should expect to gain if you are lucky.
A) the amount you expect to "gain" on a single play.
B) the amount you need to "break even" over many plays.
C) the amount you expect to "gain" in the long run over many plays.
D) the amount you should expect to gain if you are lucky.
Unlock Deck
Unlock for access to all 174 flashcards in this deck.
Unlock Deck
k this deck
7
A stock analyst was provided with a list of 25 stocks. He was expected to pick 3 stocks from the list whose prices are expected to rise by more than 20% after 30 days. In reality, the prices of only 5 stocks would rise by more than 20% after 30 days. If he randomly selected 3 stocks from the list, he would use what type of probability distribution to compute the probability that all of the chosen stocks would appreciate more than 20% after 30 days?
A) binomial distribution
B) hypergeometric distribution
C) Poisson distribution
D) none of the above
A) binomial distribution
B) hypergeometric distribution
C) Poisson distribution
D) none of the above
Unlock Deck
Unlock for access to all 174 flashcards in this deck.
Unlock Deck
k this deck
8
Which of the following about the binomial distribution is not a true statement?
A) Each outcome is independent of the other.
B) Each outcome may be classified as either "event of interest" or "not event of interest."
C) The random variable of interest is continuous.
D) The probability of event of interest must be constant from trial to trial.
A) Each outcome is independent of the other.
B) Each outcome may be classified as either "event of interest" or "not event of interest."
C) The random variable of interest is continuous.
D) The probability of event of interest must be constant from trial to trial.
Unlock Deck
Unlock for access to all 174 flashcards in this deck.
Unlock Deck
k this deck
9
If n = 10 and p = 0.70, then the standard deviation of the binomial distribution is
A) 1.45.
B) 7.00.
C) 0.07.
D) 14.29.
A) 1.45.
B) 7.00.
C) 0.07.
D) 14.29.
Unlock Deck
Unlock for access to all 174 flashcards in this deck.
Unlock Deck
k this deck
10
What type of probability distribution will most likely be used to analyze the number of chocolate chip parts per cookie in the following problem?
The quality control manager of Marilyn's Cookies is inspecting a batch of chocolate chip cookies. When the production process is in control, the average number of chocolate chip parts per cookie is
1). The manager is interested in analyzing the probability that any particular cookie being inspected has fewer than 5.0 chip parts.
A) Poisson distribution
B) hypergeometric distribution
C) binomial distribution
D) none of the above
Unlock Deck
Unlock for access to all 174 flashcards in this deck.
Unlock Deck
k this deck
11
What type of probability distribution will the consulting firm most likely employ to analyze the insurance claims in the following problem?
An insurance company has called a consulting firm to determine if the company has an unusually high number of false insurance claims. It is known that the industry proportion for false claims is 3%. The consulting firm has decided to randomly and independently sample 100 of the company's insurance claims. They believe the number of these 100 that are false will yield the information the company desires.
A) binomial distribution
B) hypergeometric distribution
C) Poisson distribution
D) none of the above
Unlock Deck
Unlock for access to all 174 flashcards in this deck.
Unlock Deck
k this deck
12
On the average, 1.8 customers per minute arrive at any one of the checkout counters of a grocery store. What type of probability distribution can be used to find out the probability that there will be no customer arriving at a checkout counter?
A) Poisson distribution
B) hypergeometric distribution
C) binomial distribution
D) none of the above
A) Poisson distribution
B) hypergeometric distribution
C) binomial distribution
D) none of the above
Unlock Deck
Unlock for access to all 174 flashcards in this deck.
Unlock Deck
k this deck
13
A professor receives, on average, 24.7 e-mails from students the day before the midterm exam. To compute the probability of receiving at least 10 e-mails on such a day, he will use what type of probability distribution?
A) Poisson distribution
B) hypergeometric distribution
C) binomial distribution
D) none of the above
A) Poisson distribution
B) hypergeometric distribution
C) binomial distribution
D) none of the above
Unlock Deck
Unlock for access to all 174 flashcards in this deck.
Unlock Deck
k this deck
14
The portfolio expected return of two investments
A) will be higher when the covariance is zero.
B) does not depend on the covariance.
C) will be higher when the covariance is negative.
D) will be higher when the covariance is positive.
A) will be higher when the covariance is zero.
B) does not depend on the covariance.
C) will be higher when the covariance is negative.
D) will be higher when the covariance is positive.
Unlock Deck
Unlock for access to all 174 flashcards in this deck.
Unlock Deck
k this deck
15
A multiple-choice test has 30 questions. There are 4 choices for each question. A student who has not studied for the test decides to answer all questions randomly. What type of probability distribution can be used to figure out his chance of getting at least 20 questions right?
A) hypergeometric distribution
B) binomial distribution
C) Poisson distribution
D) none of the above
A) hypergeometric distribution
B) binomial distribution
C) Poisson distribution
D) none of the above
Unlock Deck
Unlock for access to all 174 flashcards in this deck.
Unlock Deck
k this deck
16
If the outcomes of a random variable follow a Poisson distribution, then their
A) mean equals the standard deviation.
B) median equals the variance.
C) median equals the standard deviation.
D) mean equals the variance.
A) mean equals the standard deviation.
B) median equals the variance.
C) median equals the standard deviation.
D) mean equals the variance.
Unlock Deck
Unlock for access to all 174 flashcards in this deck.
Unlock Deck
k this deck
17
What type of probability distribution will most likely be used to analyze warranty repair needs on new cars in the following problem? The service manager for a new automobile dealership reviewed dealership records of the past 20 sales of new cars to determine the number of warranty repairs he will be called on to perform in the next 90 days. Corporate reports indicate that the probability any one of their new cars needs a warranty repair in the first 90 days is 0.05. The manager assumes that calls for warranty repair are independent of one another and is interested in predicting the number of warranty repairs he will be called on to perform in the next 90 days for this batch of 20 new cars sold.
A) Poisson distribution
B) binomial distribution
C) hypergeometric distribution
D) none of the above
A) Poisson distribution
B) binomial distribution
C) hypergeometric distribution
D) none of the above
Unlock Deck
Unlock for access to all 174 flashcards in this deck.
Unlock Deck
k this deck
18
The covariance
A) must be less than +1.
B) can be positive or negative.
C) must be between -1 and +1.
D) must be positive.
A) must be less than +1.
B) can be positive or negative.
C) must be between -1 and +1.
D) must be positive.
Unlock Deck
Unlock for access to all 174 flashcards in this deck.
Unlock Deck
k this deck
19
Whenever p = 0.5, the binomial distribution will
A) be right-skewed.
B) always be symmetric.
C) be left-skewed.
D) be symmetric only if n is large.
A) be right-skewed.
B) always be symmetric.
C) be left-skewed.
D) be symmetric only if n is large.
Unlock Deck
Unlock for access to all 174 flashcards in this deck.
Unlock Deck
k this deck
20
What type of probability distribution will most likely be used to analyze the number of cars with defective radios in the following problem?
From an inventory of 48 new cars being shipped to local dealerships, corporate reports indicate that 12 have defective radios installed. The sales manager of one dealership wants to predict the probability out of the 8 new cars it just received that, when each is tested, no more than 2 of the cars have defective radios.
A) Poisson distribution
B) binomial distribution
C) hypergeometric distribution
D) none of the above
Unlock Deck
Unlock for access to all 174 flashcards in this deck.
Unlock Deck
k this deck
21
TABLE 5-7
There are two houses with almost identical characteristics available for investment in two different neighborhoods with drastically different demographic composition. The anticipated gain in value when the houses are sold in 10 years has the following probability distribution:
-Referring to Table 5-7, if you can invest 70% of your money on the house in neighborhood A and the remaining on the house in neighborhood B, what is the portfolio expected return of your investment?
Unlock Deck
Unlock for access to all 174 flashcards in this deck.
Unlock Deck
k this deck
22
Thirty-six of the staff of 80 teachers at a local intermediate school are certified in Cardio-Pulmonary Resuscitation (CPR). In 180 days of school, about how many days can we expect that the teacher on bus duty will likely be certified in CPR?
A) 81 days
B) 65 days
C) 45 days
D) 5 days
A) 81 days
B) 65 days
C) 45 days
D) 5 days
Unlock Deck
Unlock for access to all 174 flashcards in this deck.
Unlock Deck
k this deck
23
In a binomial distribution
A) the probability of event of interest n is stable from trial to trial.
B) the number of trials n must be at least 30.
C) the results of one trial are dependent on the results of the other trials.
D) the random variable X is continuous.
A) the probability of event of interest n is stable from trial to trial.
B) the number of trials n must be at least 30.
C) the results of one trial are dependent on the results of the other trials.
D) the random variable X is continuous.
Unlock Deck
Unlock for access to all 174 flashcards in this deck.
Unlock Deck
k this deck
24
Whenever p = 0.1 and n is small, the binomial distribution will be
A) right-skewed.
B) symmetric.
C) left-skewed.
D) none of the above
A) right-skewed.
B) symmetric.
C) left-skewed.
D) none of the above
Unlock Deck
Unlock for access to all 174 flashcards in this deck.
Unlock Deck
k this deck
25
TABLE 5-5
From an inventory of 48 new cars being shipped to local dealerships, corporate reports indicate that 12 have defective radios installed.
Referring to Table 5-5, what is the probability out of the 8 new cars it just received that, when each is tested, exactly half of the cars have defective radios?
From an inventory of 48 new cars being shipped to local dealerships, corporate reports indicate that 12 have defective radios installed.
Referring to Table 5-5, what is the probability out of the 8 new cars it just received that, when each is tested, exactly half of the cars have defective radios?
Unlock Deck
Unlock for access to all 174 flashcards in this deck.
Unlock Deck
k this deck
26
TABLE 5-8
Two different designs on a new line of winter jackets for the coming winter are available for your manufacturing plants. Your profit (in thousands of dollars) will depend on the taste of the consumers when winter arrives. The probability of the three possible different tastes of the consumers and the corresponding profits are presented in the following table.
-Referring to Table 5-8, if your investment preference is to minimize the amount of risk that you have to take and do not care at all about the expected profit, will you choose a production mix that will consist of 10%, 30%, 50%, 70%, or 90% of your production lines for Design A and the remaining for Design B?
Unlock Deck
Unlock for access to all 174 flashcards in this deck.
Unlock Deck
k this deck
27
The number of power outages at a nuclear power plant has a Poisson distribution with a mean of 6 outages per year. The probability that there will be at least 1 power outage in a year is ______.
Unlock Deck
Unlock for access to all 174 flashcards in this deck.
Unlock Deck
k this deck
28
A lab orders 100 rats a week for each of the 52 weeks in the year for experiments that the lab conducts. Prices for 100 rats follow the following distribution:
How much should the lab budget for next year's rat orders be, assuming this distribution does not change?
A) $780
B) $520
C) $637
D) $650
How much should the lab budget for next year's rat orders be, assuming this distribution does not change?
A) $780
B) $520
C) $637
D) $650
Unlock Deck
Unlock for access to all 174 flashcards in this deck.
Unlock Deck
k this deck
29
TABLE 5-7
There are two houses with almost identical characteristics available for investment in two different neighborhoods with drastically different demographic composition. The anticipated gain in value when the houses are sold in 10 years has the following probability distribution:
-Referring to Table 5-7, what is the variance of the gain in value for the house in neighborhood B?
Unlock Deck
Unlock for access to all 174 flashcards in this deck.
Unlock Deck
k this deck
30
The probability that a particular type of smoke alarm will function properly and sound an alarm in the presence of smoke is
0.8. You have 2 such alarms in your home and they operate independently.
-Referring to Table 5-1, the probability that neither sound an alarm in the presence of smoke is _______.
0.8. You have 2 such alarms in your home and they operate independently.
-Referring to Table 5-1, the probability that neither sound an alarm in the presence of smoke is _______.
Unlock Deck
Unlock for access to all 174 flashcards in this deck.
Unlock Deck
k this deck
31
TABLE 5-8
Two different designs on a new line of winter jackets for the coming winter are available for your manufacturing plants. Your profit (in thousands of dollars) will depend on the taste of the consumers when winter arrives. The probability of the three possible different tastes of the consumers and the corresponding profits are presented in the following table.
-Referring to Table 5-8 if you decide to choose Design A for 70% of the production lines and Design B for the remaining production lines, what is the risk of your investment?
Unlock Deck
Unlock for access to all 174 flashcards in this deck.
Unlock Deck
k this deck
32
A campus program evenly enrolls undergraduate and graduate students. If a random sample of 4 students is selected from the program to be interviewed about the introduction of a new fast food outlet on the ground floor of the campus building, what is the probability that all 4 students selected are undergraduate students?
A) 1.00
B) 0.16
C) 0.0625
D) 0.0256
A) 1.00
B) 0.16
C) 0.0625
D) 0.0256
Unlock Deck
Unlock for access to all 174 flashcards in this deck.
Unlock Deck
k this deck
33
A probability distribution is an equation that
A) assigns a value to the center of the sample space.
B) measures outcomes and assigns values of X to the simple events.
C) associates a particular probability of occurrence with each outcome in the sample space.
D) assigns a value to the variability in the sample space.
A) assigns a value to the center of the sample space.
B) measures outcomes and assigns values of X to the simple events.
C) associates a particular probability of occurrence with each outcome in the sample space.
D) assigns a value to the variability in the sample space.
Unlock Deck
Unlock for access to all 174 flashcards in this deck.
Unlock Deck
k this deck
34
TABLE 5-7
There are two houses with almost identical characteristics available for investment in two different neighborhoods with drastically different demographic composition. The anticipated gain in value when the houses are sold in 10 years has the following probability distribution:
-Referring to Table 5-7, if you can invest 90% of your money on the house in neighborhood A and the remaining on the house in neighborhood B, what is the portfolio expected return of your investment?
Unlock Deck
Unlock for access to all 174 flashcards in this deck.
Unlock Deck
k this deck
35
The quality control manager of Marilyn's Cookies is inspecting a batch of chocolate chip cookies. When the production process is in control, the average number of chocolate chip parts per cookie is 6.0.
-Referring to Table 5-6, what is the probability that any particular cookie being inspected has at least 6.0 chip parts.
Unlock Deck
Unlock for access to all 174 flashcards in this deck.
Unlock Deck
k this deck
36
Two different designs on a new line of winter jackets for the coming winter are available for your manufacturing plants. Your profit (in thousands of dollars) will depend on the taste of the consumers when winter arrives. The probability of the three possible different tastes of the consumers and the corresponding profits are presented in the following table.
-Referring to Table 5-8, if you decide to choose Design A for half of the production lines and Design B for the other half, what is the risk of your investment?
Unlock Deck
Unlock for access to all 174 flashcards in this deck.
Unlock Deck
k this deck
37
A national trend predicts that women will account for half of all business travelers in the next 3 years. To attract these women business travelers, hotels are providing more amenities that women particularly like. A recent survey of American hotels found that 70% offer hairdryers in the bathrooms. Consider a random and independent sample of 20 hotels. Find the probability all of the hotels in the sample offered hairdryers in the bathrooms.
Unlock Deck
Unlock for access to all 174 flashcards in this deck.
Unlock Deck
k this deck
38
Two different designs on a new line of winter jackets for the coming winter are available for your manufacturing plants. Your profit (in thousands of dollars) will depend on the taste of the consumers when winter arrives. The probability of the three possible different tastes of the consumers and the corresponding profits are presented in the following table.
-Referring to Table 5-8, if your investment preference is to maximize your expected profit and not worry at all about the risk that you have to take, will you choose a production mix that will consist of 10%, 30%, 50%, 70%, or 90% of your production lines for Design A and the remaining for Design B?
Unlock Deck
Unlock for access to all 174 flashcards in this deck.
Unlock Deck
k this deck
39
A national trend predicts that women will account for half of all business travelers in the next 3 years. To attract these women business travelers, hotels are providing more amenities that women particularly like. A recent survey of American hotels found that 70% offer hairdryers in the bathrooms. Consider a random and independent sample of 20 hotels. Find the probability that more than 7 but less than 13 of the hotels in the sample offered hairdryers in the bathrooms.
Unlock Deck
Unlock for access to all 174 flashcards in this deck.
Unlock Deck
k this deck
40
TABLE 5-7
There are two houses with almost identical characteristics available for investment in two different neighborhoods with drastically different demographic composition. The anticipated gain in value when the houses are sold in 10 years has the following probability distribution:
-Referring to Table 5-7, if you can invest 30% of your money on the house in neighborhood A and the remaining on the house in neighborhood B, what is the portfolio risk of your investment?
Unlock Deck
Unlock for access to all 174 flashcards in this deck.
Unlock Deck
k this deck
41
In a game called Taxation and Evasion, a player rolls a pair of dice. If on any turn the sum is 7, 11, or 12, the player gets audited. Otherwise, she avoids taxes. Suppose a player takes 5 turns at rolling the dice. The probability that she gets audited once is _____.
Unlock Deck
Unlock for access to all 174 flashcards in this deck.
Unlock Deck
k this deck
42
TABLE 5-8
Two different designs on a new line of winter jackets for the coming winter are available for your manufacturing plants. Your profit (in thousands of dollars) will depend on the taste of the consumers when winter arrives. The probability of the three possible different tastes of the consumers and the corresponding profits are presented in the following table.
-Referring to Table 5-8, what is the total standard deviation of the profit if you increase the shift of your production lines and choose to produce both designs?
Unlock Deck
Unlock for access to all 174 flashcards in this deck.
Unlock Deck
k this deck
43
The local police department must write, on average, 5 tickets a day to keep department revenues at budgeted levels. Suppose the number of tickets written per day follows a Poisson distribution with a mean of 6.4 tickets per day. Find the probability that exactly 6 tickets are written on a randomly selected day from this population.
Unlock Deck
Unlock for access to all 174 flashcards in this deck.
Unlock Deck
k this deck
44
Two different designs on a new line of winter jackets for the coming winter are available for your manufacturing plants. Your profit (in thousands of dollars) will depend on the taste of the consumers when winter arrives. The probability of the three possible different tastes of the consumers and the corresponding profits are presented in the following table.Referring to Table 5-8, if you decide to choose Design A for 90% of the production lines and Design B for the remaining production lines, what is the coefficient of variation of your investment?
Unlock Deck
Unlock for access to all 174 flashcards in this deck.
Unlock Deck
k this deck
45
TABLE 5-3
The following table contains the probability distribution for X = the number of retransmissions necessary to successfully transmit a 1024K data package through a double satellite media.
-Referring to Table 5-3, the variance for the number of retransmissions is____ .
The following table contains the probability distribution for X = the number of retransmissions necessary to successfully transmit a 1024K data package through a double satellite media.
-Referring to Table 5-3, the variance for the number of retransmissions is____ .
Unlock Deck
Unlock for access to all 174 flashcards in this deck.
Unlock Deck
k this deck
46
The Department of Commerce in a particular state has determined that the number of small businesses that declare bankruptcy per month is approximately a Poisson distribution with a mean of 6.4. Find the probability that more than 3 bankruptcies occur next month.
Unlock Deck
Unlock for access to all 174 flashcards in this deck.
Unlock Deck
k this deck
47
TABLE 5-7
There are two houses with almost identical characteristics available for investment in two different neighborhoods with drastically different demographic composition. The anticipated gain in value when the houses are sold in 10 years has the following probability distribution:
-Referring to Table 5-7, if you can invest 30% of your money on the house in neighborhood A and the remaining on the house in neighborhood B, what is the portfolio expected return of your investment?
Unlock Deck
Unlock for access to all 174 flashcards in this deck.
Unlock Deck
k this deck
48
If X has a binomial distribution with n = 5 and p = 0.1, then P(X = 2) = _____ .
Unlock Deck
Unlock for access to all 174 flashcards in this deck.
Unlock Deck
k this deck
49
TABLE 5-6
The quality control manager of Marilyn's Cookies is inspecting a batch of chocolate chip cookies. When the production process is in control, the average number of chocolate chip parts per cookie is 6.0.
-Referring to Table 5-6, what is the probability that any particular cookie being inspected has fewer than 5.0 chip parts.
Unlock Deck
Unlock for access to all 174 flashcards in this deck.
Unlock Deck
k this deck
50
TABLE 5-8
Two different designs on a new line of winter jackets for the coming winter are available for your manufacturing plants. Your profit (in thousands of dollars) will depend on the taste of the consumers when winter arrives. The probability of the three possible different tastes of the consumers and the corresponding profits are presented in the following table.
Referring to Table 5-8, what is the variance of your profit when Design A is chosen?
Unlock Deck
Unlock for access to all 174 flashcards in this deck.
Unlock Deck
k this deck
51
Referring to Table 5-8, what is your expected profit when Design A is chosen?
Unlock Deck
Unlock for access to all 174 flashcards in this deck.
Unlock Deck
k this deck
52
There are two houses with almost identical characteristics available for investment in two different neighborhoods with drastically different demographic composition. The anticipated gain in value when the houses are sold in 10 years has the following probability distribution:
-Referring to Table 5-7, if you can invest 10% of your money on the house in neighborhood A and the remaining on the house in neighborhood B, what is the portfolio risk of your investment?
-Referring to Table 5-7, if you can invest 10% of your money on the house in neighborhood A and the remaining on the house in neighborhood B, what is the portfolio risk of your investment?
Unlock Deck
Unlock for access to all 174 flashcards in this deck.
Unlock Deck
k this deck
53
TABLE 5-8
Two different designs on a new line of winter jackets for the coming winter are available for your manufacturing plants. Your profit (in thousands of dollars) will depend on the taste of the consumers when winter arrives. The probability of the three possible different tastes of the consumers and the corresponding profits are presented in the following table.
-Referring to Table 5-8, what is the variance of your profit when Design B is chosen?
Unlock Deck
Unlock for access to all 174 flashcards in this deck.
Unlock Deck
k this deck
54
There are two houses with almost identical characteristics available for investment in two different neighborhoods with drastically different demographic composition. The anticipated gain in value when the houses are sold in 10 years has the following probability distribution:
-Referring to Table 5-7, what is the standard deviation of the value gain for the house in neighborhood A?
-Referring to Table 5-7, what is the standard deviation of the value gain for the house in neighborhood A?
Unlock Deck
Unlock for access to all 174 flashcards in this deck.
Unlock Deck
k this deck
55
The number of 911 calls in Butte, Montana, has a Poisson distribution with a mean of 10 calls a day. The probability of 2 or more 911 calls in a day is_____ .
Unlock Deck
Unlock for access to all 174 flashcards in this deck.
Unlock Deck
k this deck
56
A debate team of 4 members for a high school will be chosen randomly from a potential group of 15 students. Ten of the 15 students have no prior competition experience while the others have some degree of experience. What is the probability that at least 1 of the members chosen for the team have some prior competition experience?
Unlock Deck
Unlock for access to all 174 flashcards in this deck.
Unlock Deck
k this deck
57
TABLE 5-5
From an inventory of 48 new cars being shipped to local dealerships, corporate reports indicate that 12 have defective radios installed.
Referring to Table 5-5, what is the probability out of the 8 new cars it just received that, when each is tested, no more than half of the cars have non-defective radios?
Unlock Deck
Unlock for access to all 174 flashcards in this deck.
Unlock Deck
k this deck
58
If X has a binomial distribution with n = 4 and p = 0.3, then P(X > 1) = _____ .
Unlock Deck
Unlock for access to all 174 flashcards in this deck.
Unlock Deck
k this deck
59
TABLE 5-8
Two different designs on a new line of winter jackets for the coming winter are available for your manufacturing plants. Your profit (in thousands of dollars) will depend on the taste of the consumers when winter arrives. The probability of the three possible different tastes of the consumers and the corresponding profits are presented in the following table.
-Referring to Table 5-8, if you decide to choose Design A for half of the production lines and Design B for the other half, what is the coefficient of variation of your investment?
Unlock Deck
Unlock for access to all 174 flashcards in this deck.
Unlock Deck
k this deck
60
TABLE 5-7
There are two houses with almost identical characteristics available for investment in two different neighborhoods with drastically different demographic composition. The anticipated gain in value when the houses are sold in 10 years has the following probability distribution:
Referring to Table 5-7, if your investment preference is to maximize your expected return while exposing yourself to the minimal amount of risk, will you choose a portfolio that will consist of 10%, 30%, 50%, 70%, or 90% of your money on the house in neighborhood A and the remaining on the house in neighborhood B?
Unlock Deck
Unlock for access to all 174 flashcards in this deck.
Unlock Deck
k this deck
61
A certain type of new business succeeds 60% of the time. Suppose that 3 such businesses open (where they do not compete with each other, so it is reasonable to believe that their relative successes would be independent).
-Referring to Table 5-2, the probability that all 3 businesses fail is ____.
-Referring to Table 5-2, the probability that all 3 businesses fail is ____.
Unlock Deck
Unlock for access to all 174 flashcards in this deck.
Unlock Deck
k this deck
62
Suppose that past history shows that 60% of college students prefer Brand C cola. A sample of 5 students is to be selected. The probability that exactly 4 prefer brand C is_____
Unlock Deck
Unlock for access to all 174 flashcards in this deck.
Unlock Deck
k this deck
63
TABLE 5-2
A certain type of new business succeeds 60% of the time. Suppose that 3 such businesses open (where they do not compete with each other, so it is reasonable to believe that their relative successes would be independent).
-Referring to Table 5-2, the probability that all 3 businesses succeed is ____ .
Unlock Deck
Unlock for access to all 174 flashcards in this deck.
Unlock Deck
k this deck
64
TABLE 5-7
There are two houses with almost identical characteristics available for investment in two different neighborhoods with drastically different demographic composition. The anticipated gain in value when the houses are sold in 10 years has the following probability distribution:
Referring to Table 5-7, what is the covariance of the two houses?
Unlock Deck
Unlock for access to all 174 flashcards in this deck.
Unlock Deck
k this deck
65
TABLE 5-4
The following table contains the probability distribution for X = the number of traffic accidents reported in a day in Corvallis, Oregon.
-Referring to Table 5-4, the mean or expected value of the number of accidents is____ .
The following table contains the probability distribution for X = the number of traffic accidents reported in a day in Corvallis, Oregon.
-Referring to Table 5-4, the mean or expected value of the number of accidents is____ .
Unlock Deck
Unlock for access to all 174 flashcards in this deck.
Unlock Deck
k this deck
66
The number of power outages at a nuclear power plant has a Poisson distribution with a mean of 6 outages per year. The variance of the number of power outages is_____ .
Unlock Deck
Unlock for access to all 174 flashcards in this deck.
Unlock Deck
k this deck
67
From an inventory of 48 new cars being shipped to local dealerships, corporate reports indicate that 12 have defective radios installed.
-Referring to Table 5-5, what is the probability out of the 8 new cars it just received that, when each is tested, none of the cars have defective radios?
-Referring to Table 5-5, what is the probability out of the 8 new cars it just received that, when each is tested, none of the cars have defective radios?
Unlock Deck
Unlock for access to all 174 flashcards in this deck.
Unlock Deck
k this deck
68
TABLE 5-8
Two different designs on a new line of winter jackets for the coming winter are available for your manufacturing plants. Your profit (in thousands of dollars) will depend on the taste of the consumers when winter arrives. The probability of the three possible different tastes of the consumers and the corresponding profits are presented in the following table.
-Referring to Table 5-8, if your investment preference is to maximize your expected profit while exposing yourself to the minimal amount of risk, will you choose a production mix that will consist of 10%, 30%, 50%, 70%, or 90% of your production lines for Design A and the remaining for Design B?
Unlock Deck
Unlock for access to all 174 flashcards in this deck.
Unlock Deck
k this deck
69
There are two houses with almost identical characteristics available for investment in two different neighborhoods with drastically different demographic composition. The anticipated gain in value when the houses are sold in 10 years has the following probability distribution:
-Referring to Table 5-7, if your investment preference is to maximize your expected return and not worry at all about the risk that you have to take, will you choose a portfolio that will consist of 10%, 30%, 50%, 70%, or 90% of your money on the house in neighborhood A and the remaining on the house in neighborhood B?
-Referring to Table 5-7, if your investment preference is to maximize your expected return and not worry at all about the risk that you have to take, will you choose a portfolio that will consist of 10%, 30%, 50%, 70%, or 90% of your money on the house in neighborhood A and the remaining on the house in neighborhood B?
Unlock Deck
Unlock for access to all 174 flashcards in this deck.
Unlock Deck
k this deck
70
TABLE 5-7
There are two houses with almost identical characteristics available for investment in two different neighborhoods with drastically different demographic composition. The anticipated gain in value when the houses are sold in 10 years has the following probability distribution:
Referring to Table 5-7, what is the total standard deviation of value gain if you invest in both houses?
Unlock Deck
Unlock for access to all 174 flashcards in this deck.
Unlock Deck
k this deck
71
TABLE 5-8
Two different designs on a new line of winter jackets for the coming winter are available for your manufacturing plants. Your profit (in thousands of dollars) will depend on the taste of the consumers when winter arrives. The probability of the three possible different tastes of the consumers and the corresponding profits are presented in the following table.
-Referring to Table 5-8, if you decide to choose Design A for 30% of the production lines and Design B for the remaining production lines, what is the coefficient of variation of your investment?
Unlock Deck
Unlock for access to all 174 flashcards in this deck.
Unlock Deck
k this deck
72
TABLE 5-7
There are two houses with almost identical characteristics available for investment in two different neighborhoods with drastically different demographic composition. The anticipated gain in value when the houses are sold in 10 years has the following probability distribution:
-Referring to Table 5-7, if you can invest 10% of your money on the house in neighborhood A and the remaining on the house in neighborhood B, what is the portfolio expected return of your investment?
Unlock Deck
Unlock for access to all 174 flashcards in this deck.
Unlock Deck
k this deck
73
TABLE 5-8
Two different designs on a new line of winter jackets for the coming winter are available for your manufacturing plants. Your profit (in thousands of dollars) will depend on the taste of the consumers when winter arrives. The probability of the three possible different tastes of the consumers and the corresponding profits are presented in the following table.
Referring to Table 5-8, what is your expected profit when Design B is chosen?
Unlock Deck
Unlock for access to all 174 flashcards in this deck.
Unlock Deck
k this deck
74
The following table contains the probability distribution for X = the number of traffic accidents reported in a day in Corvallis, Oregon.
-Referring to Table 5-4, the probability of 3 accidents is ____.
-Referring to Table 5-4, the probability of 3 accidents is ____.
Unlock Deck
Unlock for access to all 174 flashcards in this deck.
Unlock Deck
k this deck
75
Two different designs on a new line of winter jackets for the coming winter are available for your manufacturing plants. Your profit (in thousands of dollars) will depend on the taste of the consumers when winter arrives. The probability of the three possible different tastes of the consumers and the corresponding profits are presented in the following table.
-Referring to Table 5-8, what is the expected profit if you increase the shift of your production lines and choose to produce both designs?
-Referring to Table 5-8, what is the expected profit if you increase the shift of your production lines and choose to produce both designs?
Unlock Deck
Unlock for access to all 174 flashcards in this deck.
Unlock Deck
k this deck
76
There are two houses with almost identical characteristics available for investment in two different neighborhoods with drastically different demographic composition. The anticipated gain in value when the houses are sold in 10 years has the following probability distribution:
-Referring to Table 5-7, what is the expected value gain for the house in neighborhood B?
-Referring to Table 5-7, what is the expected value gain for the house in neighborhood B?
Unlock Deck
Unlock for access to all 174 flashcards in this deck.
Unlock Deck
k this deck
77
The number of 911 calls in Butte, Montana, has a Poisson distribution with a mean of 10 calls a day. The probability of seven 911 calls in a day is ____ .
Unlock Deck
Unlock for access to all 174 flashcards in this deck.
Unlock Deck
k this deck
78
Suppose that past history shows that 60% of college students prefer Brand C cola. A sample of 5 students is to be selected. The probability that more than 3 prefer brand C is______
Unlock Deck
Unlock for access to all 174 flashcards in this deck.
Unlock Deck
k this deck
79
TABLE 5-7
There are two houses with almost identical characteristics available for investment in two different neighborhoods with drastically different demographic composition. The anticipated gain in value when the houses are sold in 10 years has the following probability distribution:
-Referring to Table 5-7, if you can invest 90% of your money on the house in neighborhood A and the remaining on the house in neighborhood B, what is the portfolio risk of your investment?
Unlock Deck
Unlock for access to all 174 flashcards in this deck.
Unlock Deck
k this deck
80
In a game called Taxation and Evasion, a player rolls a pair of dice. If on any turn the sum is 7, 11, or 12, the player gets audited. Otherwise, she avoids taxes. Suppose a player takes 5 turns at rolling the dice. The probability that she gets audited at least once is ____.
Unlock Deck
Unlock for access to all 174 flashcards in this deck.
Unlock Deck
k this deck
Unlock Deck
Unlock for access to all 174 flashcards in this deck.


