Deck 12: Chi-Square Tests and Nonparametric Tests
Full screen (f)
Question
Question
Question
Question
Question
Question
Question
Question
Question
Question
Question
Question
Question
Question
Question
Question
Question
Question
Question
Question
Question
Question
Question
Question
Question
Question
Question
Question
Question
Question
Question
Question
Question
Question
Question
Question
Question
Question
Question
Question
Question
Question
Question
Question
Question
Question
Question
Question
Question
Question
Question
Question
Question
Question
Question
Question
Question
Question
Question
Question
Question
TABLE 12-13
According to an article in Marketing News, fewer checks are being written at grocery store checkout stands than in the past. To determine whether there is a difference in the proportion of shoppers who pay by check among three consecutive years at a 0.05 level of significance, the results of a survey of 500 shoppers in three consecutive years are obtained and presented below.

Referring to Table 12-13, what is the p-value of the test statistic?
According to an article in Marketing News, fewer checks are being written at grocery store checkout stands than in the past. To determine whether there is a difference in the proportion of shoppers who pay by check among three consecutive years at a 0.05 level of significance, the results of a survey of 500 shoppers in three consecutive years are obtained and presented below.
Referring to Table 12-13, what is the p-value of the test statistic?
Question
Question
Question
Question
Question
Question
Question
Question
Question
Question
Question
Question
Question
TABLE 12-16
A perfume manufacturer is trying to choose between 2 magazine advertising layouts. An expensive layout would include a small package of the perfume. A cheaper layout would include a "scratch-and-sniff" sample of the product. The manufacturer would use the more expensive layout only if there is evidence that it would lead to a higher approval rate. The manufacturer presents both layouts to 5 groups and determines the approval rating from each group on both layouts. The data are given below. Use this to test whether the median difference in approval rating is different from zero in favor of the more expensive layout with a level of significance of 0.05.
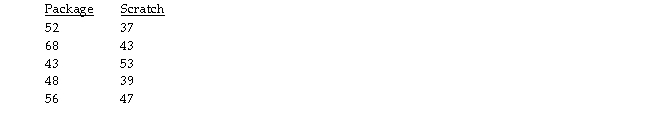
Referring to Table 12-16, which pair(s) of observations has a negative signed rank?
A perfume manufacturer is trying to choose between 2 magazine advertising layouts. An expensive layout would include a small package of the perfume. A cheaper layout would include a "scratch-and-sniff" sample of the product. The manufacturer would use the more expensive layout only if there is evidence that it would lead to a higher approval rate. The manufacturer presents both layouts to 5 groups and determines the approval rating from each group on both layouts. The data are given below. Use this to test whether the median difference in approval rating is different from zero in favor of the more expensive layout with a level of significance of 0.05.
Referring to Table 12-16, which pair(s) of observations has a negative signed rank?
Question
Question
Question
Question
Question
Question

Unlock Deck
Sign up to unlock the cards in this deck!
Unlock Deck
Unlock Deck
1/206
Play
Full screen (f)
Deck 12: Chi-Square Tests and Nonparametric Tests
1
TABLE 12-15
A perfume manufacturer is trying to choose between 2 magazine advertising layouts. An expensive layout would include a small package of the perfume. A cheaper layout would include a "scratch-and-sniff" sample of the product. The manufacturer would use the more expensive layout only if there is evidence that it would lead to a higher approval rate. The manufacturer presents the more expensive layout to 4 groups and determines the approval rating for each group. He presents the "scratch-and-sniff" layout to 5 groups and again determines the approval rating of the perfume for each group. The data are given below. Use this to test the appropriate hypotheses with the Wilcoxon Rank Sum Test with a level of significance of 0.05.
-Referring to Table 12-15, which hypotheses should be used?
A) versus
B) versus
C) versus
D) versus
versus
2
TABLE 12-11
Parents complain that children read too few storybooks and watch too much television nowadays. A survey of 1,000 children reveals the following information on average time spent watching TV and average time spent reading storybooks.
-Referring to Table 12-11, if the null hypothesis of no connection between time spent watching TV and time spent reading story books is true, how many children watching less than 2 hours of TV and reading no more than 2 hours of story books on average can we expect?
A) 227.23
B) 262.91
C) 969.75
D) 35.69
262.91
3
TABLE 12-12
Recent studies have found that American children are more obese than in the past. The amount of time children spent watching television has received much of the blame. A survey of 100 ten-year-olds revealed the following with regards to weights and average number of hours a day spent watching television. We are interested in testing whether the average number of hours spent watching TV and weights are independent at 1% level of significance.
-Referring to Table 12-12, if there is no connection between weights and average number of hours spent watching TV, we should expect how many children to be spending 3-6 hours on average watching TV and are more than 10 lbs. underweight?
A) 5
B) 8
C) 5.8
D) 6.2
5.8
4
To use the Wilcoxon Rank Sum Test as a test for location, we must assume that
A) both samples are randomly and independently drawn from their respective populations.
B) the obtained data are either ranks or numerical measurements that will be converted to combined ranks.
C) both underlying populations from which the samples were drawn are equivalent in shape and dispersion.
D) all of the above
Unlock Deck
Unlock for access to all 206 flashcards in this deck.
Unlock Deck
k this deck
5
TABLE 12-12
Recent studies have found that American children are more obese than in the past. The amount of time children spent watching television has received much of the blame. A survey of 100 ten-year-olds revealed the following with regards to weights and average number of hours a day spent watching television. We are interested in testing whether the average number of hours spent watching TV and weights are independent at 1% level of significance.
-Referring to Table 12-12, which of the following statements is correct?
A) We can reject the null for any level of significance greater than 0.005.
B) We can accept the null for any level of significance greater than 0.005.
C) We can accept the null for any level of significance smaller than 0.005
D) We can reject the null for any level of significance smaller than 0.005.
Unlock Deck
Unlock for access to all 206 flashcards in this deck.
Unlock Deck
k this deck
6
TABLE 12-2
Many companies use well-known celebrities as spokespersons in their TV advertisements. A study was conducted to determine whether brand awareness of female TV viewers and the gender of the spokesperson are independent. Each in a sample of 300 female TV viewers was asked to identify a product advertised by a celebrity spokesperson. The gender of the spokesperson and whether or not the viewer could identify the product was recorded. The numbers in each category are given below.
-Referring to Table 12-2, which test would be used to properly analyze the data in this experiment?
A) ?2 test for independence
B) Wilcoxon rank sum test for independent populations
C) ?2 test for differences among more than two proportions
D) Wilcoxon signed ranks test for two related populations
Unlock Deck
Unlock for access to all 206 flashcards in this deck.
Unlock Deck
k this deck
7
TABLE 12-8
The director of transportation of a large company is interested in the usage of the company's van pool program. She surveyed 129 of her employees on the usage of the program before and after a campaign to convince her employees to use the service and obtained the following:
She will use this information to perform test using a level of significance of 0.05.
-Referring to Table 12-8, the director now wants to know if the proportion of employees who use the service before the campaign and the proportion of employees who use the service after the campaign are the same. What should be her conclusion?
A) There is insufficient evidence that the proportion of employees who use the service before the campaign is not the same as the proportion of employees who use the service after the campaign.
B) There is insufficient evidence that the proportion of employees who use the service before the campaign is the same as the proportion of employees who use the service after the campaign.
C) There is sufficient evidence that the proportion of employees who use the service before the campaign is the same as the proportion of employees who use the service after the campaign.
D) There is sufficient evidence that the proportion of employees who use the service before the campaign is not the same as the proportion of employees who use the service after the campaign.
Unlock Deck
Unlock for access to all 206 flashcards in this deck.
Unlock Deck
k this deck
8
TABLE 12-5
A corporation randomly selects 150 salespeople and finds that 66% who have never taken a self-improvement course would like such a course. The firm did a similar study 10 years ago in which 60% of a random sample of 160 salespeople wanted a self-improvement course. The groups are assumed to be independent random samples. Let u1 and u2 represent the true proportion of workers who would like to attend a self-improvement course in the recent study and the past study, respectively.
Referring to Table 12-5, what is the critical value when testing whether population proportions are different if α = 0.10?
A) 2.706
B) ±1.645
C) 3.842
D) ±1.96
Unlock Deck
Unlock for access to all 206 flashcards in this deck.
Unlock Deck
k this deck
9
TABLE 12-11
Parents complain that children read too few storybooks and watch too much television nowadays. A survey of 1,000 children reveals the following information on average time spent watching TV and average time spent reading storybooks.
-Referring to Table 12-11, to test whether there is any relationship between average time spent watching TV and average time spent reading story books, the value of the measured test statistic is
A) -12.59.
B) 1,368.06.
C) 1.61.
D) 481.49.
Unlock Deck
Unlock for access to all 206 flashcards in this deck.
Unlock Deck
k this deck
10
TABLE 12-5
A corporation randomly selects 150 salespeople and finds that 66% who have never taken a self-improvement course would like such a course. The firm did a similar study 10 years ago in which 60% of a random sample of 160 salespeople wanted a self-improvement course. The groups are assumed to be independent random samples. Let u1 and u2 represent the true proportion of workers who would like to attend a self-improvement course in the recent study and the past study, respectively.
-Referring to Table 12-5, what is the critical value when performing a chi-square test on whether population proportions are different if ? = 0.05?
A) ±1.645
B) ±1.96
C) 2.706
D) 3.841
Unlock Deck
Unlock for access to all 206 flashcards in this deck.
Unlock Deck
k this deck
11
When the normality assumption is not met in a randomized block design, which of the following tests should be used?
A) Wilcoxon rank sum test
B) Friedman rank test
C) Kruskal-Wallis test
D) Wilcoxon signed ranks test
A) Wilcoxon rank sum test
B) Friedman rank test
C) Kruskal-Wallis test
D) Wilcoxon signed ranks test
Unlock Deck
Unlock for access to all 206 flashcards in this deck.
Unlock Deck
k this deck
12
Which of the following is a "robust" test procedure against the violation of distribution assumptions?
A) ?2-test of independence
B) ?2-test for the differences among more than two proportions
C) Wilcoxon rank sum test for difference in medians
D) ?2-test of a variance
A) ?2-test of independence
B) ?2-test for the differences among more than two proportions
C) Wilcoxon rank sum test for difference in medians
D) ?2-test of a variance
Unlock Deck
Unlock for access to all 206 flashcards in this deck.
Unlock Deck
k this deck
13
TABLE 12-4
One criterion used to evaluate employees in the assembly section of a large factory is the number of defective pieces per 1,000 parts produced. The quality control department wants to find out whether there is a relationship between years of experience and defect rate. Since the job is repetitious, after the initial training period any improvement due to a learning effect might be offset by a loss of motivation. A defect rate is calculated for each worker in a yearly evaluation. The results for 100 workers are given in the table below.
-Referring to Table 12-4, find the rejection region necessary for testing at the 0.05 level of significance whether there is a relationship between defect rate and years of experience.
A) Reject H0 if ?2 > 16.919
B) Reject H0 if ?2 > 9.488
C) Reject H0 if ?2 > 11.143
D) Reject H0 if ?2 > 15.507
Unlock Deck
Unlock for access to all 206 flashcards in this deck.
Unlock Deck
k this deck
14
TABLE 12-3
A computer used by a 24-hour banking service is supposed to randomly assign each transaction to one of 5 memory locations. A check at the end of a day's transactions gave the counts shown in the table to each of the 5 memory locations, along with the number of reported errors.
The bank manager wanted to test whether the proportion of errors in transactions assigned to each of the 5 memory locations differ.
-Referring to Table 12-3, the critical value of the test statistic at 1% level of significance is
A) 7.7794.
B) 23.2093.
C) 13.2767.
D) 20.0902.
Unlock Deck
Unlock for access to all 206 flashcards in this deck.
Unlock Deck
k this deck
15
A local real estate appraiser analyzed the sales prices of homes in 2 neighborhoods to the corresponding appraised values of the homes. The goal of the analysis was to compare the distribution of sale-to-appraised ratios from homes in the 2 neighborhoods. Random and independent samples were selected from the 2 neighborhoods from last year's homes sales, 8 from each of the 2 neighborhoods. Identify the nonparametric method that would be used to analyze the data.
A) the Wilcoxon Signed-Ranks Test, using the test statistic W
B) the Wilcoxon Rank Sum Test, using the test statistic Z
C) the Wilcoxon Signed-Ranks Test, using the test statistic Z
D) the Wilcoxon Rank Sum Test, using the test statistic T1
A) the Wilcoxon Signed-Ranks Test, using the test statistic W
B) the Wilcoxon Rank Sum Test, using the test statistic Z
C) the Wilcoxon Signed-Ranks Test, using the test statistic Z
D) the Wilcoxon Rank Sum Test, using the test statistic T1
Unlock Deck
Unlock for access to all 206 flashcards in this deck.
Unlock Deck
k this deck
16
TABLE 12-13
According to an article in Marketing News, fewer checks are being written at grocery store checkout stands than in the past. To determine whether there is a difference in the proportion of shoppers who pay by check among three consecutive years at a 0.05 level of significance, the results of a survey of 500 shoppers in three consecutive years are obtained and presented below.
-Referring to Table 12-13, what is the correct conclusion?
A) There is not enough evidence that at least two of the proportions are not equal.
B) There is enough evidence that the proportions are all different in the 3 years.
C) There is enough evidence that at least two of the proportions are not equal.
D) There is not enough evidence that the proportions are all different in the 3 years.
Unlock Deck
Unlock for access to all 206 flashcards in this deck.
Unlock Deck
k this deck
17
TABLE 12-12
Recent studies have found that American children are more obese than in the past. The amount of time children spent watching television has received much of the blame. A survey of 100 ten-year-olds revealed the following with regards to weights and average number of hours a day spent watching television. We are interested in testing whether the average number of hours spent watching TV and weights are independent at 1% level of significance.
-Referring to Table 12-12, if there is no connection between weights and average number of hours spent watching TV, we should expect how many children to be spending no more than 6 hours on average watching TV and are more than 10 lbs. underweight?
A) 12
B) 6.2
C) 8
D) 5.8
Unlock Deck
Unlock for access to all 206 flashcards in this deck.
Unlock Deck
k this deck
18
The director of transportation of a large company is interested in the usage of the company's van pool program. She surveyed 129 of her employees on the usage of the program before and after a campaign to convince her employees to use the service and obtained the following:
She will use this information to perform test using a level of significance of 0.05.
-Referring to Table 12-8, the director now wants to know if the proportion of employees who use the service before the campaign and the proportion of employees who use the service after the campaign are the same. Which test should she use?
A) Wilcoxon rank sum test
B) Z-test for difference in proportions
C) ?2-test for difference in proportions
D) McNemar test for difference in proportions
Unlock Deck
Unlock for access to all 206 flashcards in this deck.
Unlock Deck
k this deck
19
TABLE 12-4
One criterion used to evaluate employees in the assembly section of a large factory is the number of defective pieces per 1,000 parts produced. The quality control department wants to find out whether there is a relationship between years of experience and defect rate. Since the job is repetitious, after the initial training period any improvement due to a learning effect might be offset by a loss of motivation. A defect rate is calculated for each worker in a yearly evaluation. The results for 100 workers are given in the table below.
-Referring to Table 12-4, of the cell for 1 to 4 years of training time and a high defect rate, what is the contribution to the overall ?2 statistic for the independence test?
A) 0.36
B) 0.0144
C) 0.1296
D) 0.015
Unlock Deck
Unlock for access to all 206 flashcards in this deck.
Unlock Deck
k this deck
20
Many companies use well-known celebrities as spokespersons in their TV advertisements. A study was conducted to determine whether brand awareness of female TV viewers and the gender of the spokesperson are independent. Each in a sample of 300 female TV viewers was asked to identify a product advertised by a celebrity spokesperson. The gender of the spokesperson and whether or not the viewer could identify the product was recorded. The numbers in each category are given below.
-Referring to Table 12-2, at 5% level of significance, the critical value of the test statistic is
A) 5.9914.
B) 9.4877.
C) 13.2767.
D) 3.8415.
-Referring to Table 12-2, at 5% level of significance, the critical value of the test statistic is
A) 5.9914.
B) 9.4877.
C) 13.2767.
D) 3.8415.
Unlock Deck
Unlock for access to all 206 flashcards in this deck.
Unlock Deck
k this deck
21
TABLE 12-4
One criterion used to evaluate employees in the assembly section of a large factory is the number of defective pieces per 1,000 parts produced. The quality control department wants to find out whether there is a relationship between years of experience and defect rate. Since the job is repetitious, after the initial training period any improvement due to a learning effect might be offset by a loss of motivation. A defect rate is calculated for each worker in a yearly evaluation. The results for 100 workers are given in the table below.
-Referring to Table 12-4, what is the expected number of employees with less than 1 year of training time and a high defect rate?
A) 4.60
B) 9.17
C) 5.28
D) 4.17
Unlock Deck
Unlock for access to all 206 flashcards in this deck.
Unlock Deck
k this deck
22
TABLE 12-12
Recent studies have found that American children are more obese than in the past. The amount of time children spent watching television has received much of the blame. A survey of 100 ten-year-olds revealed the following with regards to weights and average number of hours a day spent watching television. We are interested in testing whether the average number of hours spent watching TV and weights are independent at 1% level of significance.
-Referring to Table 12-12, what is the value of the test statistic?
A) 15.483
B) 69.744
C) 18.889
D) 8.532
Unlock Deck
Unlock for access to all 206 flashcards in this deck.
Unlock Deck
k this deck
23
TABLE 12-3
A computer used by a 24-hour banking service is supposed to randomly assign each transaction to one of 5 memory locations. A check at the end of a day's transactions gave the counts shown in the table to each of the 5 memory locations, along with the number of reported errors.
The bank manager wanted to test whether the proportion of errors in transactions assigned to each of the 5 memory locations differ.
-Referring to Table 12-3, the calculated value of the test statistic is
A) -0.0185.
B) 1.4999.
C) 1.5190.
D) -0.1777.
Unlock Deck
Unlock for access to all 206 flashcards in this deck.
Unlock Deck
k this deck
24
TABLE 12-4
One criterion used to evaluate employees in the assembly section of a large factory is the number of defective pieces per 1,000 parts produced. The quality control department wants to find out whether there is a relationship between years of experience and defect rate. Since the job is repetitious, after the initial training period any improvement due to a learning effect might be offset by a loss of motivation. A defect rate is calculated for each worker in a yearly evaluation. The results for 100 workers are given in the table below.
-Referring to Table 12-4, which test would be used to properly analyze the data in this experiment to determine whether there is a relationship between defect rate and years of experience?
A) ?2 test for differences among more than two proportions
B) Wilcoxon rank sum test for independent populations
C) Wilcoxon signed ranks test for two related populations
D) ?2 test for independence
Unlock Deck
Unlock for access to all 206 flashcards in this deck.
Unlock Deck
k this deck
25
TABLE 12-16
A perfume manufacturer is trying to choose between 2 magazine advertising layouts. An expensive layout would include a small package of the perfume. A cheaper layout would include a "scratch-and-sniff" sample of the product. The manufacturer would use the more expensive layout only if there is evidence that it would lead to a higher approval rate. The manufacturer presents both layouts to 5 groups and determines the approval rating from each group on both layouts. The data are given below. Use this to test whether the median difference in approval rating is different from zero in favor of the more expensive layout with a level of significance of 0.05.
-Referring to Table 12-16, what is the right test to use?
A) Wilcoxon signed rank test for difference in median
B) Wilcoxon rank sum test for median difference
C) Wilcoxon rank sum test for difference in median
D) Wilcoxon signed rank test for median difference
Unlock Deck
Unlock for access to all 206 flashcards in this deck.
Unlock Deck
k this deck
26
If we wish to determine whether there is evidence that the proportion of items of interest is the same in group 1 as in group 2, the appropriate test to use is
A) the Z test.
B) the ?2 test.
C) both A and B
D) neither of A nor B
A) the Z test.
B) the ?2 test.
C) both A and B
D) neither of A nor B
Unlock Deck
Unlock for access to all 206 flashcards in this deck.
Unlock Deck
k this deck
27
TABLE 12-13
According to an article in Marketing News, fewer checks are being written at grocery store checkout stands than in the past. To determine whether there is a difference in the proportion of shoppers who pay by check among three consecutive years at a 0.05 level of significance, the results of a survey of 500 shoppers in three consecutive years are obtained and presented below.
-Referring to Table 12-13, what is the form of the alternative hypothesis?
A)
B)
C) not all are the same
D)
Unlock Deck
Unlock for access to all 206 flashcards in this deck.
Unlock Deck
k this deck
28
When testing for independence in a contingency table with 3 rows and 4 columns, there are _____degrees of freedom.
A) 5
B) 12
C) 6
D) 7
A) 5
B) 12
C) 6
D) 7
Unlock Deck
Unlock for access to all 206 flashcards in this deck.
Unlock Deck
k this deck
29
In testing for whether the median difference of two related populations is zero, the null hypothesis is
A) .
B) .
C) .
D) .
A) .
B) .
C) .
D) .
Unlock Deck
Unlock for access to all 206 flashcards in this deck.
Unlock Deck
k this deck
30
TABLE 12-16
A perfume manufacturer is trying to choose between 2 magazine advertising layouts. An expensive layout would include a small package of the perfume. A cheaper layout would include a "scratch-and-sniff" sample of the product. The manufacturer would use the more expensive layout only if there is evidence that it would lead to a higher approval rate. The manufacturer presents both layouts to 5 groups and determines the approval rating from each group on both layouts. The data are given below. Use this to test whether the median difference in approval rating is different from zero in favor of the more expensive layout with a level of significance of 0.05.
-Referring to Table 12-16, the perfume manufacturer will
A) use the "scratch-and-sniff" layout because there is sufficient evidence to conclude that this is the best course of action.
B) use the package layout because there is insufficient evidence to do otherwise.
C) use the package layout because there is sufficient evidence to conclude that this is the best course of action.
D) use the "scratch-and-sniff" layout because there is insufficient evidence to do otherwise.
Unlock Deck
Unlock for access to all 206 flashcards in this deck.
Unlock Deck
k this deck
31
The Journal of Business Venturing reported on the activities of entrepreneurs during the organization creation process. As part of a designed study, a total of 71 entrepreneurs were interviewed and divided into 3 groups: those that were successful in founding a new firm (n1 = 34), those still actively trying to establish a firm (n2 = 21), and those who tried to start a new firm but eventually gave up (n3 = 16). The total number of activities undertaken (e.g., developed a business plan, sought funding, looked for facilities) by each group over a specified time period during organization creation was measured. The objective is to compare the mean number of activities of the 3 groups of entrepreneurs. Because of concerns over necessary assumption of the parametric analysis, it was decided to use a nonparametric analysis. Identify the nonparametric method that would be used to analyze the data.
A) Wilcoxon Rank Sums Test
B) Kruskal-Wallis Rank Test
C) Wilcoxon Signed Rank Test
D) one-way ANOVA F test
A) Wilcoxon Rank Sums Test
B) Kruskal-Wallis Rank Test
C) Wilcoxon Signed Rank Test
D) one-way ANOVA F test
Unlock Deck
Unlock for access to all 206 flashcards in this deck.
Unlock Deck
k this deck
32
TABLE 12-5
A corporation randomly selects 150 salespeople and finds that 66% who have never taken a self-improvement course would like such a course. The firm did a similar study 10 years ago in which 60% of a random sample of 160 salespeople wanted a self-improvement course. The groups are assumed to be independent random samples. Let u1 and u2 represent the true proportion of workers who would like to attend a self-improvement course in the recent study and the past study, respectively.
Referring to Table 12-5, what is the value of the test statistic to use in evaluating the alternative hypothesis that there is a difference in the two population proportions using α = 0.10?
A) 1.194
B) 0.274
C) 2.706
D) 4.335
Unlock Deck
Unlock for access to all 206 flashcards in this deck.
Unlock Deck
k this deck
33
TABLE 12-1
A study published in the American Journal of Public Health was conducted to determine whether the use of seat belts in motor vehicles depends on ethnic status in San Diego County. A sample of 792 children treated for injuries sustained from motor vehicle accidents was obtained, and each child was classified according to (1) ethnic status (Hispanic or non-Hispanic) and
(2) seat belt usage (worn or not worn) during the accident. The number of children in each category is given in the table below.
-Referring to Table 12-1, which test would be used to properly analyze the data in this experiment?
A) Wilcoxon signed ranks test for two related populations
B) Wilcoxon rank sum test for independent populations
C) ?2 test for independence
D) ?2 test for differences among more than two proportions
Unlock Deck
Unlock for access to all 206 flashcards in this deck.
Unlock Deck
k this deck
34
If the assumptions of the one-way ANOVA F test are not met, which of the following test could be used?
A) McNemar test
B) Marascuilo procedure
C) Kruskal-Wallis test
D) none of the above
A) McNemar test
B) Marascuilo procedure
C) Kruskal-Wallis test
D) none of the above
Unlock Deck
Unlock for access to all 206 flashcards in this deck.
Unlock Deck
k this deck
35
In testing a hypothesis using the ?2 test, the theoretical frequencies are based on the
A) alternative hypothesis.
B) normal distribution.
C) null hypothesis.
D) none of the above
A) alternative hypothesis.
B) normal distribution.
C) null hypothesis.
D) none of the above
Unlock Deck
Unlock for access to all 206 flashcards in this deck.
Unlock Deck
k this deck
36
Suppose there is interest in comparing the median response time for three independent groups learning a specific task. The appropriate nonparametric procedure is
A) Friedman rank test.
B) Kruskal-Wallis Rank Test.
C) Wilcoxon Rank Sums Test.
D) Wilcoxon Signed Rank Test.
A) Friedman rank test.
B) Kruskal-Wallis Rank Test.
C) Wilcoxon Rank Sums Test.
D) Wilcoxon Signed Rank Test.
Unlock Deck
Unlock for access to all 206 flashcards in this deck.
Unlock Deck
k this deck
37
TABLE 12-11
Parents complain that children read too few storybooks and watch too much television nowadays. A survey of 1,000 children reveals the following information on average time spent watching TV and average time spent reading storybooks.
-Referring to Table 12-11, how many children in the survey spent less than 2 hours watching TV and more than 2 hours reading story books on average?
A) 687
B) 130
C) 8
D) 175
Unlock Deck
Unlock for access to all 206 flashcards in this deck.
Unlock Deck
k this deck
38
TABLE 12-3
A computer used by a 24-hour banking service is supposed to randomly assign each transaction to one of 5 memory locations. A check at the end of a day's transactions gave the counts shown in the table to each of the 5 memory locations, along with the number of reported errors.
The bank manager wanted to test whether the proportion of errors in transactions assigned to each of the 5 memory locations differ.
-Referring to Table 12-3, which test would be used to properly analyze the data in this experiment?
A) McNemar test for the difference among more than two proportions
B) McNemar test for the difference between two proportions
C) ?2 test for difference among more than two proportions
D) ?2 test of independence
Unlock Deck
Unlock for access to all 206 flashcards in this deck.
Unlock Deck
k this deck
39
TABLE 12-12
Recent studies have found that American children are more obese than in the past. The amount of time children spent watching television has received much of the blame. A survey of 100 ten-year-olds revealed the following with regards to weights and average number of hours a day spent watching television. We are interested in testing whether the average number of hours spent watching TV and weights are independent at 1% level of significance.
-Referring to Table 12-12, the degrees of freedom of the test statistic are
A) 2.
B) 4.
C) 1.
D) 9.
Unlock Deck
Unlock for access to all 206 flashcards in this deck.
Unlock Deck
k this deck
40
TABLE 12-6
The dean of a college is interested in the proportion of graduates from his college who have a job offer on graduation day. He is particularly interested in seeing if there is a difference in this proportion for accounting and economics majors. In a random sample of 100 of each type of major at graduation, he found that 65 accounting majors and 52 economics majors
had job offers. If the accounting majors are designated as "Group 1" and the economics majors are designated as "Group 2," perform the appropriate hypothesis test using a level of significance of 0.05.
-Referring to Table 12-6, which hypotheses should the dean use?
A) versus
B) versus
C) versus
D) versus
Unlock Deck
Unlock for access to all 206 flashcards in this deck.
Unlock Deck
k this deck
41
TABLE 12-11
Parents complain that children read too few storybooks and watch too much television nowadays. A survey of 1,000 children reveals the following information on average time spent watching TV and average time spent reading storybooks.
-Referring to Table 12-11, if the null hypothesis of no connection between time spent watching TV and time spent reading story books is true, how many children watching less than 2 hours of TV and reading more than 2 hours of story books on average can we expect?
A) 42.09
B) 987.75
C) 155.25
D) 262.92
Unlock Deck
Unlock for access to all 206 flashcards in this deck.
Unlock Deck
k this deck
42
TABLE 12-2
Many companies use well-known celebrities as spokespersons in their TV advertisements. A study was conducted to determine whether brand awareness of female TV viewers and the gender of the spokesperson are independent. Each in a sample of 300 female TV viewers was asked to identify a product advertised by a celebrity spokesperson. The gender of the spokesperson and whether or not the viewer could identify the product was recorded. The numbers in each category are given below.
-Referring to Table 12-2, the degrees of freedom of the test statistic are
A) 299.
B) 1.
C) 2.
D) 4.
Unlock Deck
Unlock for access to all 206 flashcards in this deck.
Unlock Deck
k this deck
43
TABLE 12-11
Parents complain that children read too few storybooks and watch too much television nowadays. A survey of 1,000 children reveals the following information on average time spent watching TV and average time spent reading storybooks.
-Referring to Table 12-11, suppose we want to constrain the probability of committing a Type I error to 5% when testing whether there is any relationship between average time spent watching TV and average time spent reading story books, the critical value will be
A) 14.449.
B) 12.592.
C) 7.378.
D) 5.991.
Unlock Deck
Unlock for access to all 206 flashcards in this deck.
Unlock Deck
k this deck
44
TABLE 12-3
A computer used by a 24-hour banking service is supposed to randomly assign each transaction to one of 5 memory locations. A check at the end of a day's transactions gave the counts shown in the table to each of the 5 memory locations, along with the number of reported errors.
The bank manager wanted to test whether the proportion of errors in transactions assigned to each of the 5 memory locations differ.
-Referring to Table 12-3, at 1% level of significance
A) there is sufficient evidence to conclude that the proportion of errors in transactions assigned to each of the 5 memory locations are not all the same.
B) there is insufficient evidence to conclude that the proportion of errors in transactions assigned to each of the 5 memory locations are not all the same.
C) there is insufficient evidence to conclude that the proportions of errors in transactions assigned to each of the 5 memory locations are all different.
D) there is sufficient evidence to conclude that the proportions of errors in transactions assigned to each of the 5 memory locations are all different.
Unlock Deck
Unlock for access to all 206 flashcards in this deck.
Unlock Deck
k this deck
45
TABLE 12-4
One criterion used to evaluate employees in the assembly section of a large factory is the number of defective pieces per 1,000 parts produced. The quality control department wants to find out whether there is a relationship between years of experience and defect rate. Since the job is repetitious, after the initial training period any improvement due to a learning effect might be offset by a loss of motivation. A defect rate is calculated for each worker in a yearly evaluation. The results for 100 workers are given in the table below.
-Referring to Table 12-4, a test was conducted to determine if a relationship exists between defect rate and years of experience. Which of the following p-values would indicate that defect rate and years of experience are dependent? Assume you are testing at ? = 0.05.
A) 0.080
B) 0.055
C) 0.074
D) 0.045
Unlock Deck
Unlock for access to all 206 flashcards in this deck.
Unlock Deck
k this deck
46
TABLE 12-11
Parents complain that children read too few storybooks and watch too much television nowadays. A survey of 1,000 children reveals the following information on average time spent watching TV and average time spent reading storybooks.
-Referring to Table 12-11, we want to test whether there is any relationship between average time spent watching TV and average time spent reading storybooks. Suppose the value of the test statistic was 164 (which is not the correct answer) and the critical value was 19.00 (which is not the correct answer), then we could conclude that
A) more time spent reading storybooks leads to less time spent watching TV.
B) there is connection between time spent reading storybooks and time spent watching TV.
C) more time spent watching TV leads to less time spent reading storybooks.
D) there is no connection between time spent reading storybooks and time spent watching TV.
Unlock Deck
Unlock for access to all 206 flashcards in this deck.
Unlock Deck
k this deck
47
In testing for differences between the median of two independent populations, the null hypothesis is
A) H0 : M1 - M2 = 0.
B) H0 : M1 - M2 ? 0.
C) H0 : MD = 0.
D) H0 : MD ? 0.
A) H0 : M1 - M2 = 0.
B) H0 : M1 - M2 ? 0.
C) H0 : MD = 0.
D) H0 : MD ? 0.
Unlock Deck
Unlock for access to all 206 flashcards in this deck.
Unlock Deck
k this deck
48
TABLE 12-2
Many companies use well-known celebrities as spokespersons in their TV advertisements. A study was conducted to determine whether brand awareness of female TV viewers and the gender of the spokesperson are independent. Each in a sample of 300 female TV viewers was asked to identify a product advertised by a celebrity spokesperson. The gender of the spokesperson and whether or not the viewer could identify the product was recorded. The numbers in each category are given below.
-The Kruskal-Wallis Rank Test for differences in more than two medians is a nonparametric alternative to
A) Student's t test for independent samples.
B) Student's t test for related samples.
C) ANOVA F test for completely randomized experiments.
D) Wilcoxon's Rank Sum Test for differences in two medians.
Unlock Deck
Unlock for access to all 206 flashcards in this deck.
Unlock Deck
k this deck
49
TABLE 12-12
Recent studies have found that American children are more obese than in the past. The amount of time children spent watching television has received much of the blame. A survey of 100 ten-year-olds revealed the following with regards to weights and average number of hours a day spent watching television. We are interested in testing whether the average number of hours spent watching TV and weights are independent at 1% level of significance.
-Referring to Table 12-12, the critical value of the test will be
A) 21.666.
B) 14.860.
C) 6.635.
D) 13.277.
Unlock Deck
Unlock for access to all 206 flashcards in this deck.
Unlock Deck
k this deck
50
TABLE 12-15
A perfume manufacturer is trying to choose between 2 magazine advertising layouts. An expensive layout would include a small package of the perfume. A cheaper layout would include a "scratch-and-sniff" sample of the product. The manufacturer would use the more expensive layout only if there is evidence that it would lead to a higher approval rate. The manufacturer presents the more expensive layout to 4 groups and determines the approval rating for each group. He presents the "scratch-and-sniff" layout to 5 groups and again determines the approval rating of the perfume for each group. The data are given below. Use this to test the appropriate hypotheses with the Wilcoxon Rank Sum Test with a level of significance of 0.05.
-Referring to Table 12-15, the perfume manufacturer will
A) use the "scratch-and-sniff" layout because there is sufficient evidence to conclude that this is the best course of action.
B) use the package layout because there is sufficient evidence to conclude that this is the best course of action.
C) use the package layout because there is insufficient evidence to do otherwise.
D) use the "scratch-and-sniff" layout because there is insufficient evidence to do otherwise.
Unlock Deck
Unlock for access to all 206 flashcards in this deck.
Unlock Deck
k this deck
51
TABLE 12-11
Parents complain that children read too few storybooks and watch too much television nowadays. A survey of 1,000 children reveals the following information on average time spent watching TV and average time spent reading storybooks.
-Referring to Table 12-11, how many children in the survey spent less than 2 hours watching TV and no more than 2 hours reading storybooks on average?
A) 175
B) 8
C) 130
D) 687
Unlock Deck
Unlock for access to all 206 flashcards in this deck.
Unlock Deck
k this deck
52
TABLE 12-19
An agronomist wants to compare the crop yield of 3 varieties of chickpea seeds. She plants all 3 varieties of the seeds on each of 5 different patches of fields. She then measures the crop yield in bushels per acre. Treating this as a randomized block design, the results are presented in the table that follows.
Below is the Minitab output of the Friedman rank test:
Friedman Test: Yield versus Varieties, Fields
-Referring to Table 12-19, what is the null hypothesis for the Friedman rank test?
A) H0: µField1 = µField2 = µField3 = µField4 = µField5
B) H0: MSmith = MWalsh = MTrevor
C) H0: µSmith = µWalsh = µTrevor
D) H0: MField1 = MField2 = MField3 = MField4 = MField5
Unlock Deck
Unlock for access to all 206 flashcards in this deck.
Unlock Deck
k this deck
53
TABLE 12-1
A study published in the American Journal of Public Health was conducted to determine whether the use of seat belts in motor vehicles depends on ethnic status in San Diego County. A sample of 792 children treated for injuries sustained from motor vehicle accidents was obtained, and each child was classified according to (1) ethnic status (Hispanic or non-Hispanic) and
(2) seat belt usage (worn or not worn) during the accident. The number of children in each category is given in the table below.
-Referring to Table 12-1, at 5% level of significance, there is sufficient evidence to conclude that
A) use of seat belts in motor vehicles depends on ethnic status in San Diego County.
B) use of seat belts in motor vehicles is associated with ethnic status in San Diego County.
C) use of seat belts in motor vehicles is related to ethnic status in San Diego County.
D) all of the above
Unlock Deck
Unlock for access to all 206 flashcards in this deck.
Unlock Deck
k this deck
54
TABLE 12-2
Many companies use well-known celebrities as spokespersons in their TV advertisements. A study was conducted to determine whether brand awareness of female TV viewers and the gender of the spokesperson are independent. Each in a sample of 300 female TV viewers was asked to identify a product advertised by a celebrity spokesperson. The gender of the spokesperson and whether or not the viewer could identify the product was recorded. The numbers in each category are given below.
-Referring to Table 12-2, at 5% level of significance, the conclusion is that
A) brand awareness of female TV viewers and the gender of the spokesperson are independent.
B) brand awareness of female TV viewers and the gender of the spokesperson are not independent.
C) brand awareness of female TV viewers and the gender of the spokesperson are related.
D) both B and C
Unlock Deck
Unlock for access to all 206 flashcards in this deck.
Unlock Deck
k this deck
55
TABLE 12-17
The director of the MBA program of a state university wanted to know if a one week orientation would change the proportion among potential incoming students who would perceive the program as being good. Given below is the result from 215 students' view of the program before and after the orientation.
-Referring to Table 12-17, what should be the director's conclusion?
A) There is insufficient evidence that the proportion of potential incoming students who perceive the program as being good is not the same before and after the orientation.
B) There is sufficient evidence that the proportion of potential incoming students who perceive the program as being good is not the same before and after the orientation.
C) There is sufficient evidence that the proportion of potential incoming students who perceive the program as being good is the same before and after the orientation.
D) There is insufficient evidence that the proportion of potential incoming students who perceive the program as being good is the same before and after the orientation.
Unlock Deck
Unlock for access to all 206 flashcards in this deck.
Unlock Deck
k this deck
56
TABLE 12-11
Parents complain that children read too few storybooks and watch too much television nowadays. A survey of 1,000 children reveals the following information on average time spent watching TV and average time spent reading storybooks.
-Referring to Table 12-12, how many children in the survey spend more than 6 hours watching TV and are more than 10 lbs. overweight?
A) 9
B) 20
C) 1
D) 40
Unlock Deck
Unlock for access to all 206 flashcards in this deck.
Unlock Deck
k this deck
57
TABLE 12-12
Recent studies have found that American children are more obese than in the past. The amount of time children spent watching television has received much of the blame. A survey of 100 ten-year-olds revealed the following with regards to weights and average number of hours a day spent watching television. We are interested in testing whether the average number of hours spent watching TV and weights are independent at 1% level of significance.
-Referring to Table 12-12, suppose the value of the test statistic was 30.00 (which is not the correct value) and the critical value at 1% level of significance was 10.00 (which is not the correct value), which of the following conclusions would be correct?
A) We will reject the null and conclude that average number of hours spent watching TV and weights are independent.
B) We will accept the null and conclude that average number of hours spent watching TV and weights are not independent.
C) We will reject the null and conclude that average number of hours spent watching TV and weights are not independent.
D) We will accept the null and conclude that average number of hours spent watching TV and weights are independent.
Unlock Deck
Unlock for access to all 206 flashcards in this deck.
Unlock Deck
k this deck
58
TABLE 12-2
Many companies use well-known celebrities as spokespersons in their TV advertisements. A study was conducted to determine whether brand awareness of female TV viewers and the gender of the spokesperson are independent. Each in a sample of 300 female TV viewers was asked to identify a product advertised by a celebrity spokesperson. The gender of the spokesperson and whether or not the viewer could identify the product was recorded. The numbers in each category are given below.
-Referring to Table 12-2, the calculated test statistic is
A) 5.9418.
B) 6.1194.
C) -0.1006.
D) 0.00.
Unlock Deck
Unlock for access to all 206 flashcards in this deck.
Unlock Deck
k this deck
59
TABLE 12-16
A perfume manufacturer is trying to choose between 2 magazine advertising layouts. An expensive layout would include a small package of the perfume. A cheaper layout would include a "scratch-and-sniff" sample of the product. The manufacturer would use the more expensive layout only if there is evidence that it would lead to a higher approval rate. The manufacturer presents both layouts to 5 groups and determines the approval rating from each group on both layouts. The data are given below. Use this to test whether the median difference in approval rating is different from zero in favor of the more expensive layout with a level of significance of 0.05.
-Referring to Table 12-16, which hypotheses should be used?
A) versus
B) versus
C) versus
D) versus
Unlock Deck
Unlock for access to all 206 flashcards in this deck.
Unlock Deck
k this deck
60
TABLE 12-17
The director of the MBA program of a state university wanted to know if a one week orientation would change the proportion among potential incoming students who would perceive the program as being good. Given below is the result from 215 students' view of the program before and after the orientation.
-Referring to Table 12-17, which test should she use?
A)?2-test for difference in proportions
B) McNemar test for difference in proportions
C) Wilcoxon rank sum test
D) Z-test for difference in proportions
Unlock Deck
Unlock for access to all 206 flashcards in this deck.
Unlock Deck
k this deck
61
TABLE 12-13
According to an article in Marketing News, fewer checks are being written at grocery store checkout stands than in the past. To determine whether there is a difference in the proportion of shoppers who pay by check among three consecutive years at a 0.05 level of significance, the results of a survey of 500 shoppers in three consecutive years are obtained and presented below.
Referring to Table 12-13, what is the p-value of the test statistic?
Unlock Deck
Unlock for access to all 206 flashcards in this deck.
Unlock Deck
k this deck
62
TABLE 12-9
Four surgical procedures currently are used to install pacemakers. If the patient does not need to return for follow-up surgery the operation is called a "clear" operation. A heart center wants to compare the proportion of clear operations for the 4 procedures, and collects the following numbers of patients from their own records:
They will use this information to test for a difference among the proportion of clear operations using a chi-square test with a level of significance of 0.05.
-Referring to Table 12-9, the expected cell frequency for the Procedure D/Return cell is_____
Unlock Deck
Unlock for access to all 206 flashcards in this deck.
Unlock Deck
k this deck
63
TABLE 12-4
One criterion used to evaluate employees in the assembly section of a large factory is the number of defective pieces per 1,000 parts produced. The quality control department wants to find out whether there is a relationship between years of experience and defect rate. Since the job is repetitious, after the initial training period any improvement due to a learning effect might be offset by a loss of motivation. A defect rate is calculated for each worker in a yearly evaluation. The results for 100 workers are given in the table below.
-Referring to Table 12-4, what is the expected number of employees with 1 to 4 years of training time and a high defect rate?
A) 8.64
B) 12.00
C) 6.67
D) 6.00
Unlock Deck
Unlock for access to all 206 flashcards in this deck.
Unlock Deck
k this deck
64
TABLE 12-14
A filling machine at a local soft drinks company is calibrated to fill the cans at an average amount of 12 fluid ounces and a standard deviation of 0.5 ounces. The company wants to test whether the standard deviation of the amount filled by the machine is indeed 0.5 ounces. A random sample of 15 cans filled by the machine reveals a standard deviation of 0.67 ounces.
-Referring to Table 12-14, what type of test should be performed?
A) two-tailed test
B) upper-tailed test
C) lower-tailed test
D) none of the above
Unlock Deck
Unlock for access to all 206 flashcards in this deck.
Unlock Deck
k this deck
65
TABLE 12-19
An agronomist wants to compare the crop yield of 3 varieties of chickpea seeds. She plants all 3 varieties of the seeds on each of 5 different patches of fields. She then measures the crop yield in bushels per acre. Treating this as a randomized block design, the results are presented in the table that follows.
Below is the Minitab output of the Friedman rank test:
Friedman Test: Yield versus Varieties, Fields
Friedman test for Yield by Varieties blocked by Fields
-Referring to Table 12-19, what is the critical value of the Friedman rank test for the difference in the medians at a level of significance of 0.01?
Unlock Deck
Unlock for access to all 206 flashcards in this deck.
Unlock Deck
k this deck
66
TABLE 12-9
Four surgical procedures currently are used to install pacemakers. If the patient does not need to return for follow-up surgery the operation is called a "clear" operation. A heart center wants to compare the proportion of clear operations for the 4 procedures, and collects the following numbers of patients from their own records:
They will use this information to test for a difference among the proportion of clear operations using a chi-square test with a level of significance of 0.05.
-Referring to Table 12-9, what is the value of the critical range for the Marascuilo procedure to test for the difference in proportions between procedure A and procedure D using a 0.05 level of significance?
Unlock Deck
Unlock for access to all 206 flashcards in this deck.
Unlock Deck
k this deck
67
TABLE 12-13
According to an article in Marketing News, fewer checks are being written at grocery store checkout stands than in the past. To determine whether there is a difference in the proportion of shoppers who pay by check among three consecutive years at a 0.05 level of significance, the results of a survey of 500 shoppers in three consecutive years are obtained and presented below.
-Referring to Table 12-13, what is the expected number of shoppers who pay by check in year 1 if there is no difference in the proportion of shoppers who pay by check among the three years?
Unlock Deck
Unlock for access to all 206 flashcards in this deck.
Unlock Deck
k this deck
68
TABLE 12-1
A study published in the American Journal of Public Health was conducted to determine whether the use of seat belts in motor vehicles depends on ethnic status in San Diego County. A sample of 792 children treated for injuries sustained from motor vehicle accidents was obtained, and each child was classified according to (1) ethnic status (Hispanic or non-Hispanic) and
1() seat belt usage (worn or not worn) during the accident. The number of children in each category is given in the table below.
-Referring to Table 12-1, at 5% level of significance, the critical value of the test statistic is
A) 13.2767.
B) 5.9914.
C) 9.4877.
D) 3.8415.
Unlock Deck
Unlock for access to all 206 flashcards in this deck.
Unlock Deck
k this deck
69
TABLE 12-6
The dean of a college is interested in the proportion of graduates from his college who have a job offer on graduation day. He is particularly interested in seeing if there is a difference in this proportion for accounting and economics majors. In a random sample of 100 of each type of major at graduation, he found that 65 accounting majors and 52 economics majors
had job offers. If the accounting majors are designated as "Group 1" and the economics majors are designated as "Group 2," perform the appropriate hypothesis test using a level of significance of 0.05.
-Referring to Table 12-6, the value of the test statistic is _____ .
Unlock Deck
Unlock for access to all 206 flashcards in this deck.
Unlock Deck
k this deck
70
TABLE 12-14
A filling machine at a local soft drinks company is calibrated to fill the cans at an average amount of 12 fluid ounces and a standard deviation of 0.5 ounces. The company wants to test whether the standard deviation of the amount filled by the machine is indeed 0.5 ounces. A random sample of 15 cans filled by the machine reveals a standard deviation of 0.67 ounces.
-Referring to Table 12-14, which is the appropriate test to use?
A) ?2-test of population variance
B) Wilcoxon rank sum test
C) Wilcoxon signed ranks test
D)?2-test of independence
Unlock Deck
Unlock for access to all 206 flashcards in this deck.
Unlock Deck
k this deck
71
The Kruskal-Wallis test is an extension of which of the following for two independent samples?
A) Wilcoxon signed ranks test
B) Wilcoxon rank sum test
C) pooled-variance t test
D) paired-sample t test
A) Wilcoxon signed ranks test
B) Wilcoxon rank sum test
C) pooled-variance t test
D) paired-sample t test
Unlock Deck
Unlock for access to all 206 flashcards in this deck.
Unlock Deck
k this deck
72
TABLE 12-5
A corporation randomly selects 150 salespeople and finds that 66% who have never taken a self-improvement course would like such a course. The firm did a similar study 10 years ago in which 60% of a random sample of 160 salespeople wanted a self-improvement course. The groups are assumed to be independent random samples. Let u1 and u2 represent the true proportion of workers who would like to attend a self-improvement course in the recent study and the past study, respectively.
-Referring to Table 12-5, the company tests to determine at the 0.05 level whether the population proportion has changed from the previous study. Which of the following is most correct?
A) Reject the null hypothesis and conclude that the proportion of employees who are interested in a self-improvement course has increased over the intervening 10 years.
B) Do not reject the null hypothesis and conclude that the proportion of employees who are interested in a self-improvement course has not changed over the intervening 10 years.
C) Reject the null hypothesis and conclude that the proportion of employees who are interested in a self-improvement course has changed over the intervening 10 years.
D) Do not reject the null hypothesis and conclude that the proportion of employees who are interested in a self-improvement course has increased over the intervening 10 years.
Unlock Deck
Unlock for access to all 206 flashcards in this deck.
Unlock Deck
k this deck
73
TABLE 12-1
A study published in the American Journal of Public Health was conducted to determine whether the use of seat belts in motor vehicles depends on ethnic status in San Diego County. A sample of 792 children treated for injuries sustained from motor vehicle accidents was obtained, and each child was classified according to (1) ethnic status (Hispanic or non-Hispanic) and
1() seat belt usage (worn or not worn) during the accident. The number of children in each category is given in the table below.
-Referring to Table 12-1, the calculated test statistic is
A) -0.9991.
B) -0.1368.
C) 72.8063.
D) 48.1849.
Unlock Deck
Unlock for access to all 206 flashcards in this deck.
Unlock Deck
k this deck
74
TABLE 12-16
A perfume manufacturer is trying to choose between 2 magazine advertising layouts. An expensive layout would include a small package of the perfume. A cheaper layout would include a "scratch-and-sniff" sample of the product. The manufacturer would use the more expensive layout only if there is evidence that it would lead to a higher approval rate. The manufacturer presents both layouts to 5 groups and determines the approval rating from each group on both layouts. The data are given below. Use this to test whether the median difference in approval rating is different from zero in favor of the more expensive layout with a level of significance of 0.05.
Referring to Table 12-16, which pair(s) of observations has a negative signed rank?
Unlock Deck
Unlock for access to all 206 flashcards in this deck.
Unlock Deck
k this deck
75
TABLE 12-13
According to an article in Marketing News, fewer checks are being written at grocery store checkout stands than in the past. To determine whether there is a difference in the proportion of shoppers who pay by check among three consecutive years at a 0.05 level of significance, the results of a survey of 500 shoppers in three consecutive years are obtained and presented below.
-Referring to Table 12-13, what is the form of the null hypothesis?
A)
B)
C)
D)
Unlock Deck
Unlock for access to all 206 flashcards in this deck.
Unlock Deck
k this deck
76
TABLE 12-5
A corporation randomly selects 150 salespeople and finds that 66% who have never taken a self-improvement course would like such a course. The firm did a similar study 10 years ago in which 60% of a random sample of 160 salespeople wanted a self-improvement course. The groups are assumed to be independent random samples. Let u1 and u2 represent the true proportion of workers who would like to attend a self-improvement course in the recent study and the past study, respectively.
-Referring to Table 12-5, if the firm wanted to test whether this proportion has changed from the previous study, which represents the relevant hypotheses?
A) versus
B) versus
C) versus
D) versus
Unlock Deck
Unlock for access to all 206 flashcards in this deck.
Unlock Deck
k this deck
77
If we use the ?2 method of analysis to test for the differences among 4 proportions, the degrees of freedom are equal to
A) 3.
B) 1.
C) 4.
D) 5.
A) 3.
B) 1.
C) 4.
D) 5.
Unlock Deck
Unlock for access to all 206 flashcards in this deck.
Unlock Deck
k this deck
78
TABLE 12-12
Recent studies have found that American children are more obese than in the past. The amount of time children spent watching television has received much of the blame. A survey of 100 ten-year-olds revealed the following with regards to weights and average number of hours a day spent watching television. We are interested in testing whether the average number of hours spent watching TV and weights are independent at 1% level of significance.
-Referring to Table 12-12, how many children in the survey spend no more than 6 hours watching TV and are more than 10 lbs. underweight?
A) 20
B) 15
C) 10
D) 5
Unlock Deck
Unlock for access to all 206 flashcards in this deck.
Unlock Deck
k this deck
79
TABLE 12-3
A computer used by a 24-hour banking service is supposed to randomly assign each transaction to one of 5 memory locations. A check at the end of a day's transactions gave the counts shown in the table to each of the 5 memory locations, along with the number of reported errors.
The bank manager wanted to test whether the proportion of errors in transactions assigned to each of the 5 memory locations differ.
-Referring to Table 12-3, the degrees of freedom of the test statistic is
A) 10.
B) 4.
C) 8.
D) 448.
Unlock Deck
Unlock for access to all 206 flashcards in this deck.
Unlock Deck
k this deck
80
TABLE 12-9
Four surgical procedures currently are used to install pacemakers. If the patient does not need to return for follow-up surgery the operation is called a "clear" operation. A heart center wants to compare the proportion of clear operations for the 4 procedures, and collects the following numbers of patients from their own records:
They will use this information to test for a difference among the proportion of clear operations using a chi-square test with a level of significance of 0.05.
Referring to Table 12-9, what is the value of the critical range for the Marascuilo procedure to test for the difference in proportions between procedure A and procedure B using a 0.05 level of significance?
Unlock Deck
Unlock for access to all 206 flashcards in this deck.
Unlock Deck
k this deck
Unlock Deck
Unlock for access to all 206 flashcards in this deck.


