Deck 10: Two-Sample Tests
Full screen (f)
Question
Question
Question
Question
Question
Question
Question
Question
Question
Question
Question
Question
Question
Question
Question
Question
Question
Question
Question
Question
Question
Question
Question
Question
Question
Question
Question
Question
Question
TABLE 10-10
The following EXCEL output contains the results of a test to determine if the proportions of satisfied guests at two resorts are the same or different.
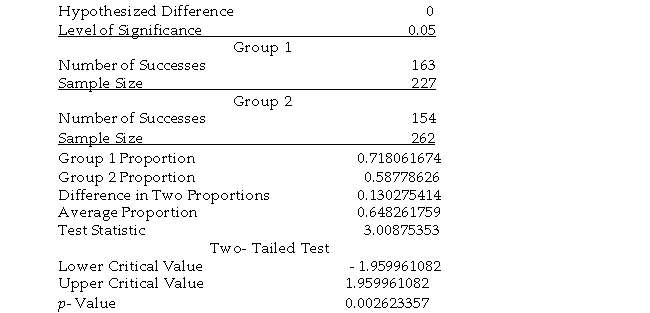
-Referring to Table 10-10, if you want to test the claim that "Resort 1 (Group 1) has a lower proportion of satisfied guests compared to Resort 2 (Group 2)," you will use
A) an F test for the difference between two proportions.
B) a Z-test for the difference between two proportions.
C) a t-test for the difference between two proportions.
D) a ?2 test for the difference between two proportions.
The following EXCEL output contains the results of a test to determine if the proportions of satisfied guests at two resorts are the same or different.
-Referring to Table 10-10, if you want to test the claim that "Resort 1 (Group 1) has a lower proportion of satisfied guests compared to Resort 2 (Group 2)," you will use
A) an F test for the difference between two proportions.
B) a Z-test for the difference between two proportions.
C) a t-test for the difference between two proportions.
D) a ?2 test for the difference between two proportions.
Question
Question
Question
TABLE 10-10
The following EXCEL output contains the results of a test to determine if the proportions of satisfied guests at two resorts are the same or different.

Referring to Table 10-10, if you want to test the claim that "Resort 1 (Group 1) has a higher proportion of satisfied guests compared to Resort 2 (Group 2)," the p-value of the test will be
A) 0.00262/2.
B) 1 - (0.00262/2).
C) 0.00262.
D) 2 × (0.00262).
The following EXCEL output contains the results of a test to determine if the proportions of satisfied guests at two resorts are the same or different.
Referring to Table 10-10, if you want to test the claim that "Resort 1 (Group 1) has a higher proportion of satisfied guests compared to Resort 2 (Group 2)," the p-value of the test will be
A) 0.00262/2.
B) 1 - (0.00262/2).
C) 0.00262.
D) 2 × (0.00262).
Question
Question
Question
Question
Question
Question
Question
Question
Question
Question
Question
Question
Question
Question
Question
Question
Question
Question
Question
Question
Question
Question
Question
Question
Question
Question
Question
Question
Question
Question
Question
Question
Question
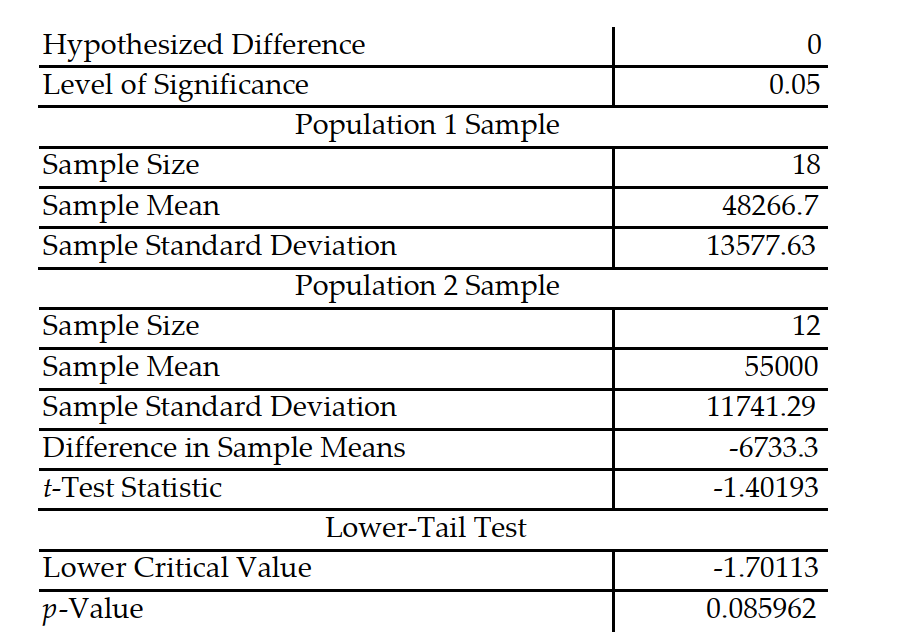
TABLE 10-2
A researcher randomly sampled 30 graduates of an MBA program and recorded data concerning their starting salaries. Of primary interest to the researcher was the effect of gender on starting salaries. Analysis of the mean salaries of the females and males in the sample is given below.
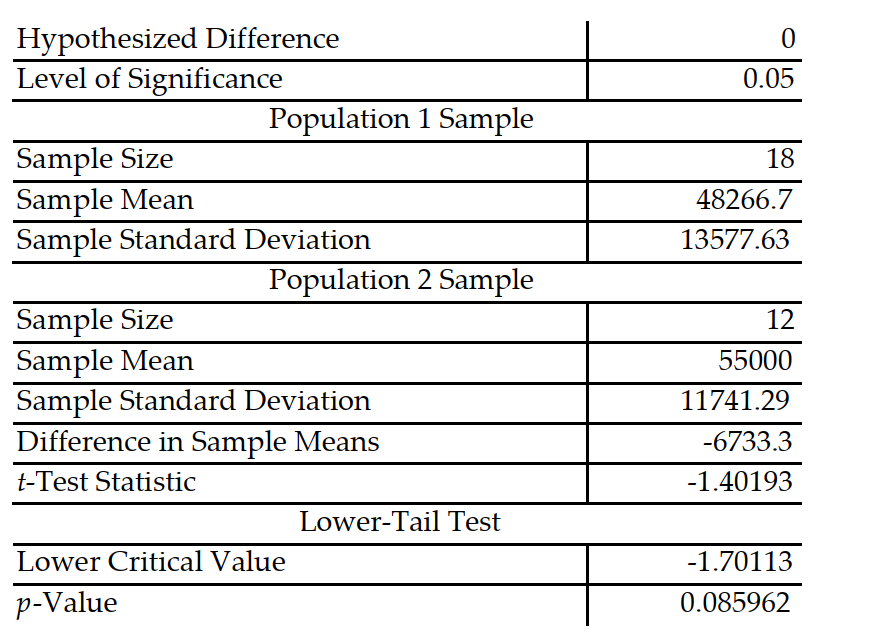
-Referring to Table 10-2, the researcher was attempting to show statistically that the female MBA graduates have a significantly lower mean starting salary than the male MBA graduates. From the analysis in Table 10-2, the correct test statistic is
A) - 6,733.33.
B) - 1.4019.
C) - 1.7011.
D) 0.0860.
A researcher randomly sampled 30 graduates of an MBA program and recorded data concerning their starting salaries. Of primary interest to the researcher was the effect of gender on starting salaries. Analysis of the mean salaries of the females and males in the sample is given below.
-Referring to Table 10-2, the researcher was attempting to show statistically that the female MBA graduates have a significantly lower mean starting salary than the male MBA graduates. From the analysis in Table 10-2, the correct test statistic is
A) - 6,733.33.
B) - 1.4019.
C) - 1.7011.
D) 0.0860.
Question
The following EXCEL output contains the results of a test to determine if the proportions of satisfied guests at two resorts are the same or different.
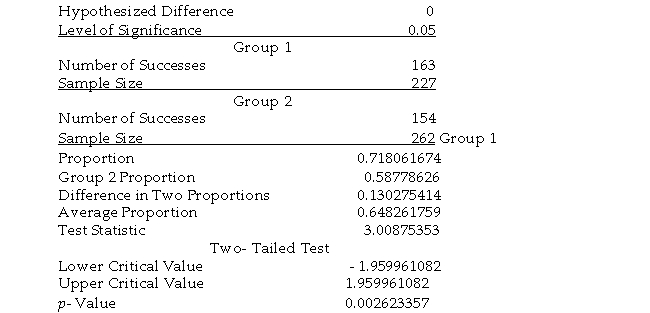
-Referring to Table 10-10, allowing for 0.75% probability of committing a Type I error, what are the decision and conclusion on testing whether there is any difference in the proportions of satisfied guests in the two resorts?
A) Reject the null hypothesis; there is enough evidence to conclude that there is significant difference in the proportions of satisfied guests at the two resorts.
B) Do not reject the null hypothesis; there is enough evidence to conclude that there is significant difference in the proportions of satisfied guests at the two resorts.
C) Reject the null hypothesis; there is not enough evidence to conclude that there is significant difference in the proportions of satisfied guests at the two resorts.
D) Do not reject the null hypothesis; there is not enough evidence to conclude that there is significant difference in the proportions of satisfied guests at the two resorts.
Question
TABLE 10-2
A researcher randomly sampled 30 graduates of an MBA program and recorded data concerning their starting salaries. Of primary interest to the researcher was the effect of gender on starting salaries. Analysis of the mean salaries of the females and males in the sample is given below.
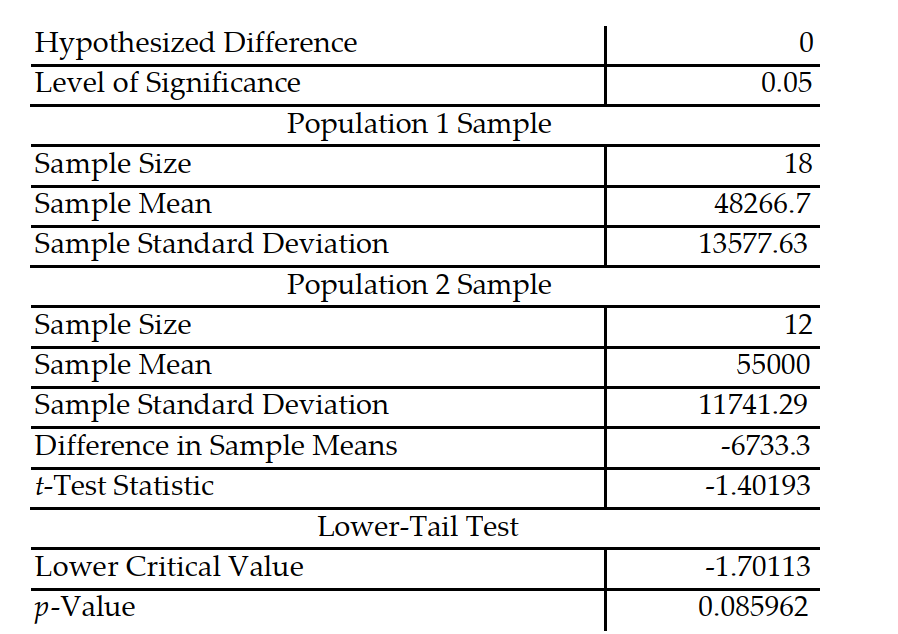
-Referring to Table 10-2, the researcher was attempting to show statistically that the female MBA graduates have a significantly lower mean starting salary than the male MBA graduates. According to the test run, which of the following is an appropriate alternative hypothesis?
A)
B)
C)
D)
A researcher randomly sampled 30 graduates of an MBA program and recorded data concerning their starting salaries. Of primary interest to the researcher was the effect of gender on starting salaries. Analysis of the mean salaries of the females and males in the sample is given below.
-Referring to Table 10-2, the researcher was attempting to show statistically that the female MBA graduates have a significantly lower mean starting salary than the male MBA graduates. According to the test run, which of the following is an appropriate alternative hypothesis?
A)
B)
C)
D)
Question
Question
Question
Question
Question
Question
Question
Question
TABLE 10-2
A researcher randomly sampled 30 graduates of an MBA program and recorded data concerning their starting salaries. Of primary interest to the researcher was the effect of gender on starting salaries. Analysis of the mean salaries of the females and males in the sample is given below.
-Referring to Table 10-2, the researcher was attempting to show statistically that the female MBA graduates have a significantly lower mean starting salary than the male MBA graduates. The proper conclusion for this test is
A) at the ? = 0.10 level, there is sufficient evidence to indicate that females have a lower mean starting salary than male MBA graduates.
B) at the ? = 0.10 level, there is sufficient evidence to indicate a difference in the mean starting salaries of male and female MBA graduates.
C) at the ? = 0.10 level, there is insufficient evidence to indicate any difference in the mean starting salaries of male and female MBA graduates.
D) at the ? = 0.10 level, there is sufficient evidence to indicate that females have a higher mean starting salary than male MBA graduates.
Question
Question
Question
Question
Question

Unlock Deck
Sign up to unlock the cards in this deck!
Unlock Deck
Unlock Deck
1/184
Play
Full screen (f)
Deck 10: Two-Sample Tests
1
In what type of test is the variable of interest the difference between the values of the observations rather than the observations themselves?
A) a test for the difference between the means of two related populations
B) a test for the equality of variances from two independent populations
C) a test for the difference between the means of two independent populations
D) all of the above
A) a test for the difference between the means of two related populations
B) a test for the equality of variances from two independent populations
C) a test for the difference between the means of two independent populations
D) all of the above
A
2
When testing H0 : µ1 - µ2 ? 0 versus H1 : µ1 - µ2 > 0, the observed value of the Z-score was found to be - 2.13. The p-value for this test would be
A) 0.0166.
B) 0.9834.
C) 0.0332.
D) 0.9668.
A) 0.0166.
B) 0.9834.
C) 0.0332.
D) 0.9668.
0.9834.
3
TABLE 10-8
A buyer for a manufacturing plant suspects that his primary supplier of raw materials is overcharging. In order to determine if his suspicion is correct, he contacts a second supplier and asks for the prices on various identical materials. He wants to compare these prices with those of his primary supplier. The data collected is presented in the table below, with some summary statistics presented (all of these might not be necessary to answer the questions which follow). The buyer believes that the differences are normally distributed and will use this sample to perform an appropriate test at a level of significance of 0.01.
-Referring to Table 10-8, the test to perform is a
A) paired t-test for the mean difference.
B) separate-variance t test for differences between two means.
C) pooled-variance t test for differences between two means.
D) Z test for the difference between two means.
paired t-test for the mean difference.
4
If we are testing for the difference between the means of two independent populations presuming equal variances with samples of n1 = 20 and n2= 20, the number of degrees of freedom is equal to
A) 18.
B) 39.
C) 19.
D) 38.
A) 18.
B) 39.
C) 19.
D) 38.
Unlock Deck
Unlock for access to all 184 flashcards in this deck.
Unlock Deck
k this deck
5
TABLE 10-3
The use of preservatives by food processors has become a controversial issue. Suppose 2 preservatives are extensively tested and determined safe for use in meats. A processor wants to compare the preservatives for their effects on retarding spoilage. Suppose 15 cuts of fresh meat are treated with preservative I and 15 are treated with preservative II, and the number of hours until spoilage begins is recorded for each of the 30 cuts of meat. The results are summarized in the table below.
-Referring to Table 10-3, what assumptions are necessary for testing if the population variances differ for preservatives I and II?
A) Both sampled populations are normally distributed.
B) Both samples are random and independent.
C) Neither A nor B is necessary.
D) Both A and B are necessary.
Unlock Deck
Unlock for access to all 184 flashcards in this deck.
Unlock Deck
k this deck
6
TABLE 10-3
The use of preservatives by food processors has become a controversial issue. Suppose 2 preservatives are extensively tested and determined safe for use in meats. A processor wants to compare the preservatives for their effects on retarding spoilage. Suppose 15 cuts of fresh meat are treated with preservative I and 15 are treated with preservative II, and the number of hours until spoilage begins is recorded for each of the 30 cuts of meat. The results are summarized in the table below.
-Referring to Table 10-3, suppose ? = 0.05. Which of the following represents the result of the relevant hypothesis test?
A) The null hypothesis is not rejected.
B) The alternative hypothesis is rejected.
C) The null hypothesis is rejected.
D) Insufficient information exists on which to make a decision.
Unlock Deck
Unlock for access to all 184 flashcards in this deck.
Unlock Deck
k this deck
7
TABLE 10-3
The use of preservatives by food processors has become a controversial issue. Suppose 2 preservatives are extensively tested and determined safe for use in meats. A processor wants to compare the preservatives for their effects on retarding spoilage. Suppose 15 cuts of fresh meat are treated with preservative I and 15 are treated with preservative II, and the number of hours until spoilage begins is recorded for each of the 30 cuts of meat. The results are summarized in the table below.
-Referring to Table 10-3, state the null and alternative hypotheses for testing if the population variances differ for preservatives I and II.
A) H0 : ?0 versus H1 : = 0
B) H0 : ? 0 versus H1 : > 0
C) H0 : ? 0 versus H1 : < 0
D) H0 : = 0 versus H1 : ? 0
Unlock Deck
Unlock for access to all 184 flashcards in this deck.
Unlock Deck
k this deck
8
TABLE 10-5
To test the effectiveness of a business school preparation course, 8 students took a general business test before and after the course. The results are given below.
-Referring to Table 10-5, the value of the standard error of the difference scores is
A) 14.696.
B) 22.991.
C) 65.027.
D) 60.828.
To test the effectiveness of a business school preparation course, 8 students took a general business test before and after the course. The results are given below.
-Referring to Table 10-5, the value of the standard error of the difference scores is
A) 14.696.
B) 22.991.
C) 65.027.
D) 60.828.
Unlock Deck
Unlock for access to all 184 flashcards in this deck.
Unlock Deck
k this deck
9
TABLE 10-4
A real estate company is interested in testing whether, on average, families in Gotham have been living in their current homes for less time than families in Metropolis have. Assume that the two population variances are equal. A random sample of 100 families from Gotham and a random sample of 150 families in Metropolis yield the following data on length of residence in current homes.
Gotham: G = 35 months, sG2 = 900 Metropolis: M = 50 months, sM2 = 1050
-Referring to Table 10-4, suppose ? = 0.01. Which of the following represents the correct conclusion?
A) There is enough evidence that, on average, families in Gotham have been living in their current homes for less time than families in Metropolis have.
B) There is not enough evidence that, on average, families in Gotham have been living in their current homes for less time than families in Metropolis have.
C) There is not enough evidence that, on average, families in Gotham have been living in their current homes for no less time than families in Metropolis have.
D) There is enough evidence that, on average, families in Gotham have been living in their current homes for no less time than families in Metropolis have.
Unlock Deck
Unlock for access to all 184 flashcards in this deck.
Unlock Deck
k this deck
10
The statistical distribution used for testing the difference between two population variances is the______ distribution.
A) standardized normal
B) binomial
C) F
D) t
A) standardized normal
B) binomial
C) F
D) t
Unlock Deck
Unlock for access to all 184 flashcards in this deck.
Unlock Deck
k this deck
11
TABLE 10-11
A corporation randomly selects 150 salespeople and finds that 66% who have never taken a self-improvement course would like such a course. The firm did a similar study 10 years ago in which 60% of a random sample of 160 salespeople wanted a self-improvement course. The groups are assumed to be independent random samples. Let ×and × represent the true proportion of workers who would like to attend a self-improvement course in the recent study and the past study, respectively.
-Referring to Table 10-11, if the firm wanted to test whether this proportion has changed from the previous study, which represents the relevant hypotheses?
A) versus
B) versus
C) versus
D) versus
Unlock Deck
Unlock for access to all 184 flashcards in this deck.
Unlock Deck
k this deck
12
TABLE 10-11
A corporation randomly selects 150 salespeople and finds that 66% who have never taken a self-improvement course would like such a course. The firm did a similar study 10 years ago in which 60% of a random sample of 160 salespeople wanted a self-improvement course. The groups are assumed to be independent random samples. Let ×and × represent the true proportion of workers who would like to attend a self-improvement course in the recent study and the past study, respectively.
Referring to Table 10-11, what is the unbiased point estimate for the difference between the two population proportions?
A) 0.06
B) 0.15
C) 0.10
D) 0.22
Unlock Deck
Unlock for access to all 184 flashcards in this deck.
Unlock Deck
k this deck
13
TABLE 10-14
A problem with a telephone line that prevents a customer from receiving or making calls is disconcerting to both the customer and the telephone company. The data on samples of 20 problems reported to two different offices of a telephone company and the time to clear these problems (in minutes) from the customers' lines are collected. Below is the Excel output to see whether there is evidence of a difference in the mean waiting time between the two offices assuming that the population variances in the two offices are not equal.
-Referring to Table 10-14, suppose ? = 0.05. Which of the following represents the correct conclusion?
A) There is evidence of a difference in the variability of the waiting time between the two offices.
B) There is no evidence that the variability of the waiting time between the two offices are the same.
C) There is no evidence of a difference in the variability of the waiting time between the two offices.
D) There is evidence that the variability of the waiting time between the two offices are the same.
Unlock Deck
Unlock for access to all 184 flashcards in this deck.
Unlock Deck
k this deck
14
TABLE 10-12
The dean of a college is interested in the proportion of graduates from his college who have a job offer on graduation day. He is particularly interested in seeing if there is a difference in this proportion for accounting and economics majors. In a random sample of 100 of each type of major at graduation, he found that 65 accounting majors and 52 economics majors
had job offers. If the accounting majors are designated as "Group 1" and the economics majors are designated as "Group 2," perform the appropriate hypothesis test using a level of significance of 0.05.
-Referring to Table 10-12, the hypotheses the dean should use are
A) versus .
B) versus .
C) versus .
D) versus .
Unlock Deck
Unlock for access to all 184 flashcards in this deck.
Unlock Deck
k this deck
15
The t test for the mean difference between two related populations assumes that the
A) sample variances are equal.
B) population sizes are equal.
C) population of differences is approximately normal or sample sizes are large enough.
D) all of the above
A) sample variances are equal.
B) population sizes are equal.
C) population of differences is approximately normal or sample sizes are large enough.
D) all of the above
Unlock Deck
Unlock for access to all 184 flashcards in this deck.
Unlock Deck
k this deck
16
TABLE 10-4
A real estate company is interested in testing whether, on average, families in Gotham have been living in their current homes for less time than families in Metropolis have. Assume that the two population variances are equal. A random sample of 100 families from Gotham and a random sample of 150 families in Metropolis yield the following data on length of residence in current homes.
Gotham: G = 35 months, sG2 = 900 Metropolis: M = 50 months, sM2 = 1050
-Referring to Table 10-4, what is an unbiased point estimate for the mean of the sampling distribution of the difference between the 2 sample means?
A) -15
B) 0
C) -10
D) -22
Unlock Deck
Unlock for access to all 184 flashcards in this deck.
Unlock Deck
k this deck
17
TABLE 10-11
A corporation randomly selects 150 salespeople and finds that 66% who have never taken a self-improvement course would like such a course. The firm did a similar study 10 years ago in which 60% of a random sample of 160 salespeople wanted a self-improvement course. The groups are assumed to be independent random samples. Let ×and × represent the true proportion of workers who would like to attend a self-improvement course in the recent study and the past study, respectively.
-Referring to Table 10-11, what is the estimated standard error of the difference between the two sample proportions?
A) 0.055
B) 0
C) 0.500
D) 0.629
Unlock Deck
Unlock for access to all 184 flashcards in this deck.
Unlock Deck
k this deck
18
TABLE 10-4
A real estate company is interested in testing whether, on average, families in Gotham have been living in their current homes for less time than families in Metropolis have. Assume that the two population variances are equal. A random sample of 100 families from Gotham and a random sample of 150 families in Metropolis yield the following data on length of residence in current homes.
Gotham: G = 35 months, sG2 = 900 Metropolis: M = 50 months, sM2 = 1050
-Referring to Table 10-4, what is(are) the critical value(s) of the relevant hypothesis test if the level of significance is 0.01?
A) t ? Z = ±1.96
B) t ? Z = - 1.96
C) t ? Z = - 2.080
D) t ? Z = - 2.33
Unlock Deck
Unlock for access to all 184 flashcards in this deck.
Unlock Deck
k this deck
19
TABLE 10-11
A corporation randomly selects 150 salespeople and finds that 66% who have never taken a self-improvement course would like such a course. The firm did a similar study 10 years ago in which 60% of a random sample of 160 salespeople wanted a self-improvement course. The groups are assumed to be independent random samples. Let ×and × represent the true proportion of workers who would like to attend a self-improvement course in the recent study and the past study, respectively.
-Referring to Table 10-11, what is/are the critical value(s) when testing whether population proportions are different if ? = 0.10?
A) -1.96
B) ±1.645
C) ±2.08
D) ±1.96
Unlock Deck
Unlock for access to all 184 flashcards in this deck.
Unlock Deck
k this deck
20
TABLE 10-14
A problem with a telephone line that prevents a customer from receiving or making calls is disconcerting to both the customer and the telephone company. The data on samples of 20 problems reported to two different offices of a telephone company and the time to clear these problems (in minutes) from the customers' lines are collected. Below is the Excel output to see whether there is evidence of a difference in the mean waiting time between the two offices assuming that the population variances in the two offices are not equal.
-Referring to Table 10-14, suppose ? = 0.05. Which of the following represents the correct conclusion?
A) There is enough evidence that the mean waiting time between the two offices are the same.
B) There is not enough evidence that the mean waiting time between the two offices are the same.
C) There is enough evidence of a difference in the mean waiting time between the two offices.
D) There is not enough evidence of a difference in the mean waiting time between the two offices.
Unlock Deck
Unlock for access to all 184 flashcards in this deck.
Unlock Deck
k this deck
21
When testing H0 : µ1 - µ2 = 0 versus H1 : µ1 - µ2 × 0, the observed value of the Z-score was found to be - 2.13. The p-value for this test would be
A) 0.9834.
B) 0.0332.
C) 0.0166.
D) 0.9668.
A) 0.9834.
B) 0.0332.
C) 0.0166.
D) 0.9668.
Unlock Deck
Unlock for access to all 184 flashcards in this deck.
Unlock Deck
k this deck
22
TABLE 10-14
A problem with a telephone line that prevents a customer from receiving or making calls is disconcerting to both the customer and the telephone company. The data on samples of 20 problems reported to two different offices of a telephone company and the time to clear these problems (in minutes) from the customers' lines are collected. Below is the Excel output to see whether there is evidence of a difference in the mean waiting time between the two offices assuming that the population variances in the two offices are not equal.
-Referring to Table 10-14, what assumptions are necessary for testing if there is evidence of a difference in the variability of the waiting time between the two offices to be valid?
A) Both samples are random and independent.
B) Both sampled populations are normally distributed.
C) Neither A nor B is necessary.
D) Both A and B are necessary.
Unlock Deck
Unlock for access to all 184 flashcards in this deck.
Unlock Deck
k this deck
23
TABLE 10-5
To test the effectiveness of a business school preparation course, 8 students took a general business test before and after the course. The results are given below.
-Referring to Table 10-5, at the 0.05 level of significance, the decision for this hypothesis test would be
A) reject the null hypothesis.
B) reject the alternative hypothesis.
C) do not reject the null hypothesis.
D) It cannot be determined from the information given.
Unlock Deck
Unlock for access to all 184 flashcards in this deck.
Unlock Deck
k this deck
24
TABLE 10-14
A problem with a telephone line that prevents a customer from receiving or making calls is disconcerting to both the customer and the telephone company. The data on samples of 20 problems reported to two different offices of a telephone company and the time to clear these problems (in minutes) from the customers' lines are collected. Below is the Excel output to see whether there is evidence of a difference in the mean waiting time between the two offices assuming that the population variances in the two offices are not equal.
-Referring to Table 10-14, suppose ? = 0.05. Which of the following represents the result of the relevant hypothesis test?
A) The null hypothesis is rejected.
B) The null hypothesis is not rejected.
C) The alternative hypothesis is rejected.
D) Insufficient information exists on which to make a decision.
Unlock Deck
Unlock for access to all 184 flashcards in this deck.
Unlock Deck
k this deck
25
TABLE 10-11
A corporation randomly selects 150 salespeople and finds that 66% who have never taken a self-improvement course would like such a course. The firm did a similar study 10 years ago in which 60% of a random sample of 160 salespeople wanted a self-improvement course. The groups are assumed to be independent random samples. Let ×and × represent the true proportion of workers who would like to attend a self-improvement course in the recent study and the past study, respectively.
-Referring to Table 10-11, what is the value of the test statistic to use in evaluating the alternative hypothesis that there is a difference in the two population proportions?
A) 0
B) 4.335
C) 1.96
D) 1.093
Unlock Deck
Unlock for access to all 184 flashcards in this deck.
Unlock Deck
k this deck
26
TABLE 10-5
To test the effectiveness of a business school preparation course, 8 students took a general business test before and after thecourse. The results are given below
-Referring to Table 10-11, if the firm wanted to test whether a greater proportion of workers would currently like to attend a self-improvement course than in the past, which represents the relevant hypotheses?
A) versus
B) versus
C) versus
D) versus
Unlock Deck
Unlock for access to all 184 flashcards in this deck.
Unlock Deck
k this deck
27
TABLE 10-9
A few years ago, Pepsi invited consumers to take the "Pepsi Challenge." Consumers were asked to decide which of two sodas, Coke or Pepsi, they preferred in a blind taste test. Pepsi was interested in determining what factors played a role in people's taste preferences. One of the factors studied was the gender of the consumer. Below are the results of analyses comparing the taste preferences of men and women with the proportions depicting preference for Pepsi.
Males: Females:
-Referring to Table 10-9, suppose Pepsi wanted to test to determine if the males preferred Pepsi less than the females. Using the test statistic given, compute the appropriate p-value for the test.
A) 0.0170
B) 0.0340
C) 0.9830
D) 0.9660
Unlock Deck
Unlock for access to all 184 flashcards in this deck.
Unlock Deck
k this deck
28
To test the effectiveness of a business school preparation course, 8 students took a general business test before and after the course. The results are given below.
-Referring to Table 10-5, the value of the sample mean difference is ______if the difference scores reflect the results of the exam after the course minus the results of the exam before the course.
A) 50
B) 400
C) 68
D) 0
-Referring to Table 10-5, the value of the sample mean difference is ______if the difference scores reflect the results of the exam after the course minus the results of the exam before the course.
A) 50
B) 400
C) 68
D) 0
Unlock Deck
Unlock for access to all 184 flashcards in this deck.
Unlock Deck
k this deck
29
TABLE 10-10
The following EXCEL output contains the results of a test to determine if the proportions of satisfied guests at two resorts are the same or different.
-Referring to Table 10-10, if you want to test the claim that "Resort 1 (Group 1) has a lower proportion of satisfied guests compared to Resort 2 (Group 2)," you will use
A) an F test for the difference between two proportions.
B) a Z-test for the difference between two proportions.
C) a t-test for the difference between two proportions.
D) a ?2 test for the difference between two proportions.
Unlock Deck
Unlock for access to all 184 flashcards in this deck.
Unlock Deck
k this deck
30
TABLE 10-4
A real estate company is interested in testing whether, on average, families in Gotham have been living in their current homes for less time than families in Metropolis have. Assume that the two population variances are equal. A random sample of 100 families from Gotham and a random sample of 150 families in Metropolis yield the following data on length of residence in current homes.
-Referring to Table 10-4, what is the estimated standard error of the difference between the 2 sample means?
A) 8.01
B) 5.61
C) 16.00
D) 4.06
Unlock Deck
Unlock for access to all 184 flashcards in this deck.
Unlock Deck
k this deck
31
A real estate company is interested in testing whether, on average, families in Gotham have been living in their current homes for less time than families in Metropolis have. Assume that the two population variances are equal. A random sample of 100 families from Gotham and a random sample of 150 families in Metropolis yield the following data on length of residence in current homes.
-Referring to Table 10-4, suppose ? = 0.01. Which of the following represents the result of the relevant hypothesis test?
A) The alternative hypothesis is rejected.
B) The null hypothesis is not rejected.
C) The null hypothesis is rejected.
D) Insufficient information exists on which to make a decision.
Unlock Deck
Unlock for access to all 184 flashcards in this deck.
Unlock Deck
k this deck
32
TABLE 10-10
The following EXCEL output contains the results of a test to determine if the proportions of satisfied guests at two resorts are the same or different.
Referring to Table 10-10, if you want to test the claim that "Resort 1 (Group 1) has a higher proportion of satisfied guests compared to Resort 2 (Group 2)," the p-value of the test will be
A) 0.00262/2.
B) 1 - (0.00262/2).
C) 0.00262.
D) 2 × (0.00262).
Unlock Deck
Unlock for access to all 184 flashcards in this deck.
Unlock Deck
k this deck
33
TABLE 10-14
A problem with a telephone line that prevents a customer from receiving or making calls is disconcerting to both the customer and the telephone company. The data on samples of 20 problems reported to two different offices of a telephone company and the time to clear these problems (in minutes) from the customers' lines are collected. Below is the Excel output to see whether there is evidence of a difference in the mean waiting time between the two offices assuming that the population variances in the two offices are not equal.
-Referring to Table 10-14, suppose ? = 0.1. Which of the following represents the correct conclusion?
A) There is not enough evidence of a difference in the mean waiting time between the two offices.
B) There is enough evidence of a difference in the mean waiting time between the two offices.
C) There is enough evidence that the mean waiting time between the two offices are the same.
D) There is not enough evidence that the mean waiting time between the two offices are the same.
Unlock Deck
Unlock for access to all 184 flashcards in this deck.
Unlock Deck
k this deck
34
A real estate company is interested in testing whether, on average, families in Gotham have been living in their current homes for less time than families in Metropolis have. Assume that the two population variances are equal. A random sample of 100 families from Gotham and a random sample of 150 families in Metropolis yield the following data on length of residence in current homes.
-Referring to Table 10-4, suppose ? = 0.05. Which of the following represents the result of the relevant hypothesis test?
A) The null hypothesis is rejected.
B) The alternative hypothesis is rejected.
C) The null hypothesis is not rejected.
D) Insufficient information exists on which to make a decision.
Unlock Deck
Unlock for access to all 184 flashcards in this deck.
Unlock Deck
k this deck
35
TABLE 10-4
A real estate company is interested in testing whether, on average, families in Gotham have been living in their current homes for less time than families in Metropolis have. Assume that the two population variances are equal. A random sample of 100 families from Gotham and a random sample of 150 families in Metropolis yield the following data on length of residence in current homes.
-Referring to Table 10-4, what is(are) the critical value(s) of the relevant hypothesis test if the level of significance is 0.05?
A) t ? Z = - 2.080
B) t ? Z = - 1.96
C) t ? Z = - 1.645
D) t ? Z = ±1.96
Unlock Deck
Unlock for access to all 184 flashcards in this deck.
Unlock Deck
k this deck
36
When testing for the difference between two population variances with sample sizes of n1 = 8 and n2 = 10, the number of degrees of freedom are
A) 7 and 9.
B) 18.
C) 16.
D) 8 and 10.
A) 7 and 9.
B) 18.
C) 16.
D) 8 and 10.
Unlock Deck
Unlock for access to all 184 flashcards in this deck.
Unlock Deck
k this deck
37
TABLE 10-5
To test the effectiveness of a business school preparation course, 8 students took a general business test before and after thecourse. The results are given below
-Referring to Table 10-5, what is the critical value for testing at the 5% level of significance whether the business school preparation course is effective in improving exam scores?
A) 1.895
B) 2.365
C) 2.145
D) 1.761
Unlock Deck
Unlock for access to all 184 flashcards in this deck.
Unlock Deck
k this deck
38
A few years ago, Pepsi invited consumers to take the "Pepsi Challenge." Consumers were asked to decide which of two sodas, Coke or Pepsi, they preferred in a blind taste test. Pepsi was interested in determining what factors played a role in people's taste preferences. One of the factors studied was the gender of the consumer. Below are the results of analyses comparing the taste preferences of men and women with the proportions depicting preference for Pepsi.
Males: Females:
-Referring to Table 10-9, suppose Pepsi wanted to test to determine if the males preferred Pepsi more than the females. Using the test statistic given, compute the appropriate p-value for the test.
A) 0.2119
B) 0.0171
C) 0.4681
D) 0.0340
Males: Females:
-Referring to Table 10-9, suppose Pepsi wanted to test to determine if the males preferred Pepsi more than the females. Using the test statistic given, compute the appropriate p-value for the test.
A) 0.2119
B) 0.0171
C) 0.4681
D) 0.0340
Unlock Deck
Unlock for access to all 184 flashcards in this deck.
Unlock Deck
k this deck
39
In testing for differences between the means of two related populations, the null hypothesis is
A) H0 : µD < 0.
B) H0 : µD > 0.
C) H0 : µD = 0.
D) H0 : µD = 2.
A) H0 : µD < 0.
B) H0 : µD > 0.
C) H0 : µD = 0.
D) H0 : µD = 2.
Unlock Deck
Unlock for access to all 184 flashcards in this deck.
Unlock Deck
k this deck
40
In testing for the differences between the means of two independent populations where the variances in each population are unknown but assumed equal, the degrees of freedom are
A) n - 1.
B) n - 2.
C) n1 + n2 - 1.
D) n1 + n2 - 2.
A) n - 1.
B) n - 2.
C) n1 + n2 - 1.
D) n1 + n2 - 2.
Unlock Deck
Unlock for access to all 184 flashcards in this deck.
Unlock Deck
k this deck
41
TABLE 10-14
A problem with a telephone line that prevents a customer from receiving or making calls is disconcerting to both the customer and the telephone company. The data on samples of 20 problems reported to two different offices of a telephone company and the time to clear these problems (in minutes) from the customers' lines are collected. Below is the Excel output to see whether there is evidence of a difference in the mean waiting time between the two offices assuming that the population variances in the two offices are not equal.
-Referring to Table 10-14, what is(are) the critical value(s) of the relevant hypothesis test if the level of significance is 0.10?
A) 1.6860
B) ±2.0244
C) 2.0244
D) ±1.6860
Unlock Deck
Unlock for access to all 184 flashcards in this deck.
Unlock Deck
k this deck
42
The Wall Street Journal recently ran an article indicating differences in perception of sexual harassment on the job between men and women. The article claimed that women perceived the problem to be much more prevalent than did men. One question asked of both men and women was: "Do you think sexual harassment is a major problem in the American workplace?" Some 24% of the men compared to 62% of the women responded "Yes." Assuming W designates women's responses and M designates men's, what hypothesis should The Wall Street Journal test in order to show that its claim is true?
A) versus
B) versus
C) versus
D) versus
A) versus
B) versus
C) versus
D) versus
Unlock Deck
Unlock for access to all 184 flashcards in this deck.
Unlock Deck
k this deck
43
TABLE 10-14
A problem with a telephone line that prevents a customer from receiving or making calls is disconcerting to both the customer and the telephone company. The data on samples of 20 problems reported to two different offices of a telephone company and the time to clear these problems (in minutes) from the customers' lines are collected. Below is the Excel output to see whether there is evidence of a difference in the mean waiting time between the two offices assuming that the population variances in the two offices are not equal.
-Referring to Table 10-14, what is the standardized value of the estimate of the mean of the sampling distribution for the difference between sample means?
A) 2.0115
B) 0.3544
C) 2.2140
D) 0.2025
Unlock Deck
Unlock for access to all 184 flashcards in this deck.
Unlock Deck
k this deck
44
Given the following information, calculate sp2, the pooled sample variance that should be used in the pooled-variance t test.
A)
B)
C)
D)
A)
B)
C)
D)
Unlock Deck
Unlock for access to all 184 flashcards in this deck.
Unlock Deck
k this deck
45
TABLE 10-14
A problem with a telephone line that prevents a customer from receiving or making calls is disconcerting to both the customer and the telephone company. The data on samples of 20 problems reported to two different offices of a telephone company and the time to clear these problems (in minutes) from the customers' lines are collected. Below is the Excel output to see whether there is evidence of a difference in the mean waiting time between the two offices assuming that the population variances in the two offices are not equal.
-Referring to Table 10-14, what is the smallest level of significance at which the null hypothesis will still not be rejected?
A) 0.05
B) 0.3625
C) 0.7250
D) 0.10
Unlock Deck
Unlock for access to all 184 flashcards in this deck.
Unlock Deck
k this deck
46
TABLE 10-4
A real estate company is interested in testing whether, on average, families in Gotham have been living in their current homes for less time than families in Metropolis have. Assume that the two population variances are equal. A random sample of 100 families from Gotham and a random sample of 150 families in Metropolis yield the following data on length of residence in current homes.
-Referring to Table 10-4, suppose ? = 0.1. Which of the following represents the correct conclusion?
A) There is not enough evidence that, on average, families in Gotham have been living in their current homes for no less time than families in Metropolis have.
B) There is enough evidence that, on average, families in Gotham have been living in their current homes for less time than families in Metropolis have.
C) There is not enough evidence that, on average, families in Gotham have been living in their current homes for less time than families in Metropolis have.
D) There is enough evidence that, on average, families in Gotham have been living in their current homes for no less time than families in Metropolis have.
Unlock Deck
Unlock for access to all 184 flashcards in this deck.
Unlock Deck
k this deck
47
TABLE 10-4
A real estate company is interested in testing whether, on average, families in Gotham have been living in their current homes for less time than families in Metropolis have. Assume that the two population variances are equal. A random sample of 100 families from Gotham and a random sample of 150 families in Metropolis yield the following data on length of residence in current homes.
-Referring to Table 10-4, which of the following represents the relevant hypotheses tested by the real estate company?
A) versus
B) versus
C) versus
D) versus
Unlock Deck
Unlock for access to all 184 flashcards in this deck.
Unlock Deck
k this deck
48
TABLE 10-5
To test the effectiveness of a business school preparation course, 8 students took a general business test before and after the course. The results are given below.
-Referring to Table 10-5, at the 0.05 level of significance, the conclusion for this hypothesis test would be
A) the business school preparation course does not improve exam score.
B) the business school preparation course has no impact on exam score.
C) the business school preparation course does improve exam score.
D) It cannot be drawn from the information given.
Unlock Deck
Unlock for access to all 184 flashcards in this deck.
Unlock Deck
k this deck
49
TABLE 10-4
A real estate company is interested in testing whether, on average, families in Gotham have been living in their current homes for less time than families in Metropolis have. Assume that the two population variances are equal. A random sample of 100 families from Gotham and a random sample of 150 families in Metropolis yield the following data on length of residence in current homes.
-Referring to Table 10-4, what is the standardized value of the estimate of the mean of the sampling distribution of the difference between sample means?
A) -8.75
B) -1.96
C) -3.69
D) -2.33
Unlock Deck
Unlock for access to all 184 flashcards in this deck.
Unlock Deck
k this deck
50
A buyer for a manufacturing plant suspects that his primary supplier of raw materials is overcharging. In order to determine if his suspicion is correct, he contacts a second supplier and asks for the prices on various identical materials. He wants to compare these prices with those of his primary supplier. The data collected is presented in the table below, with some summary statistics presented (all of these might not be necessary to answer the questions which follow). The buyer believes that the differences are normally distributed and will use this sample to perform an appropriate test at a level of significance of 0.01.
-Referring to Table 10-8, the buyer should decide that the primary supplier is
A) overcharging because there is insufficient evidence to prove otherwise.
B) overcharging because there is strong evidence that this is the case.
C) not overcharging because there is insufficient evidence to prove otherwise.
D) not overcharging because there is strong evidence to prove otherwise.
Unlock Deck
Unlock for access to all 184 flashcards in this deck.
Unlock Deck
k this deck
51
A powerful women's group has claimed that men and women differ in attitudes about sexual discrimination. A group of 50 men (group 1) and 40 women (group 2) were asked if they thought sexual discrimination is a problem in the United States. Of those sampled, 11 of the men and 19 of the women did believe that sexual discrimination is a problem. Find the value of the test statistic.
A) Z = - 2.55
B) Z = - 1.05
C) Z = - 1.20
D) Z = - 0.85
A) Z = - 2.55
B) Z = - 1.05
C) Z = - 1.20
D) Z = - 0.85
Unlock Deck
Unlock for access to all 184 flashcards in this deck.
Unlock Deck
k this deck
52
TABLE 10-11
A corporation randomly selects 150 salespeople and finds that 66% who have never taken a self-improvement course would like such a course. The firm did a similar study 10 years ago in which 60% of a random sample of 160 salespeople wanted a self-improvement course. The groups are assumed to be independent random samples. Let ×and × represent the true proportion of workers who would like to attend a self-improvement course in the recent study and the past study, respectively.
-Referring to Table 10-11, what is/are the critical value(s) when testing whether the current population proportion is higher than before if ? = 0.05?
A) + 1.96
B) ±1.96
C) ±1.645
D) + 1.645
Unlock Deck
Unlock for access to all 184 flashcards in this deck.
Unlock Deck
k this deck
53
In testing for differences between the means of two independent populations, the null hypothesis is
A) H0 : µ1 - µ2 < 2.
B) H0 : µ1 - µ2 = 2.
C) H0 : µ1 - µ2 = 0.
D) H0 : µ1 - µ2 > 0.
A) H0 : µ1 - µ2 < 2.
B) H0 : µ1 - µ2 = 2.
C) H0 : µ1 - µ2 = 0.
D) H0 : µ1 - µ2 > 0.
Unlock Deck
Unlock for access to all 184 flashcards in this deck.
Unlock Deck
k this deck
54
TABLE 10-14
A problem with a telephone line that prevents a customer from receiving or making calls is disconcerting to both the customer and the telephone company. The data on samples of 20 problems reported to two different offices of a telephone company and the time to clear these problems (in minutes) from the customers' lines are collected. Below is the Excel output to see whether there is evidence of a difference in the mean waiting time between the two offices assuming that the population variances in the two offices are not equal.
-Referring to Table 10-14, which of the following represents the relevant hypotheses tested by the telephone company?
A) versus
B) versus
C) versus
D) versus
Unlock Deck
Unlock for access to all 184 flashcards in this deck.
Unlock Deck
k this deck
55
A corporation randomly selects 150 salespeople and finds that 66% who have never taken a self-improvement course would like such a course. The firm did a similar study 10 years ago in which 60% of a random sample of 160 salespeople wanted a self-improvement course. The groups are assumed to be independent random samples. Let ×and × represent the true proportion of workers who would like to attend a self-improvement course in the recent study and the past study, respectively.
-Referring to Table 10-11, the company tests to determine at the 0.05 level whether the population proportion has changed from the previous study. Which of the following is most correct?
A) Reject the null hypothesis and conclude that the proportion of employees who are interested in a self-improvement course has changed over the intervening 10 years.
B) Do not reject the null hypothesis and conclude that the proportion of employees who are interested in a self-improvement course has increased over the intervening 10 years.
C) Reject the null hypothesis and conclude that the proportion of employees who are interested in a self-improvement course has increased over the intervening 10 years.
D) Do not reject the null hypothesis and conclude that the proportion of employees who are interested in a self-improvement course has not changed over the intervening 10 years.
Unlock Deck
Unlock for access to all 184 flashcards in this deck.
Unlock Deck
k this deck
56
TABLE 10-1
Are Japanese managers more motivated than American managers? A randomly selected group of each were administered
the Sarnoff Survey of Attitudes Toward Life (SSATL), which measures motivation for upward mobility. The SSATL scores are summarized below.
-Referring to Table 10-1, judging from the way the data were collected, which test would likely be most appropriate to employ?
A) related samples Z test for the mean difference
B) paired t test
C) pooled-variance t test for the difference between two means
D) independent samples Z test for the difference between two means
Unlock Deck
Unlock for access to all 184 flashcards in this deck.
Unlock Deck
k this deck
57
The test for the equality of two population variances is based on
A) the ratio of the two sample variances.
B) the difference between the sample variances divided by the difference between the sample means.
C) the difference between the two population variances.
D) the difference between the two sample variances.
A) the ratio of the two sample variances.
B) the difference between the sample variances divided by the difference between the sample means.
C) the difference between the two population variances.
D) the difference between the two sample variances.
Unlock Deck
Unlock for access to all 184 flashcards in this deck.
Unlock Deck
k this deck
58
TABLE 10-9
A few years ago, Pepsi invited consumers to take the "Pepsi Challenge." Consumers were asked to decide which of two sodas, Coke or Pepsi, they preferred in a blind taste test. Pepsi was interested in determining what factors played a role in people's taste preferences. One of the factors studied was the gender of the consumer. Below are the results of analyses comparing the taste preferences of men and women with the proportions depicting preference for Pepsi.
Males: Females:
-Referring to Table 10-9, to determine if a difference exists in the taste preferences of men and women, give the correct alternative hypothesis that Pepsi would test.
A)
B)
C)
D)
Unlock Deck
Unlock for access to all 184 flashcards in this deck.
Unlock Deck
k this deck
59
TABLE 10-5 To test the effectiveness of a business school preparation course, 8 students took a general business test before and after the course. The results are given below.
-Referring to Table 10-5, the number of degrees of freedom is
A) 14.
B) 13.
C) 7.
D) 8.
-Referring to Table 10-5, the number of degrees of freedom is
A) 14.
B) 13.
C) 7.
D) 8.
Unlock Deck
Unlock for access to all 184 flashcards in this deck.
Unlock Deck
k this deck
60
The Wall Street Journal recently ran an article indicating differences in perception of sexual harassment on the job between men and women. The article claimed that women perceived the problem to be much more prevalent than did men. One question asked to both men and women was: "Do you think sexual harassment is a major problem in the American workplace?" Some 24% of the men compared to 62% of the women responded "Yes." Suppose that 150 women and 200 men were interviewed. What is the value of the test statistic?
A) 7.106
B) 6.635
C) 7.173
D) 2.33
A) 7.106
B) 6.635
C) 7.173
D) 2.33
Unlock Deck
Unlock for access to all 184 flashcards in this deck.
Unlock Deck
k this deck
61
Moving companies are required by the government to publish a Carrier Performance Report each year. One of the descriptive statistics they must include is the annual percentage of shipments on which a $50 or greater claim for loss or damage was filed. Suppose two companies, Econo-Move and On-the-Move, each decide to estimate this figure by sampling their records, and they report the data shown in the following table. The owner of On-the-Move is hoping to use these data to show that the company is superior to Econo-Move with regard to the percentage of claims filed. Which test would be used to properly analyze the data in this experiment?
A) Z test for the difference between two means
B) separate variance t test for the difference between two means
C) F test for the difference between two variances
D) Z test for the difference between two proportions
A) Z test for the difference between two means
B) separate variance t test for the difference between two means
C) F test for the difference between two variances
D) Z test for the difference between two proportions
Unlock Deck
Unlock for access to all 184 flashcards in this deck.
Unlock Deck
k this deck
62
TABLE 10-14
A problem with a telephone line that prevents a customer from receiving or making calls is disconcerting to both the customer and the telephone company. The data on samples of 20 problems reported to two different offices of a telephone company and the time to clear these problems (in minutes) from the customers' lines are collected. Below is the Excel output to see whether there is evidence of a difference in the mean waiting time between the two offices assuming that the population variances in the two offices are not equal.
-Referring to Table 10-14, state the null and alternative hypotheses for testing if there is evidence of a difference in the variability of the waiting time between the two offices.
A) versus
B) versus
C) versus
D) versus
Unlock Deck
Unlock for access to all 184 flashcards in this deck.
Unlock Deck
k this deck
63
In testing for differences between the means of two related populations where the variance of the differences is unknown, the degrees of freedom are
A) n - 1.
B) n1 + n2 - 2.
C) n1 + n2 - 1.
D) n - 2.
A) n - 1.
B) n1 + n2 - 2.
C) n1 + n2 - 1.
D) n - 2.
Unlock Deck
Unlock for access to all 184 flashcards in this deck.
Unlock Deck
k this deck
64
TABLE 10-11
A corporation randomly selects 150 salespeople and finds that 66% who have never taken a self-improvement course would like such a course. The firm did a similar study 10 years ago in which 60% of a random sample of 160 salespeople wanted a self-improvement course. The groups are assumed to be independent random samples. Let ×and × represent the true proportion of workers who would like to attend a self-improvement course in the recent study and the past study, respectively.
-Referring to Table 10-11, what is/are the critical value(s) when performing a Z test on whether population proportions are different if ? = 0.05?
A) ±1.645
B) ±2.08
C) ±1.96
D) -1.96
Unlock Deck
Unlock for access to all 184 flashcards in this deck.
Unlock Deck
k this deck
65
TABLE 10-2
A researcher randomly sampled 30 graduates of an MBA program and recorded data concerning their starting salaries. Of primary interest to the researcher was the effect of gender on starting salaries. Analysis of the mean salaries of the females and males in the sample is given below.
-Referring to Table 10-2, the researcher was attempting to show statistically that the female MBA graduates have a significantly lower mean starting salary than the male MBA graduates. From the analysis in Table 10-2, the correct test statistic is
A) - 6,733.33.
B) - 1.4019.
C) - 1.7011.
D) 0.0860.
Unlock Deck
Unlock for access to all 184 flashcards in this deck.
Unlock Deck
k this deck
66
The following EXCEL output contains the results of a test to determine if the proportions of satisfied guests at two resorts are the same or different.
-Referring to Table 10-10, allowing for 0.75% probability of committing a Type I error, what are the decision and conclusion on testing whether there is any difference in the proportions of satisfied guests in the two resorts?
A) Reject the null hypothesis; there is enough evidence to conclude that there is significant difference in the proportions of satisfied guests at the two resorts.
B) Do not reject the null hypothesis; there is enough evidence to conclude that there is significant difference in the proportions of satisfied guests at the two resorts.
C) Reject the null hypothesis; there is not enough evidence to conclude that there is significant difference in the proportions of satisfied guests at the two resorts.
D) Do not reject the null hypothesis; there is not enough evidence to conclude that there is significant difference in the proportions of satisfied guests at the two resorts.
Unlock Deck
Unlock for access to all 184 flashcards in this deck.
Unlock Deck
k this deck
67
TABLE 10-2
A researcher randomly sampled 30 graduates of an MBA program and recorded data concerning their starting salaries. Of primary interest to the researcher was the effect of gender on starting salaries. Analysis of the mean salaries of the females and males in the sample is given below.
-Referring to Table 10-2, the researcher was attempting to show statistically that the female MBA graduates have a significantly lower mean starting salary than the male MBA graduates. According to the test run, which of the following is an appropriate alternative hypothesis?
A)
B)
C)
D)
Unlock Deck
Unlock for access to all 184 flashcards in this deck.
Unlock Deck
k this deck
68
TABLE 10-9
A few years ago, Pepsi invited consumers to take the "Pepsi Challenge." Consumers were asked to decide which of two sodas, Coke or Pepsi, they preferred in a blind taste test. Pepsi was interested in determining what factors played a role in people's taste preferences. One of the factors studied was the gender of the consumer. Below are the results of analyses comparing the taste preferences of men and women with the proportions depicting preference for Pepsi.
Males: Females:
-Referring to Table 10-9, suppose that the two-tailed p-value was really 0.0734. State the proper conclusion.
A) At ? = 0.05, there is sufficient evidence to indicate the proportion of males preferring Pepsi differs from the proportion of females preferring Pepsi.
B) At ? = 0.08, there is insufficient evidence to indicate the proportion of males preferring Pepsi differs from the proportion of females preferring Pepsi.
C) At ? = 0.10, there is sufficient evidence to indicate the proportion of males preferring Pepsi differs from the proportion of females preferring Pepsi.
D) At ? = 0.05, there is sufficient evidence to indicate the proportion of males preferring Pepsi equals the proportion of females preferring Pepsi.
Unlock Deck
Unlock for access to all 184 flashcards in this deck.
Unlock Deck
k this deck
69
TABLE 10-14
A problem with a telephone line that prevents a customer from receiving or making calls is disconcerting to both the customer and the telephone company. The data on samples of 20 problems reported to two different offices of a telephone company and the time to clear these problems (in minutes) from the customers' lines are collected. Below is the Excel output to see whether there is evidence of a difference in the mean waiting time between the two offices assuming that the population variances in the two offices are not equal.
-Referring to Table 10-14, what is the value of the test statistic?
A) 2.0115
B) 0.3544
C) 2.2140
D) 0.2025
Unlock Deck
Unlock for access to all 184 flashcards in this deck.
Unlock Deck
k this deck
70
A powerful women's group has claimed that men and women differ in attitudes about sexual discrimination. A group of 50 men (group 1) and 40 women (group 2) were asked if they thought sexual discrimination is a problem in the United States. Of those sampled, 11 of the men and 19 of the women did believe that sexual discrimination is a problem. If the p-value turns out to be 0.035 (which is not the real value in this data set), then
A) at α = 0.03, we should reject H0.
B) at α = 0.05, we should fail to reject H0.
C) at α = 0.04, we should reject H0.
D) None of the above would be correct statements.
A) at α = 0.03, we should reject H0.
B) at α = 0.05, we should fail to reject H0.
C) at α = 0.04, we should reject H0.
D) None of the above would be correct statements.
Unlock Deck
Unlock for access to all 184 flashcards in this deck.
Unlock Deck
k this deck
71
A powerful women's group has claimed that men and women differ in attitudes about sexual discrimination. A group of 50 men (group 1) and 40 women (group 2) were asked if they thought sexual discrimination is a problem in the United States. Of those sampled, 11 of the men and 19 of the women did believe that sexual discrimination is a problem. Assuming W designates women's responses and M designates men's, which of the following are the appropriate null and alternative hypotheses to test the group's claim?
A) versus
B) versus
C) versus
D) versus
A) versus
B) versus
C) versus
D) versus
Unlock Deck
Unlock for access to all 184 flashcards in this deck.
Unlock Deck
k this deck
72
TABLE 10-13
A quality control engineer is in charge of the manufacture of computer disks. Two different processes can be used to manufacture the disks. He suspects that the Kohler method produces a greater proportion of defects than the Russell method. He samples 150 of the Kohler and 200 of the Russell disks and finds that 27 and 18 of them, respectively, are defective. If Kohler is designated as "Group 1" and Russell is designated as "Group 2," perform the appropriate test at a level of significance of 0.01.
-Referring to Table 10-13, the hypotheses that should be tested are
A) versus .
B) versus .
C) versus .
D) versus .
Unlock Deck
Unlock for access to all 184 flashcards in this deck.
Unlock Deck
k this deck
73
A problem with a telephone line that prevents a customer from receiving or making calls is disconcerting to both the customer and the telephone company. The data on samples of 20 problems reported to two different offices of a telephone company and the time to clear these problems (in minutes) from the customers' lines are collected. Below is the Excel output to see whether there is evidence of a difference in the mean waiting time between the two offices assuming that the population variances in the two offices are not equal.
-Referring to Table 10-14, what is(are) the critical value(s) of the relevant hypothesis test if the level of significance is 0.05?
A) 1.6860
B) ±2.0244
C) 2.0244
D) ±1.6860
-Referring to Table 10-14, what is(are) the critical value(s) of the relevant hypothesis test if the level of significance is 0.05?
A) 1.6860
B) ±2.0244
C) 2.0244
D) ±1.6860
Unlock Deck
Unlock for access to all 184 flashcards in this deck.
Unlock Deck
k this deck
74
TABLE 10-4
A real estate company is interested in testing whether, on average, families in Gotham have been living in their current homes for less time than families in Metropolis have. Assume that the two population variances are equal. A random sample of 100 families from Gotham and a random sample of 150 families in Metropolis yield the following data on length of residence in current homes.
-Referring to Table 10-4, suppose ? = 0.10. Which of the following represents the result of the relevant hypothesis test?
A) The null hypothesis is not rejected.
B) The alternative hypothesis is rejected.
C) The null hypothesis is rejected.
D) Insufficient information exists on which to make a decision.
Unlock Deck
Unlock for access to all 184 flashcards in this deck.
Unlock Deck
k this deck
75
TABLE 10-2
A researcher randomly sampled 30 graduates of an MBA program and recorded data concerning their starting salaries. Of primary interest to the researcher was the effect of gender on starting salaries. Analysis of the mean salaries of the females and males in the sample is given below.
-Referring to Table 10-2, the researcher was attempting to show statistically that the female MBA graduates have a significantly lower mean starting salary than the male MBA graduates. The proper conclusion for this test is
A) at the ? = 0.10 level, there is sufficient evidence to indicate that females have a lower mean starting salary than male MBA graduates.
B) at the ? = 0.10 level, there is sufficient evidence to indicate a difference in the mean starting salaries of male and female MBA graduates.
C) at the ? = 0.10 level, there is insufficient evidence to indicate any difference in the mean starting salaries of male and female MBA graduates.
D) at the ? = 0.10 level, there is sufficient evidence to indicate that females have a higher mean starting salary than male MBA graduates.
Unlock Deck
Unlock for access to all 184 flashcards in this deck.
Unlock Deck
k this deck
76
The t test for the difference between the means of two independent populations assumes that the respective
A) populations are approximately normal.
B) sample sizes are equal.
C) sample variances are equal.
D) all of the above
A) populations are approximately normal.
B) sample sizes are equal.
C) sample variances are equal.
D) all of the above
Unlock Deck
Unlock for access to all 184 flashcards in this deck.
Unlock Deck
k this deck
77
If we are testing for the difference between the means of two related populations with samples of n1 = 20 and n2 = 20, the number of degrees of freedom is equal to
A) 38.
B) 39.
C) 18.
D) 19.
A) 38.
B) 39.
C) 18.
D) 19.
Unlock Deck
Unlock for access to all 184 flashcards in this deck.
Unlock Deck
k this deck
78
TABLE 10-4
A real estate company is interested in testing whether, on average, families in Gotham have been living in their current homes for less time than families in Metropolis have. Assume that the two population variances are equal. A random sample of 100 families from Gotham and a random sample of 150 families in Metropolis yield the following data on length of residence in current homes.
-Referring to Table 10-4, suppose ? = 0.05. Which of the following represents the correct conclusion?
A) There is enough evidence that, on average, families in Gotham have been living in their current homes for no less time than families in Metropolis have.
B) There is not enough evidence that, on average, families in Gotham have been living in their current homes for no less time than families in Metropolis have.
C) There is enough evidence that, on average, families in Gotham have been living in their current homes for less time than families in Metropolis have.
D) There is not enough evidence that, on average, families in Gotham have been living in their current homes for less time than families in Metropolis have.
Unlock Deck
Unlock for access to all 184 flashcards in this deck.
Unlock Deck
k this deck
79
TABLE 10-3
The use of preservatives by food processors has become a controversial issue. Suppose 2 preservatives are extensively tested and determined safe for use in meats. A processor wants to compare the preservatives for their effects on retarding spoilage. Suppose 15 cuts of fresh meat are treated with preservative I and 15 are treated with preservative II, and the number of hours until spoilage begins is recorded for each of the 30 cuts of meat. The results are summarized in the table below.
-Referring to Table 10-3, suppose ? = 0.05. Which of the following represents the correct conclusion?
A) There is no evidence that the population variances between preservatives I and II are the same.
B) There is evidence that the population variances between preservatives I and II are the same.
C) There is evidence of a difference in the population variances between preservatives I and II.
D) There is no evidence of a difference in the population variances between preservatives I and II.
Unlock Deck
Unlock for access to all 184 flashcards in this deck.
Unlock Deck
k this deck
80
If we wish to determine whether there is evidence that the proportion of items of interest is higher in group 1 than in group 2, the appropriate test to use is
A) the pooled-variance t test for the difference between two proportions.
B) the F test for the difference between two proportions.
C) the Z test for the difference between two proportions.
D) the F test for the difference between two variances.
A) the pooled-variance t test for the difference between two proportions.
B) the F test for the difference between two proportions.
C) the Z test for the difference between two proportions.
D) the F test for the difference between two variances.
Unlock Deck
Unlock for access to all 184 flashcards in this deck.
Unlock Deck
k this deck
Unlock Deck
Unlock for access to all 184 flashcards in this deck.


