Deck 12: Chi-Square Tests
Full screen (f)
Question
Question
Question
Question
Question
Question
Question
Question
Question
Question
Question
Question
Question
Question
Question
Question
Question
Question
Question
Question
Question
Question
Question
Question
Question
Question
Question
Question
Question
Question
Question
Question
Question
Question
Question
Question
Question
Question
Question
Question
Question
Consider the 3 × 2 contingency table below. 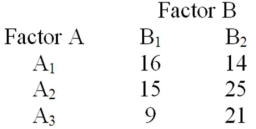 How many degrees of freedom are associated with the chi-square test?
How many degrees of freedom are associated with the chi-square test? Question
Consider a set of 50 measurements with mean 50.2 and standard deviation 18.7 and with the following observed and expected frequencies. 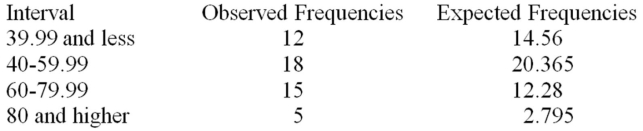 It is desired to test whether these measurements came from a normal population.At a significance level of .05,test H0: the set of 50 measurements came from a normal population.
It is desired to test whether these measurements came from a normal population.At a significance level of .05,test H0: the set of 50 measurements came from a normal population. Question
A manufacturing company produces part A732 for the aerospace industry.This particular part can be manufactured using 3 different production processes.The management wants to know if the quality of the units of part A732 is the same for all three processes.The production supervisor obtained the following data: Process 1 had 29 defective units in 240 items,Process 2 produced 12 defective units in 180 items,and Process 3 manufactured 9 defective units in 150 items. Chi-Square Contingency Table Test for Independence  At a significance level of .05,the management wants to perform a hypothesis test to determine if the quality of the items produced appears to be independent of the production process used.Based on the results summarized in the MegaStat/Excel output provided in the table above,we:
A)Reject H0 and conclude that the quality of the product is not the same for all processes.
B)Reject H0 and conclude that the quality of the product is dependent on the manufacturing process.
C)Do not reject H0,and conclude that the quality of the product does not significantly differ among the three processes.
D)Do not reject H0,and conclude that the quality of the product is not the same for all processes.
E)Reject H0 and conclude that the quality of the product is independent of the manufacturing process used.
At a significance level of .05,the management wants to perform a hypothesis test to determine if the quality of the items produced appears to be independent of the production process used.Based on the results summarized in the MegaStat/Excel output provided in the table above,we:A)Reject H0 and conclude that the quality of the product is not the same for all processes.
B)Reject H0 and conclude that the quality of the product is dependent on the manufacturing process.
C)Do not reject H0,and conclude that the quality of the product does not significantly differ among the three processes.
D)Do not reject H0,and conclude that the quality of the product is not the same for all processes.
E)Reject H0 and conclude that the quality of the product is independent of the manufacturing process used.
Question
Consider a set of 50 measurements with mean 50.2 and standard deviation 18.7 and with the following observed and expected frequencies. 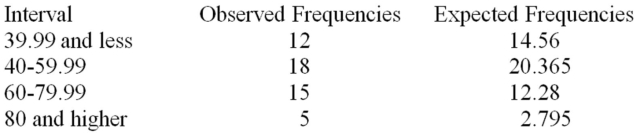 It is desired to test whether these measurements came from a normal population.Calculate the value of the chi-square test statistic.
It is desired to test whether these measurements came from a normal population.Calculate the value of the chi-square test statistic. Question
Consider a set of 50 measurements with mean 50.2 and standard deviation 18.7 and with the following observed frequencies. 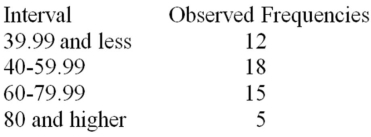 It is desired to test whether these measurements came from a normal population.Calculate the expected frequency for the interval 0-39.99.
It is desired to test whether these measurements came from a normal population.Calculate the expected frequency for the interval 0-39.99. Question
A real estate company is analyzing the selling prices of residential homes in a given community.140 homes that have been sold in the past month are randomly selected and their selling prices are recorded.The statistician working on the project has stated that in order to perform various statistical tests,the data must be distributed according to a normal distribution.In order to determine whether the selling prices of homes included in the random sample are normally distributed,the statistician divides the data into 6 classes of equal size and records the number of observations in each class.She then performs a chi-square goodness-of-fit test for normal distribution.The results are summarized in the following table.  At a significance level of .05,what is the appropriate rejection point condition?
A)Reject H0 if χ2> 12.5916
B)Reject H0 if χ2> 11.0705
C)Reject H0 if χ2> 9.3484
D)Reject H0 if χ2> 7.81473
E)Reject H0 if χ2> 9.48773
At a significance level of .05,what is the appropriate rejection point condition?A)Reject H0 if χ2> 12.5916
B)Reject H0 if χ2> 11.0705
C)Reject H0 if χ2> 9.3484
D)Reject H0 if χ2> 7.81473
E)Reject H0 if χ2> 9.48773
Question
A manufacturing company produces part A732 for the aerospace industry.This particular part can be manufactured using 3 different production processes.The management wants to know if the quality of the units of part A732 is the same for all three processes.The production supervisor obtained the following data: Process 1 had 29 defective units in 240 items,Process 2 produced 12 defective units in 180 items,and Process 3 manufactured 9 defective units in 150 items. Chi-Square Contingency Table Test for Independence 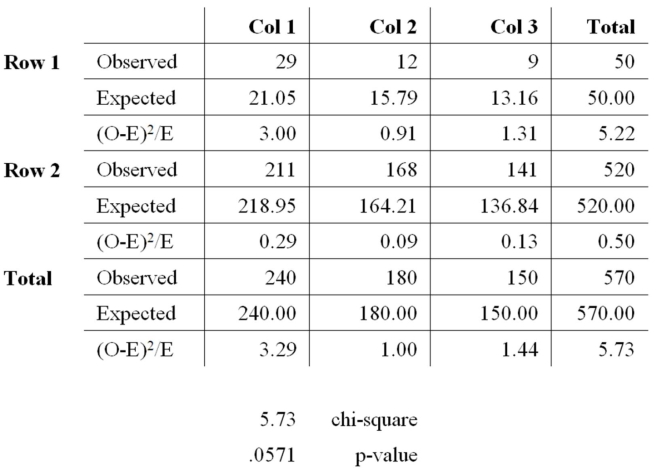 At a significance level of .10,the management wants to perform a hypothesis test to determine if the quality of the items produced appears to be independent of the production process used.Based on the results summarized in the MegaStat/Excel output provided in the table above,we:
A)Reject H0 and conclude that the quality of the product is not the same for all processes.
B)Reject H0 and conclude that the quality of the product is dependent on the manufacturing process.
C)Do not reject H0,and conclude that the quality of the product does not significantly differ among the three processes.
D)Reject H0 and conclude that the quality of the product is independent of the production process utilized.
E)Both reject H0 and conclude that the quality of the product is not the same for all processes and reject H0 and conclude that the quality of the product is dependent on the manufacturing process are correct.
At a significance level of .10,the management wants to perform a hypothesis test to determine if the quality of the items produced appears to be independent of the production process used.Based on the results summarized in the MegaStat/Excel output provided in the table above,we:A)Reject H0 and conclude that the quality of the product is not the same for all processes.
B)Reject H0 and conclude that the quality of the product is dependent on the manufacturing process.
C)Do not reject H0,and conclude that the quality of the product does not significantly differ among the three processes.
D)Reject H0 and conclude that the quality of the product is independent of the production process utilized.
E)Both reject H0 and conclude that the quality of the product is not the same for all processes and reject H0 and conclude that the quality of the product is dependent on the manufacturing process are correct.
Question
Consider a set of 50 measurements with mean 50.2 and standard deviation 18.7 and with the following observed frequencies. 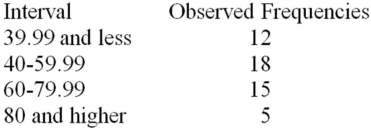 It is desired to test whether these measurements came from a normal population.How many degrees of freedom are associated with the chi-square test?
It is desired to test whether these measurements came from a normal population.How many degrees of freedom are associated with the chi-square test? Question
A real estate company is analyzing the selling prices of residential homes in a given community.140 homes that have been sold in the past month are randomly selected and their selling prices are recorded.The statistician working on the project has stated that in order to perform various statistical tests,the data must be distributed according to a normal distribution.In order to determine whether the selling prices of homes included in the random sample are normally distributed,the statistician divides the data into 6 classes of equal size and records the number of observations in each class.She then performs a chi-square goodness-of-fit test for normal distribution.The results are summarized in the following table. 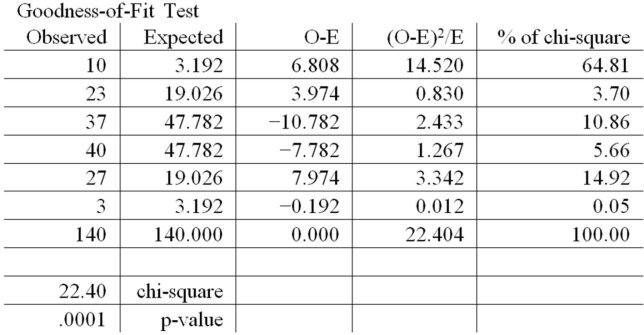 What is the appropriate null hypothesis?
A)H0: The residential home selling prices are distributed according to a normal distribution.
B)H0: The residential home selling prices are not distributed according to a normal distribution.
C)H0: The distribution of residential home selling prices is either right or left skewed.
D)H0: The distribution of the residential home selling prices is symmetric.
E)None of these is correct.
What is the appropriate null hypothesis?A)H0: The residential home selling prices are distributed according to a normal distribution.
B)H0: The residential home selling prices are not distributed according to a normal distribution.
C)H0: The distribution of residential home selling prices is either right or left skewed.
D)H0: The distribution of the residential home selling prices is symmetric.
E)None of these is correct.
Question
Consider the 3 × 2 contingency table below. 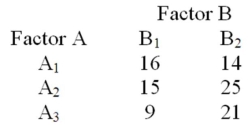 Compute the expected frequencies in row 1.
Compute the expected frequencies in row 1. Question
A real estate company is analyzing the selling prices of residential homes in a given community.140 homes that have been sold in the past month are randomly selected and their selling prices are recorded.The statistician working on the project has stated that in order to perform various statistical tests,the data must be distributed according to a normal distribution.In order to determine whether the selling prices of homes included in the random sample are normally distributed,the statistician divides the data into 6 classes of equal size and records the number of observations in each class.She then performs a chi-square goodness-of-fit test for normal distribution.The results are summarized in the following table.  At a significance level of .05,we:
A)Reject H0;conclude the residential home selling prices are not distributed according to a normal distribution.
B)Do not reject H0;conclude the residential home selling prices are not distributed according to a normal distribution.
C)Reject H0;conclude the residential home selling prices are distributed according to a normal distribution.
D)Do not reject H0;conclude the residential home selling prices are distributed according to a normal distribution.
At a significance level of .05,we:A)Reject H0;conclude the residential home selling prices are not distributed according to a normal distribution.
B)Do not reject H0;conclude the residential home selling prices are not distributed according to a normal distribution.
C)Reject H0;conclude the residential home selling prices are distributed according to a normal distribution.
D)Do not reject H0;conclude the residential home selling prices are distributed according to a normal distribution.
Question
A real estate company is analyzing the selling prices of residential homes in a given community.140 homes that have been sold in the past month are randomly selected and their selling prices are recorded.The statistician working on the project has stated that in order to perform various statistical tests,the data must be distributed according to a normal distribution.In order to determine whether the selling prices of homes included in the random sample are normally distributed,the statistician divides the data into 6 classes of equal size and records the number of observations in each class.She then performs a chi-square goodness-of-fit test for normal distribution.The results are summarized in the following table.  What are the degrees of freedom for the chi-square test?
A)2
B)3
C)4
D)5
E)6
What are the degrees of freedom for the chi-square test?A)2
B)3
C)4
D)5
E)6
Question
Consider a set of 50 measurements with mean 50.2 and standard deviation 18.7 and with the following observed frequencies. 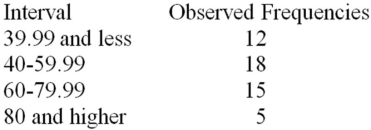 It is desired to test whether these measurements came from a normal population.Calculate the expected frequency for the interval 40-59.99.
It is desired to test whether these measurements came from a normal population.Calculate the expected frequency for the interval 40-59.99. Question
Question
Question
Consider the 3 × 2 contingency table below. 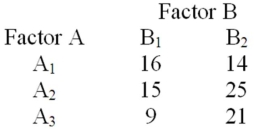 Compute the expected frequencies in row 2.
Compute the expected frequencies in row 2. Question
Consider a set of 50 measurements with mean 50.2 and standard deviation 18.7 and with the following observed frequencies. 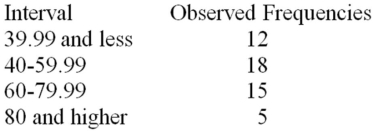 It is desired to test whether these measurements came from a normal population.
Calculate the expected frequency for the interval 80 and higher.
It is desired to test whether these measurements came from a normal population.Calculate the expected frequency for the interval 80 and higher.
Question
Consider a set of 50 measurements with mean 50.2 and standard deviation 18.7 and with the following observed frequencies. 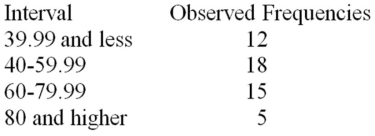 It is desired to test whether these measurements came from a normal population.Calculate the expected frequency for the interval 60-79.99.
It is desired to test whether these measurements came from a normal population.Calculate the expected frequency for the interval 60-79.99. Question
Consider the 3 × 2 contingency table below.  At a significance level of .05,test H0: the factors A and B are independent.
At a significance level of .05,test H0: the factors A and B are independent. Question
Consider the 3 × 2 contingency table below. 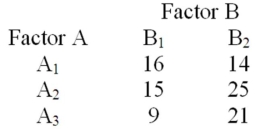 Compute the expected frequencies in row 3.
Compute the expected frequencies in row 3. Question
A U.S.-based Internet company offers an online proficiency course in basic accounting.Completing this online course satisfies the Fundamentals of Accounting course requirement in many MBA programs.In the first semester,315 students have enrolled in the course.The marketing research manager divided the country into seven regions of approximately equal population.The course enrollment values for each of the seven regions are given below.The management wants to know if there is equal interest in the course across all regions. 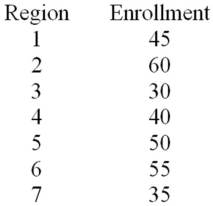 Calculate the expected enrollment (frequency)for all 7 regions.
Calculate the expected enrollment (frequency)for all 7 regions. Question
On the most recent tax cut proposal,a random sample of Democrats and Republicans in the Congress cast their votes as follows: 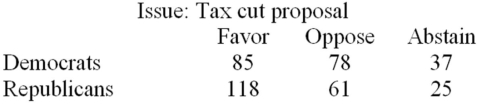 Use a significance level of .01 and determine whether the opinions on the tax cut proposal and the party affiliation are independent.
Use a significance level of .01 and determine whether the opinions on the tax cut proposal and the party affiliation are independent. Question
At a recent meeting of educational researchers,comparisons were made between the type of college freshmen attend and the numbers who drop out.A random sample of freshmen shows the following results: 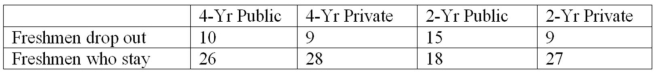 Calculate the chi-square statistic for this test of independence.
Calculate the chi-square statistic for this test of independence. Question
On the most recent tax cut proposal,a random sample of Democrats and Republicans in the Congress cast their votes as follows: 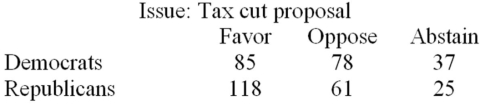 Suppose that the chi-square test of independence is performed and the null hypothesis (the vote on the issue and party affiliation are independent)is rejected.Provide a one-sentence interpretation of the outcome of the test.
Suppose that the chi-square test of independence is performed and the null hypothesis (the vote on the issue and party affiliation are independent)is rejected.Provide a one-sentence interpretation of the outcome of the test. Question
At a recent meeting of educational researchers,comparisons were made between the type of college that freshmen attend and the numbers who drop out.A random sample of freshmen shows the following results:  Determine the expected frequencies for the two cells of 4-year public institutions that will be used in the chi-square test of independence.
Determine the expected frequencies for the two cells of 4-year public institutions that will be used in the chi-square test of independence. Question
On the most recent tax cut proposal,a random sample of Democrats and Republicans in the Congress cast their votes as follows: 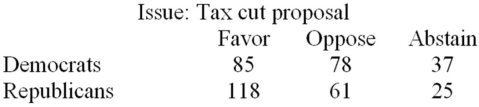 Determine the expected frequencies for both the Democrats and Republicans who oppose the tax cut proposal for the chi-square test of independence.
Determine the expected frequencies for both the Democrats and Republicans who oppose the tax cut proposal for the chi-square test of independence. Question
A human resource manager is interested in whether absences occur during the week with equal frequency.The manager took a random sample of 100 absences and created the following table: 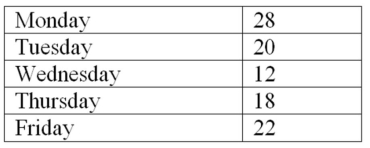 How many degrees of freedom are associated with the chi-square test? Use α = .05 and determine the rejection point condition of the chi-square statistic.
How many degrees of freedom are associated with the chi-square test? Use α = .05 and determine the rejection point condition of the chi-square statistic. Question
On the most recent tax cut proposal,a random sample of Democrats and Republicans in the Congress cast their votes as follows: 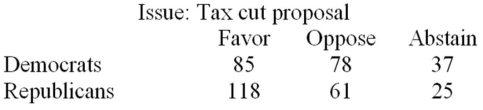 Calculate the chi-square statistic for this test of independence.
Calculate the chi-square statistic for this test of independence. Question
A human resource manager is interested in whether absences occur during the week with equal frequency.The manager took a random sample of 100 absences and created the following table:  Calculate the value of the chi-square statistic.
Calculate the value of the chi-square statistic. Question
A U.S.-based Internet company offers an online proficiency course in basic accounting.Completing this online course satisfies the Fundamentals of Accounting course requirement in many MBA programs.In the first semester,315 students have enrolled in the course.The marketing research manager divided the country into seven regions of approximately equal population.The course enrollment values for each of the seven regions are given below.The management wants to know if there is equal interest in the course across all regions. 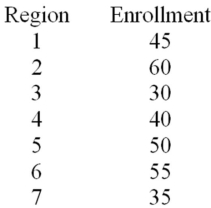 Assume that H0,the probabilities are equal for all seven regions,is rejected.State a one-sentence managerial conclusion.
Assume that H0,the probabilities are equal for all seven regions,is rejected.State a one-sentence managerial conclusion. Question
A U.S.-based Internet company offers an online proficiency course in basic accounting.Completing this online course satisfies the Fundamentals of Accounting course requirement in many MBA programs.In the first semester,315 students have enrolled in the course.The marketing research manager divided the country into seven regions of approximately equal population.The course enrollment values for each of the seven regions are given below.The management wants to know if there is equal interest in the course across all regions. 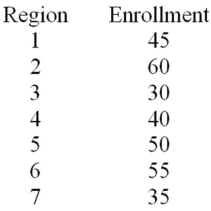 Calculate the value of the chi-square statistic.
Calculate the value of the chi-square statistic. Question
A U.S.-based Internet company offers an online proficiency course in basic accounting.Completing this online course satisfies the Fundamentals of Accounting course requirement in many MBA programs.In the first semester,315 students have enrolled in the course.The marketing research manager divided the country into seven regions of approximately equal population.The course enrollment values for each of the seven regions are given below.The management wants to know if there is equal interest in the course across all regions. 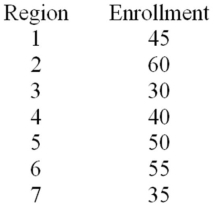 How many degrees of freedom are associated with the chi-square test? Also,at α = .05,determine the rejection point condition of the chi-square statistic.
How many degrees of freedom are associated with the chi-square test? Also,at α = .05,determine the rejection point condition of the chi-square statistic. Question
At a recent meeting of educational researchers,comparisons were made between the type of college that freshmen attend and the numbers who drop out.A random sample of freshmen shows the following results:  Determine the expected frequencies for the freshmen who drop out of 2-year institutions that will be used in the chi-square test of independence.
Determine the expected frequencies for the freshmen who drop out of 2-year institutions that will be used in the chi-square test of independence. Question
A U.S.-based Internet company offers an online proficiency course in basic accounting.Completing this online course satisfies the Fundamentals of Accounting course requirement in many MBA programs.In the first semester,315 students have enrolled in the course.The marketing research manager divided the country into seven regions of approximately equal population.The course enrollment values for each of the seven regions are given below.The management wants to know if there is equal interest in the course across all regions. 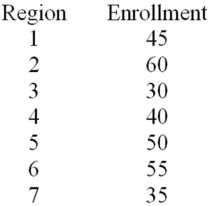 At a significance level of .05,test H0: the probabilities are equal for all seven regions.
At a significance level of .05,test H0: the probabilities are equal for all seven regions. Question
A human resource manager is interested in whether absences occur during the week with equal frequency.The manager took a random sample of 100 absences and created the following table: 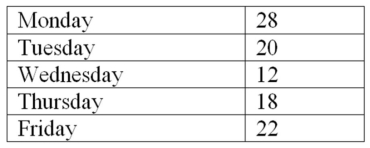 Calculate the expected absences for all 5 days.
Calculate the expected absences for all 5 days. Question
A U.S.-based Internet company offers an online proficiency course in basic accounting.Completing this online course satisfies the Fundamentals of Accounting course requirement in many MBA programs.In the first semester,315 students have enrolled in the course.The marketing research manager divided the country into seven regions of approximately equal population.The course enrollment values for each of the seven regions are given below.The management wants to know if there is equal interest in the course across all regions. 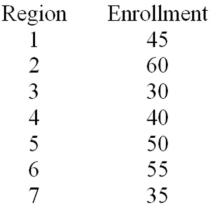 At a significance level of .01,test H0: the probabilities are equal for all seven regions.
At a significance level of .01,test H0: the probabilities are equal for all seven regions. Question
On the most recent tax cut proposal,a random sample of Democrats and Republicans in the Congress cast their votes as follows: 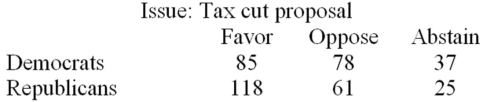 At a significance level of .01,determine the appropriate degrees of freedom and the rejection point condition for this test.
At a significance level of .01,determine the appropriate degrees of freedom and the rejection point condition for this test. Question
A U.S.-based Internet company offers an online proficiency course in basic accounting.Completing this online course satisfies the Fundamentals of Accounting course requirement in many MBA programs.In the first semester,315 students have enrolled in the course.The marketing research manager divided the country into seven regions of approximately equal population.The course enrollment values for each of the seven regions are given below.The management wants to know if there is equal interest in the course across all regions. 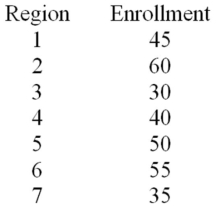 Assume that H0: p1 = p2 = p3 = p4 = p5 = p6 = p7 is not rejected,and state a one-sentence managerial conclusion.
Assume that H0: p1 = p2 = p3 = p4 = p5 = p6 = p7 is not rejected,and state a one-sentence managerial conclusion. Question
At a recent meeting of educational researchers,comparisons were made between the type of college that freshmen attend and the numbers who drop out.A random sample of freshmen shows the following results:  At a significance level of .05,determine the appropriate degrees of freedom and the rejection point condition for this test.
At a significance level of .05,determine the appropriate degrees of freedom and the rejection point condition for this test. Question
On the most recent tax cut proposal,a random sample of Democrats and Republicans in the Congress cast their votes as follows: 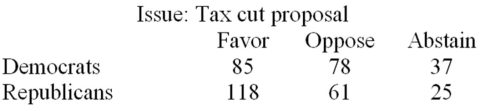 Determine the expected frequencies for both the Democrats and Republicans who favor the tax cut proposal for the chi-square test of independence.
Determine the expected frequencies for both the Democrats and Republicans who favor the tax cut proposal for the chi-square test of independence.
Unlock Deck
Sign up to unlock the cards in this deck!
Unlock Deck
Unlock Deck
1/112
Play
Full screen (f)
Deck 12: Chi-Square Tests
1
When using the chi-square goodness-of-fit test,if the value of the chi-square statistic is large enough,we reject the null hypothesis.
True
2
Expected cell frequencies for a multinomial distribution are calculated by assuming statistical dependence.
False
3
When we carry out a chi-square test of independence,in the alternative hypothesis we state that the two classifications are statistically independent.
False
4
The actual counts in the cells of a contingency table are referred to as the expected cell frequencies.
Unlock Deck
Unlock for access to all 112 flashcards in this deck.
Unlock Deck
k this deck
5
In performing a chi-square test of independence,as the difference between the respective observed and expected frequencies decreases,the probability of concluding that the row variable is independent of the column variable decreases.
Unlock Deck
Unlock for access to all 112 flashcards in this deck.
Unlock Deck
k this deck
6
When using a chi-square goodness-of-fit test with multinomial probabilities,the rejection of the null hypothesis indicates that at least one of the multinomial probabilities is not equal to the value stated in the null hypothesis.
Unlock Deck
Unlock for access to all 112 flashcards in this deck.
Unlock Deck
k this deck
7
One use of the chi-square goodness-of-fit test is to determine if specified multinomial probabilities in the null hypothesis are correct.
Unlock Deck
Unlock for access to all 112 flashcards in this deck.
Unlock Deck
k this deck
8
A contingency table summarizes data that has been classified on two dimensions or scales.
Unlock Deck
Unlock for access to all 112 flashcards in this deck.
Unlock Deck
k this deck
9
When we carry out a chi-square test of independence,if ri is the row total for row i and cj is the column total for column j,then the estimated expected cell frequency corresponding to row i and column j equals (ri)(cj)/n.
Unlock Deck
Unlock for access to all 112 flashcards in this deck.
Unlock Deck
k this deck
10
The chi-square distribution is a continuous probability distribution that is skewed to the left.
Unlock Deck
Unlock for access to all 112 flashcards in this deck.
Unlock Deck
k this deck
11
A fastener manufacturing company uses a chi-square goodness-of-fit test to determine if a population of all lengths of ¼-inch bolts it manufactures is distributed according to a normal distribution.If we reject the null hypothesis,it is reasonable to assume that the population distribution is at least approximately normally distributed.
Unlock Deck
Unlock for access to all 112 flashcards in this deck.
Unlock Deck
k this deck
12
The χ2 goodness-of-fit test requires the nominative level of data.
Unlock Deck
Unlock for access to all 112 flashcards in this deck.
Unlock Deck
k this deck
13
When we carry out a chi-square test of independence,the chi-square statistic is based on (rc - 1)degrees of freedom,where r and c denote,respectively,the number of rows and columns in the contingency table.
Unlock Deck
Unlock for access to all 112 flashcards in this deck.
Unlock Deck
k this deck
14
The chi-square goodness-of-fit test can only be used to test whether a population has specified multinomial probabilities or to test if a sample has been selected from a normally distributed population.It cannot be used if sample data come from other distribution forms such as the Poisson.
Unlock Deck
Unlock for access to all 112 flashcards in this deck.
Unlock Deck
k this deck
15
The trials of a multinomial probability are assumed to be dependent.
Unlock Deck
Unlock for access to all 112 flashcards in this deck.
Unlock Deck
k this deck
16
In a contingency table,when all the expected frequencies equal the observed frequencies,the calculated χ2 statistic equals zero.
Unlock Deck
Unlock for access to all 112 flashcards in this deck.
Unlock Deck
k this deck
17
In performing a chi-square goodness-of-fit test with multinomial probabilities,the smaller the difference between observed and expected frequencies,the higher the probability of concluding that the probabilities specified in the null hypothesis are correct.
Unlock Deck
Unlock for access to all 112 flashcards in this deck.
Unlock Deck
k this deck
18
A multinomial probability distribution describes data that are classified into two or more categories when a multinomial experiment is carried out.
Unlock Deck
Unlock for access to all 112 flashcards in this deck.
Unlock Deck
k this deck
19
When we carry out a chi-square test of independence,the expected frequencies are based on the null hypothesis.
Unlock Deck
Unlock for access to all 112 flashcards in this deck.
Unlock Deck
k this deck
20
In a contingency table,if all of the expected frequencies equal the observed frequencies,then we can conclude that there is a perfect association between rows and columns.
Unlock Deck
Unlock for access to all 112 flashcards in this deck.
Unlock Deck
k this deck
21
The chi-square goodness-of-fit test will be valid if the average of the expected cell frequencies is ______________.
A)greater than 0
B)less than 5
C)between 0 and 5
D)at least 1
E)at least 5
A)greater than 0
B)less than 5
C)between 0 and 5
D)at least 1
E)at least 5
Unlock Deck
Unlock for access to all 112 flashcards in this deck.
Unlock Deck
k this deck
22
The number of degrees of freedom associated with a chi-square test for independence based upon a contingency table with 4 rows and 3 columns is _____.
A)7
B)12
C)5
D)6
A)7
B)12
C)5
D)6
Unlock Deck
Unlock for access to all 112 flashcards in this deck.
Unlock Deck
k this deck
23
While a binomial distribution describes count data that can be classified into one of two mutually exclusive categories,a __________________ distribution describes count data that are classified into more than two mutually exclusive categories.
A)normal
B)skewed
C)uniform
D)multinomial
A)normal
B)skewed
C)uniform
D)multinomial
Unlock Deck
Unlock for access to all 112 flashcards in this deck.
Unlock Deck
k this deck
24
An experiment consists of 400 observations and four mutually exclusive groups.If the probability of a randomly selected item being classified into any of the four groups is equal,then the expected number of items that will be classified into group 1 is _____.
A)25
B)100
C)125
D)150
A)25
B)100
C)125
D)150
Unlock Deck
Unlock for access to all 112 flashcards in this deck.
Unlock Deck
k this deck
25
The χ2 statistic from a contingency table with 6 rows and 5 columns will have:
A)30 degrees of freedom.
B)24 degrees of freedom.
C)5 degrees of freedom.
D)20 degrees of freedom.
E)25 degrees of freedom.
A)30 degrees of freedom.
B)24 degrees of freedom.
C)5 degrees of freedom.
D)20 degrees of freedom.
E)25 degrees of freedom.
Unlock Deck
Unlock for access to all 112 flashcards in this deck.
Unlock Deck
k this deck
26
The chi-square goodness of fit is _________ a one-tailed test with the rejection region in the right tail.
A)always
B)sometimes
C)never
A)always
B)sometimes
C)never
Unlock Deck
Unlock for access to all 112 flashcards in this deck.
Unlock Deck
k this deck
27
A special version of the chi-square goodness-of-fit test that involves testing the null hypothesis that all of the multinomial probabilities are equal is called the test for ___________.
A)goodness of fit
B)statistical independence
C)normality
D)homogeneity
A)goodness of fit
B)statistical independence
C)normality
D)homogeneity
Unlock Deck
Unlock for access to all 112 flashcards in this deck.
Unlock Deck
k this deck
28
When we carry out a chi-square test of independence,the alternate hypothesis states that the two relevant classifications:
A)Are mutually exclusive.
B)Form a contingency table with r rows and c columns.
C)Have (r - 1)(c - 1)degrees of freedom.
D)Are statistically dependent.
E)Are normally distributed.
A)Are mutually exclusive.
B)Form a contingency table with r rows and c columns.
C)Have (r - 1)(c - 1)degrees of freedom.
D)Are statistically dependent.
E)Are normally distributed.
Unlock Deck
Unlock for access to all 112 flashcards in this deck.
Unlock Deck
k this deck
29
Which,if any,of the following statements about the chi-square test of independence is false?
A)If ri is the row total for row i and cj is the column total for column j,then the estimated expected cell frequency corresponding to row i and column j equals (ri)(cj)/n.
B)The test is valid if all of the estimated cell frequencies are at least five.
C)The chi-square statistic is based on (r - 1)(c - 1)degrees of freedom,where r and c denote,respectively,the number of rows and columns in the contingency table.
D)The alternative hypothesis states that the two classifications are statistically independent.
E)All of these statements are true about the chi-square test of independence.
Unlock Deck
Unlock for access to all 112 flashcards in this deck.
Unlock Deck
k this deck
30
In performing a chi-square goodness-of-fit test with multinomial probabilities,the ___________ the difference between observed and expected frequencies,the higher the probability of concluding that the probabilities specified in the null hypothesis are correct.
A)larger
B)smaller
A)larger
B)smaller
Unlock Deck
Unlock for access to all 112 flashcards in this deck.
Unlock Deck
k this deck
31
A manufacturing company produces part 2205 for the aerospace industry.This particular part can be manufactured using 3 different production processes.The management wants to know if the quality of the units of part 2205 is the same for all three processes.The production supervisor obtained the following data: Process 1 had 29 defective units in 240 items,Process 2 produced 12 defective units in 180 items,and Process 3 manufactured 9 defective units in 150 items.At a significance level of .05,we performed a chi-square test to determine whether the quality of the items produced appears to be the same for all three processes.What is the null hypothesis?
A)H0: The number of defectives produced is independent of the production process used.
B)H0: The row and column variables are associated with each other.
C)H0: The proportion of defective units produced by the three production processes is the same.
D)Both H0: The number of defectives produced is independent of the production process used and H0: The proportion of defective units produced by the three production processes is the same are correct or at least acceptable ways of stating the null hypothesis.
E)H0: The number of defectives produced is independent of the production process used,H0: The row and column variables are associated with each other,and H0: The proportion of defective units produced by the three production processes is the same are all acceptable ways of stating the null hypothesis.
Unlock Deck
Unlock for access to all 112 flashcards in this deck.
Unlock Deck
k this deck
32
As the difference between observed frequency and expected frequency _______________,the probability of rejecting the null hypothesis increases.
A)stays the same
B)decreases
C)increases
D)goes to 0
A)stays the same
B)decreases
C)increases
D)goes to 0
Unlock Deck
Unlock for access to all 112 flashcards in this deck.
Unlock Deck
k this deck
33
In performing a chi-square goodness-of-fit test for a normal distribution,if there are 7 intervals,then the degrees of freedom for the chi-square statistic is ______________.
A)7
B)3
C)4
D)6
A)7
B)3
C)4
D)6
Unlock Deck
Unlock for access to all 112 flashcards in this deck.
Unlock Deck
k this deck
34
When we carry out a chi-square test of independence,as the differences between the respective observed and expected frequencies decrease,the probability of concluding that the row variable is independent of the column variable:
A)Decreases.
B)Increases.
C)May decrease or increase depending on the number of rows and columns.
D)Will be unaffected.
A)Decreases.
B)Increases.
C)May decrease or increase depending on the number of rows and columns.
D)Will be unaffected.
Unlock Deck
Unlock for access to all 112 flashcards in this deck.
Unlock Deck
k this deck
35
When we carry out a goodness-of-fit chi-square test,the expected frequencies are based on the alternative hypothesis.
Unlock Deck
Unlock for access to all 112 flashcards in this deck.
Unlock Deck
k this deck
36
The chi-square goodness-of-fit test for multinomial probabilities with 5 categories has _____ degrees of freedom.
A)5
B)4
C)3
D)6
A)5
B)4
C)3
D)6
Unlock Deck
Unlock for access to all 112 flashcards in this deck.
Unlock Deck
k this deck
37
When we carry out a chi-square goodness-of-fit test for a normal distribution,the null hypothesis states that the population:
A)Does not have a normal distribution.
B)Has a normal distribution.
C)Has a chi-square distribution.
D)Does not have a chi-square distribution.
E)Has k - 3 degrees of freedom.
A)Does not have a normal distribution.
B)Has a normal distribution.
C)Has a chi-square distribution.
D)Does not have a chi-square distribution.
E)Has k - 3 degrees of freedom.
Unlock Deck
Unlock for access to all 112 flashcards in this deck.
Unlock Deck
k this deck
38
The χ2 statistic is used to test whether the assumption of normality is reasonable for a given population distribution.The sample consists of 5000 observations and is divided into 6 categories (intervals).The degrees of freedom for the chi-square statistic are:
A)4999
B)6
C)5
D)4
E)3
A)4999
B)6
C)5
D)4
E)3
Unlock Deck
Unlock for access to all 112 flashcards in this deck.
Unlock Deck
k this deck
39
In performing a chi-square test of independence,as the differences between respective observed and expected frequencies _________,the probability of concluding that the row variable is independent of the column variable increases.
A)stay the same
B)decrease
C)increase
D)double
A)stay the same
B)decrease
C)increase
D)double
Unlock Deck
Unlock for access to all 112 flashcards in this deck.
Unlock Deck
k this deck
40
In performing a chi-square goodness-of-fit test for a normal distribution,a researcher wants to make sure that all of the expected cell frequencies are at least five.The sample is divided into 7 intervals.The second through the sixth intervals all have expected cell frequencies of at least five.The first and the last intervals have expected cell frequencies of 1.5 each.After adjusting the number of intervals,the degrees of freedom for the chi-square statistic is ____.
A)2
B)3
C)5
D)7
A)2
B)3
C)5
D)7
Unlock Deck
Unlock for access to all 112 flashcards in this deck.
Unlock Deck
k this deck
41
Consider the 3 × 2 contingency table below. How many degrees of freedom are associated with the chi-square test?
How many degrees of freedom are associated with the chi-square test? Unlock Deck
Unlock for access to all 112 flashcards in this deck.
Unlock Deck
k this deck
42
Consider a set of 50 measurements with mean 50.2 and standard deviation 18.7 and with the following observed and expected frequencies. It is desired to test whether these measurements came from a normal population.At a significance level of .05,test H0: the set of 50 measurements came from a normal population.
It is desired to test whether these measurements came from a normal population.At a significance level of .05,test H0: the set of 50 measurements came from a normal population. Unlock Deck
Unlock for access to all 112 flashcards in this deck.
Unlock Deck
k this deck
43
A manufacturing company produces part A732 for the aerospace industry.This particular part can be manufactured using 3 different production processes.The management wants to know if the quality of the units of part A732 is the same for all three processes.The production supervisor obtained the following data: Process 1 had 29 defective units in 240 items,Process 2 produced 12 defective units in 180 items,and Process 3 manufactured 9 defective units in 150 items. Chi-Square Contingency Table Test for Independence At a significance level of .05,the management wants to perform a hypothesis test to determine if the quality of the items produced appears to be independent of the production process used.Based on the results summarized in the MegaStat/Excel output provided in the table above,we:
A)Reject H0 and conclude that the quality of the product is not the same for all processes.
B)Reject H0 and conclude that the quality of the product is dependent on the manufacturing process.
C)Do not reject H0,and conclude that the quality of the product does not significantly differ among the three processes.
D)Do not reject H0,and conclude that the quality of the product is not the same for all processes.
E)Reject H0 and conclude that the quality of the product is independent of the manufacturing process used.
At a significance level of .05,the management wants to perform a hypothesis test to determine if the quality of the items produced appears to be independent of the production process used.Based on the results summarized in the MegaStat/Excel output provided in the table above,we:A)Reject H0 and conclude that the quality of the product is not the same for all processes.
B)Reject H0 and conclude that the quality of the product is dependent on the manufacturing process.
C)Do not reject H0,and conclude that the quality of the product does not significantly differ among the three processes.
D)Do not reject H0,and conclude that the quality of the product is not the same for all processes.
E)Reject H0 and conclude that the quality of the product is independent of the manufacturing process used.
Unlock Deck
Unlock for access to all 112 flashcards in this deck.
Unlock Deck
k this deck
44
Consider a set of 50 measurements with mean 50.2 and standard deviation 18.7 and with the following observed and expected frequencies. It is desired to test whether these measurements came from a normal population.Calculate the value of the chi-square test statistic.
It is desired to test whether these measurements came from a normal population.Calculate the value of the chi-square test statistic. Unlock Deck
Unlock for access to all 112 flashcards in this deck.
Unlock Deck
k this deck
45
Consider a set of 50 measurements with mean 50.2 and standard deviation 18.7 and with the following observed frequencies. It is desired to test whether these measurements came from a normal population.Calculate the expected frequency for the interval 0-39.99.
It is desired to test whether these measurements came from a normal population.Calculate the expected frequency for the interval 0-39.99. Unlock Deck
Unlock for access to all 112 flashcards in this deck.
Unlock Deck
k this deck
46
A real estate company is analyzing the selling prices of residential homes in a given community.140 homes that have been sold in the past month are randomly selected and their selling prices are recorded.The statistician working on the project has stated that in order to perform various statistical tests,the data must be distributed according to a normal distribution.In order to determine whether the selling prices of homes included in the random sample are normally distributed,the statistician divides the data into 6 classes of equal size and records the number of observations in each class.She then performs a chi-square goodness-of-fit test for normal distribution.The results are summarized in the following table. At a significance level of .05,what is the appropriate rejection point condition?
A)Reject H0 if χ2> 12.5916
B)Reject H0 if χ2> 11.0705
C)Reject H0 if χ2> 9.3484
D)Reject H0 if χ2> 7.81473
E)Reject H0 if χ2> 9.48773
At a significance level of .05,what is the appropriate rejection point condition?A)Reject H0 if χ2> 12.5916
B)Reject H0 if χ2> 11.0705
C)Reject H0 if χ2> 9.3484
D)Reject H0 if χ2> 7.81473
E)Reject H0 if χ2> 9.48773
Unlock Deck
Unlock for access to all 112 flashcards in this deck.
Unlock Deck
k this deck
47
A manufacturing company produces part A732 for the aerospace industry.This particular part can be manufactured using 3 different production processes.The management wants to know if the quality of the units of part A732 is the same for all three processes.The production supervisor obtained the following data: Process 1 had 29 defective units in 240 items,Process 2 produced 12 defective units in 180 items,and Process 3 manufactured 9 defective units in 150 items. Chi-Square Contingency Table Test for Independence At a significance level of .10,the management wants to perform a hypothesis test to determine if the quality of the items produced appears to be independent of the production process used.Based on the results summarized in the MegaStat/Excel output provided in the table above,we:
A)Reject H0 and conclude that the quality of the product is not the same for all processes.
B)Reject H0 and conclude that the quality of the product is dependent on the manufacturing process.
C)Do not reject H0,and conclude that the quality of the product does not significantly differ among the three processes.
D)Reject H0 and conclude that the quality of the product is independent of the production process utilized.
E)Both reject H0 and conclude that the quality of the product is not the same for all processes and reject H0 and conclude that the quality of the product is dependent on the manufacturing process are correct.
At a significance level of .10,the management wants to perform a hypothesis test to determine if the quality of the items produced appears to be independent of the production process used.Based on the results summarized in the MegaStat/Excel output provided in the table above,we:A)Reject H0 and conclude that the quality of the product is not the same for all processes.
B)Reject H0 and conclude that the quality of the product is dependent on the manufacturing process.
C)Do not reject H0,and conclude that the quality of the product does not significantly differ among the three processes.
D)Reject H0 and conclude that the quality of the product is independent of the production process utilized.
E)Both reject H0 and conclude that the quality of the product is not the same for all processes and reject H0 and conclude that the quality of the product is dependent on the manufacturing process are correct.
Unlock Deck
Unlock for access to all 112 flashcards in this deck.
Unlock Deck
k this deck
48
Consider a set of 50 measurements with mean 50.2 and standard deviation 18.7 and with the following observed frequencies. It is desired to test whether these measurements came from a normal population.How many degrees of freedom are associated with the chi-square test?
It is desired to test whether these measurements came from a normal population.How many degrees of freedom are associated with the chi-square test? Unlock Deck
Unlock for access to all 112 flashcards in this deck.
Unlock Deck
k this deck
49
A real estate company is analyzing the selling prices of residential homes in a given community.140 homes that have been sold in the past month are randomly selected and their selling prices are recorded.The statistician working on the project has stated that in order to perform various statistical tests,the data must be distributed according to a normal distribution.In order to determine whether the selling prices of homes included in the random sample are normally distributed,the statistician divides the data into 6 classes of equal size and records the number of observations in each class.She then performs a chi-square goodness-of-fit test for normal distribution.The results are summarized in the following table. What is the appropriate null hypothesis?
A)H0: The residential home selling prices are distributed according to a normal distribution.
B)H0: The residential home selling prices are not distributed according to a normal distribution.
C)H0: The distribution of residential home selling prices is either right or left skewed.
D)H0: The distribution of the residential home selling prices is symmetric.
E)None of these is correct.
What is the appropriate null hypothesis?A)H0: The residential home selling prices are distributed according to a normal distribution.
B)H0: The residential home selling prices are not distributed according to a normal distribution.
C)H0: The distribution of residential home selling prices is either right or left skewed.
D)H0: The distribution of the residential home selling prices is symmetric.
E)None of these is correct.
Unlock Deck
Unlock for access to all 112 flashcards in this deck.
Unlock Deck
k this deck
50
Consider the 3 × 2 contingency table below. Compute the expected frequencies in row 1.
Compute the expected frequencies in row 1. Unlock Deck
Unlock for access to all 112 flashcards in this deck.
Unlock Deck
k this deck
51
A real estate company is analyzing the selling prices of residential homes in a given community.140 homes that have been sold in the past month are randomly selected and their selling prices are recorded.The statistician working on the project has stated that in order to perform various statistical tests,the data must be distributed according to a normal distribution.In order to determine whether the selling prices of homes included in the random sample are normally distributed,the statistician divides the data into 6 classes of equal size and records the number of observations in each class.She then performs a chi-square goodness-of-fit test for normal distribution.The results are summarized in the following table. At a significance level of .05,we:
A)Reject H0;conclude the residential home selling prices are not distributed according to a normal distribution.
B)Do not reject H0;conclude the residential home selling prices are not distributed according to a normal distribution.
C)Reject H0;conclude the residential home selling prices are distributed according to a normal distribution.
D)Do not reject H0;conclude the residential home selling prices are distributed according to a normal distribution.
At a significance level of .05,we:A)Reject H0;conclude the residential home selling prices are not distributed according to a normal distribution.
B)Do not reject H0;conclude the residential home selling prices are not distributed according to a normal distribution.
C)Reject H0;conclude the residential home selling prices are distributed according to a normal distribution.
D)Do not reject H0;conclude the residential home selling prices are distributed according to a normal distribution.
Unlock Deck
Unlock for access to all 112 flashcards in this deck.
Unlock Deck
k this deck
52
A real estate company is analyzing the selling prices of residential homes in a given community.140 homes that have been sold in the past month are randomly selected and their selling prices are recorded.The statistician working on the project has stated that in order to perform various statistical tests,the data must be distributed according to a normal distribution.In order to determine whether the selling prices of homes included in the random sample are normally distributed,the statistician divides the data into 6 classes of equal size and records the number of observations in each class.She then performs a chi-square goodness-of-fit test for normal distribution.The results are summarized in the following table. What are the degrees of freedom for the chi-square test?
A)2
B)3
C)4
D)5
E)6
What are the degrees of freedom for the chi-square test?A)2
B)3
C)4
D)5
E)6
Unlock Deck
Unlock for access to all 112 flashcards in this deck.
Unlock Deck
k this deck
53
Consider a set of 50 measurements with mean 50.2 and standard deviation 18.7 and with the following observed frequencies. It is desired to test whether these measurements came from a normal population.Calculate the expected frequency for the interval 40-59.99.
It is desired to test whether these measurements came from a normal population.Calculate the expected frequency for the interval 40-59.99. Unlock Deck
Unlock for access to all 112 flashcards in this deck.
Unlock Deck
k this deck
54
A manufacturing company produces part A732 for the aerospace industry.This particular part can be manufactured using 3 different production processes.The management wants to know if the quality of the units of part A732 is the same for all three processes.The production supervisor obtained the following data: Process 1 had 29 defective units in 240 items,Process 2 produced 12 defective units in 180 items,and Process 3 manufactured 9 defective units in 150 items.At a significance level of .05,the management wants to perform a hypothesis test to determine whether the quality of items produced appears to be independent of the production process used.What is the rejection point condition?
A)Reject H0 if χ2> .10257
B)Reject H0 if χ2> 9.3484
C)Reject H0 if χ2> 5.99147
D)Reject H0 if χ2> 7.37776
E)Reject H0 if χ2> 7.81473
A)Reject H0 if χ2> .10257
B)Reject H0 if χ2> 9.3484
C)Reject H0 if χ2> 5.99147
D)Reject H0 if χ2> 7.37776
E)Reject H0 if χ2> 7.81473
Unlock Deck
Unlock for access to all 112 flashcards in this deck.
Unlock Deck
k this deck
55
A manufacturing company produces part A732 for the aerospace industry.This particular part can be manufactured using 3 different production processes.The management wants to know if the quality of the units of part A732 is the same for all three processes.The production supervisor obtained the following data: Process 1 had 29 defective units in 240 items,Process 2 produced 12 defective units in 180 items,and Process 3 manufactured 9 defective units in 150 items.At a significance level of .05,we performed a chi-square test of independence to determine if the quality of the items produced appears to be independent of the production process.What are the degrees of freedom for the chi-square statistic?
A)2
B)3
C)50
D)520
E)570
A)2
B)3
C)50
D)520
E)570
Unlock Deck
Unlock for access to all 112 flashcards in this deck.
Unlock Deck
k this deck
56
Consider the 3 × 2 contingency table below. Compute the expected frequencies in row 2.
Compute the expected frequencies in row 2. Unlock Deck
Unlock for access to all 112 flashcards in this deck.
Unlock Deck
k this deck
57
Consider a set of 50 measurements with mean 50.2 and standard deviation 18.7 and with the following observed frequencies. It is desired to test whether these measurements came from a normal population.
Calculate the expected frequency for the interval 80 and higher.
It is desired to test whether these measurements came from a normal population.Calculate the expected frequency for the interval 80 and higher.
Unlock Deck
Unlock for access to all 112 flashcards in this deck.
Unlock Deck
k this deck
58
Consider a set of 50 measurements with mean 50.2 and standard deviation 18.7 and with the following observed frequencies. It is desired to test whether these measurements came from a normal population.Calculate the expected frequency for the interval 60-79.99.
It is desired to test whether these measurements came from a normal population.Calculate the expected frequency for the interval 60-79.99. Unlock Deck
Unlock for access to all 112 flashcards in this deck.
Unlock Deck
k this deck
59
Consider the 3 × 2 contingency table below. At a significance level of .05,test H0: the factors A and B are independent.
At a significance level of .05,test H0: the factors A and B are independent. Unlock Deck
Unlock for access to all 112 flashcards in this deck.
Unlock Deck
k this deck
60
Consider the 3 × 2 contingency table below. Compute the expected frequencies in row 3.
Compute the expected frequencies in row 3. Unlock Deck
Unlock for access to all 112 flashcards in this deck.
Unlock Deck
k this deck
61
A U.S.-based Internet company offers an online proficiency course in basic accounting.Completing this online course satisfies the Fundamentals of Accounting course requirement in many MBA programs.In the first semester,315 students have enrolled in the course.The marketing research manager divided the country into seven regions of approximately equal population.The course enrollment values for each of the seven regions are given below.The management wants to know if there is equal interest in the course across all regions. Calculate the expected enrollment (frequency)for all 7 regions.
Calculate the expected enrollment (frequency)for all 7 regions. Unlock Deck
Unlock for access to all 112 flashcards in this deck.
Unlock Deck
k this deck
62
On the most recent tax cut proposal,a random sample of Democrats and Republicans in the Congress cast their votes as follows: Use a significance level of .01 and determine whether the opinions on the tax cut proposal and the party affiliation are independent.
Use a significance level of .01 and determine whether the opinions on the tax cut proposal and the party affiliation are independent. Unlock Deck
Unlock for access to all 112 flashcards in this deck.
Unlock Deck
k this deck
63
At a recent meeting of educational researchers,comparisons were made between the type of college freshmen attend and the numbers who drop out.A random sample of freshmen shows the following results: Calculate the chi-square statistic for this test of independence.
Calculate the chi-square statistic for this test of independence. Unlock Deck
Unlock for access to all 112 flashcards in this deck.
Unlock Deck
k this deck
64
On the most recent tax cut proposal,a random sample of Democrats and Republicans in the Congress cast their votes as follows: Suppose that the chi-square test of independence is performed and the null hypothesis (the vote on the issue and party affiliation are independent)is rejected.Provide a one-sentence interpretation of the outcome of the test.
Suppose that the chi-square test of independence is performed and the null hypothesis (the vote on the issue and party affiliation are independent)is rejected.Provide a one-sentence interpretation of the outcome of the test. Unlock Deck
Unlock for access to all 112 flashcards in this deck.
Unlock Deck
k this deck
65
At a recent meeting of educational researchers,comparisons were made between the type of college that freshmen attend and the numbers who drop out.A random sample of freshmen shows the following results: Determine the expected frequencies for the two cells of 4-year public institutions that will be used in the chi-square test of independence.
Determine the expected frequencies for the two cells of 4-year public institutions that will be used in the chi-square test of independence. Unlock Deck
Unlock for access to all 112 flashcards in this deck.
Unlock Deck
k this deck
66
On the most recent tax cut proposal,a random sample of Democrats and Republicans in the Congress cast their votes as follows: Determine the expected frequencies for both the Democrats and Republicans who oppose the tax cut proposal for the chi-square test of independence.
Determine the expected frequencies for both the Democrats and Republicans who oppose the tax cut proposal for the chi-square test of independence. Unlock Deck
Unlock for access to all 112 flashcards in this deck.
Unlock Deck
k this deck
67
A human resource manager is interested in whether absences occur during the week with equal frequency.The manager took a random sample of 100 absences and created the following table: How many degrees of freedom are associated with the chi-square test? Use α = .05 and determine the rejection point condition of the chi-square statistic.
How many degrees of freedom are associated with the chi-square test? Use α = .05 and determine the rejection point condition of the chi-square statistic. Unlock Deck
Unlock for access to all 112 flashcards in this deck.
Unlock Deck
k this deck
68
On the most recent tax cut proposal,a random sample of Democrats and Republicans in the Congress cast their votes as follows: Calculate the chi-square statistic for this test of independence.
Calculate the chi-square statistic for this test of independence. Unlock Deck
Unlock for access to all 112 flashcards in this deck.
Unlock Deck
k this deck
69
A human resource manager is interested in whether absences occur during the week with equal frequency.The manager took a random sample of 100 absences and created the following table: Calculate the value of the chi-square statistic.
Calculate the value of the chi-square statistic. Unlock Deck
Unlock for access to all 112 flashcards in this deck.
Unlock Deck
k this deck
70
A U.S.-based Internet company offers an online proficiency course in basic accounting.Completing this online course satisfies the Fundamentals of Accounting course requirement in many MBA programs.In the first semester,315 students have enrolled in the course.The marketing research manager divided the country into seven regions of approximately equal population.The course enrollment values for each of the seven regions are given below.The management wants to know if there is equal interest in the course across all regions. Assume that H0,the probabilities are equal for all seven regions,is rejected.State a one-sentence managerial conclusion.
Assume that H0,the probabilities are equal for all seven regions,is rejected.State a one-sentence managerial conclusion. Unlock Deck
Unlock for access to all 112 flashcards in this deck.
Unlock Deck
k this deck
71
A U.S.-based Internet company offers an online proficiency course in basic accounting.Completing this online course satisfies the Fundamentals of Accounting course requirement in many MBA programs.In the first semester,315 students have enrolled in the course.The marketing research manager divided the country into seven regions of approximately equal population.The course enrollment values for each of the seven regions are given below.The management wants to know if there is equal interest in the course across all regions. Calculate the value of the chi-square statistic.
Calculate the value of the chi-square statistic. Unlock Deck
Unlock for access to all 112 flashcards in this deck.
Unlock Deck
k this deck
72
A U.S.-based Internet company offers an online proficiency course in basic accounting.Completing this online course satisfies the Fundamentals of Accounting course requirement in many MBA programs.In the first semester,315 students have enrolled in the course.The marketing research manager divided the country into seven regions of approximately equal population.The course enrollment values for each of the seven regions are given below.The management wants to know if there is equal interest in the course across all regions. How many degrees of freedom are associated with the chi-square test? Also,at α = .05,determine the rejection point condition of the chi-square statistic.
How many degrees of freedom are associated with the chi-square test? Also,at α = .05,determine the rejection point condition of the chi-square statistic. Unlock Deck
Unlock for access to all 112 flashcards in this deck.
Unlock Deck
k this deck
73
At a recent meeting of educational researchers,comparisons were made between the type of college that freshmen attend and the numbers who drop out.A random sample of freshmen shows the following results: Determine the expected frequencies for the freshmen who drop out of 2-year institutions that will be used in the chi-square test of independence.
Determine the expected frequencies for the freshmen who drop out of 2-year institutions that will be used in the chi-square test of independence. Unlock Deck
Unlock for access to all 112 flashcards in this deck.
Unlock Deck
k this deck
74
A U.S.-based Internet company offers an online proficiency course in basic accounting.Completing this online course satisfies the Fundamentals of Accounting course requirement in many MBA programs.In the first semester,315 students have enrolled in the course.The marketing research manager divided the country into seven regions of approximately equal population.The course enrollment values for each of the seven regions are given below.The management wants to know if there is equal interest in the course across all regions. At a significance level of .05,test H0: the probabilities are equal for all seven regions.
At a significance level of .05,test H0: the probabilities are equal for all seven regions. Unlock Deck
Unlock for access to all 112 flashcards in this deck.
Unlock Deck
k this deck
75
A human resource manager is interested in whether absences occur during the week with equal frequency.The manager took a random sample of 100 absences and created the following table: Calculate the expected absences for all 5 days.
Calculate the expected absences for all 5 days. Unlock Deck
Unlock for access to all 112 flashcards in this deck.
Unlock Deck
k this deck
76
A U.S.-based Internet company offers an online proficiency course in basic accounting.Completing this online course satisfies the Fundamentals of Accounting course requirement in many MBA programs.In the first semester,315 students have enrolled in the course.The marketing research manager divided the country into seven regions of approximately equal population.The course enrollment values for each of the seven regions are given below.The management wants to know if there is equal interest in the course across all regions. At a significance level of .01,test H0: the probabilities are equal for all seven regions.
At a significance level of .01,test H0: the probabilities are equal for all seven regions. Unlock Deck
Unlock for access to all 112 flashcards in this deck.
Unlock Deck
k this deck
77
On the most recent tax cut proposal,a random sample of Democrats and Republicans in the Congress cast their votes as follows: At a significance level of .01,determine the appropriate degrees of freedom and the rejection point condition for this test.
At a significance level of .01,determine the appropriate degrees of freedom and the rejection point condition for this test. Unlock Deck
Unlock for access to all 112 flashcards in this deck.
Unlock Deck
k this deck
78
A U.S.-based Internet company offers an online proficiency course in basic accounting.Completing this online course satisfies the Fundamentals of Accounting course requirement in many MBA programs.In the first semester,315 students have enrolled in the course.The marketing research manager divided the country into seven regions of approximately equal population.The course enrollment values for each of the seven regions are given below.The management wants to know if there is equal interest in the course across all regions. Assume that H0: p1 = p2 = p3 = p4 = p5 = p6 = p7 is not rejected,and state a one-sentence managerial conclusion.
Assume that H0: p1 = p2 = p3 = p4 = p5 = p6 = p7 is not rejected,and state a one-sentence managerial conclusion. Unlock Deck
Unlock for access to all 112 flashcards in this deck.
Unlock Deck
k this deck
79
At a recent meeting of educational researchers,comparisons were made between the type of college that freshmen attend and the numbers who drop out.A random sample of freshmen shows the following results: At a significance level of .05,determine the appropriate degrees of freedom and the rejection point condition for this test.
At a significance level of .05,determine the appropriate degrees of freedom and the rejection point condition for this test. Unlock Deck
Unlock for access to all 112 flashcards in this deck.
Unlock Deck
k this deck
80
On the most recent tax cut proposal,a random sample of Democrats and Republicans in the Congress cast their votes as follows: Determine the expected frequencies for both the Democrats and Republicans who favor the tax cut proposal for the chi-square test of independence.
Determine the expected frequencies for both the Democrats and Republicans who favor the tax cut proposal for the chi-square test of independence. Unlock Deck
Unlock for access to all 112 flashcards in this deck.
Unlock Deck
k this deck
Unlock Deck
Unlock for access to all 112 flashcards in this deck.


