Deck 11: Monte Carlo Simulation
Full screen (f)
Question
The type of distribution shown in the graph below is a(n) __________ distribution. 
A)uniform
B)normal
C)exponential
D)beta
A)uniform
B)normal
C)exponential
D)beta
Question
Question
Question
Question
Question
Question
Question
Question
Question
Question
Question
Question
Question
Which of the following inferences about a variable of interest can be drawn from the graph given below? 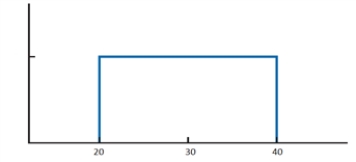
A)The variable is equally likely to take any value between 20 and 40.
B)The variable is more likely to take the value 20 than 40.
C)The variable is more likely to take any value outside the range of 20 and 40.
D)The variable can only take the value 30.
A)The variable is equally likely to take any value between 20 and 40.
B)The variable is more likely to take the value 20 than 40.
C)The variable is more likely to take any value outside the range of 20 and 40.
D)The variable can only take the value 30.
Question
In reviewing the graph below, which of the following inferences can be drawn about the monthly salary? 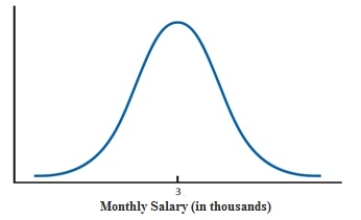
A)The average monthly salary is $3,000.
B)The monthly salary is always less than $3,000.
C)The monthly salary is always greater than $3,000.
D)The range of the monthly salary distribution is $3,000 to $5,000.
A)The average monthly salary is $3,000.
B)The monthly salary is always less than $3,000.
C)The monthly salary is always greater than $3,000.
D)The range of the monthly salary distribution is $3,000 to $5,000.
Question
Question
Question
Question
Question
Question
Question
Question
Question
Question
Question
Question
Question
Question
Question
Question
Question
Question
Question
Question
Question
Question
Question
Question
Question
Question
A store is offering a discount on 800 pairs of basketball shoes. The amount of the discount varies and is not revealed to the customer until checkout. The distribution of discounts is given in the below table.
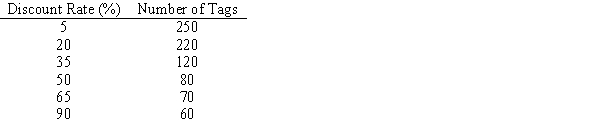
How many pairs of shoes does a customer have to buy so that, on average, he has purchased five containing a 65% or 90% discount? (Hint: Use the hypergeometric distribution in ASP to answer this question.)
How many pairs of shoes does a customer have to buy so that, on average, he has purchased five containing a 65% or 90% discount? (Hint: Use the hypergeometric distribution in ASP to answer this question.)

Unlock Deck
Sign up to unlock the cards in this deck!
Unlock Deck
Unlock Deck
1/41
Play
Full screen (f)
Deck 11: Monte Carlo Simulation
1
The type of distribution shown in the graph below is a(n) __________ distribution.
A)uniform
B)normal
C)exponential
D)beta
A)uniform
B)normal
C)exponential
D)beta
normal
2
An input to a simulation model that is selected by the decision maker is known as a
A)random variable.
B)nonnegativity constraint.
C)probable input.
D)controllable input.
A)random variable.
B)nonnegativity constraint.
C)probable input.
D)controllable input.
controllable input.
3
In a __________ distribution, a random variable can take any value in a specified range.
A)discrete probability
B)cumulative
C)relative frequency
D)continuous probability
A)discrete probability
B)cumulative
C)relative frequency
D)continuous probability
continuous probability
4
A ___________ uses repeated random sampling to represent uncertainty in a model representing a real system and that computes the values of model outputs.
A)Monte Carlo simulation
B)what-if analysis
C)deterministic model
D)discrete event simulation
A)Monte Carlo simulation
B)what-if analysis
C)deterministic model
D)discrete event simulation
Unlock Deck
Unlock for access to all 41 flashcards in this deck.
Unlock Deck
k this deck
5
The values for random variables in a Monte Carlo simulation are
A)selected manually.
B)generated randomly from probability distributions.
C)taken from forecasting analysis.
D)derived secondarily using formulas.
A)selected manually.
B)generated randomly from probability distributions.
C)taken from forecasting analysis.
D)derived secondarily using formulas.
Unlock Deck
Unlock for access to all 41 flashcards in this deck.
Unlock Deck
k this deck
6
A distribution of a random variable for which values extremely larger or smaller than the mean are increasingly unlikely can possibly be modeled as a(n) _____________ probability distribution.
A)binomial
B)normal
C)exponential
D)gamma
A)binomial
B)normal
C)exponential
D)gamma
Unlock Deck
Unlock for access to all 41 flashcards in this deck.
Unlock Deck
k this deck
7
A set of values for the random variables is called a(n)
A)event.
B)permutation.
C)trial.
D)combination.
A)event.
B)permutation.
C)trial.
D)combination.
Unlock Deck
Unlock for access to all 41 flashcards in this deck.
Unlock Deck
k this deck
8
In a base-case scenario, the output is determined by assuming
A)worst values that can be expected for the random variables of a model.
B)the mean trial values for the random variables of a model.
C)best values that can be expected for the random variables of a model.
D)the most likely values for the random variables of a model.
A)worst values that can be expected for the random variables of a model.
B)the mean trial values for the random variables of a model.
C)best values that can be expected for the random variables of a model.
D)the most likely values for the random variables of a model.
Unlock Deck
Unlock for access to all 41 flashcards in this deck.
Unlock Deck
k this deck
9
A description of the range and relative likelihood of possible values of an uncertain variable is known as a
A)risk analysis.
B)probability distribution.
C)base-case scenario.
D)simulation optimization.
A)risk analysis.
B)probability distribution.
C)base-case scenario.
D)simulation optimization.
Unlock Deck
Unlock for access to all 41 flashcards in this deck.
Unlock Deck
k this deck
10
The range of computer-generated random numbers is
A)[-8, 8].
B)[-8, 0).
C)[1, 8].
D)[0, 1).
A)[-8, 8].
B)[-8, 0).
C)[1, 8].
D)[0, 1).
Unlock Deck
Unlock for access to all 41 flashcards in this deck.
Unlock Deck
k this deck
11
A __________ analysis involves considering alternative values for the random variables and computing the resulting value for the output.
A)random
B)what-if
C)risk
D)cluster
A)random
B)what-if
C)risk
D)cluster
Unlock Deck
Unlock for access to all 41 flashcards in this deck.
Unlock Deck
k this deck
12
A(n) __________ is an input to a simulation model whose value is uncertain and described by a probability distribution.
A)identifier
B)constraint
C)random variable
D)decision variable
A)identifier
B)constraint
C)random variable
D)decision variable
Unlock Deck
Unlock for access to all 41 flashcards in this deck.
Unlock Deck
k this deck
13
A simulation model extends spreadsheet modeling by
A)extending the range of parameters for which solutions are computed.
B)using real-time values for parameters from the application to formulate solutions.
C)replacing the use of single values for parameters with a range of possible values.
D)using historical data to make predictions about future values and expected trends.
Unlock Deck
Unlock for access to all 41 flashcards in this deck.
Unlock Deck
k this deck
14
Which of the following inferences about a variable of interest can be drawn from the graph given below?
A)The variable is equally likely to take any value between 20 and 40.
B)The variable is more likely to take the value 20 than 40.
C)The variable is more likely to take any value outside the range of 20 and 40.
D)The variable can only take the value 30.
A)The variable is equally likely to take any value between 20 and 40.
B)The variable is more likely to take the value 20 than 40.
C)The variable is more likely to take any value outside the range of 20 and 40.
D)The variable can only take the value 30.
Unlock Deck
Unlock for access to all 41 flashcards in this deck.
Unlock Deck
k this deck
15
In reviewing the graph below, which of the following inferences can be drawn about the monthly salary?
A)The average monthly salary is $3,000.
B)The monthly salary is always less than $3,000.
C)The monthly salary is always greater than $3,000.
D)The range of the monthly salary distribution is $3,000 to $5,000.
A)The average monthly salary is $3,000.
B)The monthly salary is always less than $3,000.
C)The monthly salary is always greater than $3,000.
D)The range of the monthly salary distribution is $3,000 to $5,000.
Unlock Deck
Unlock for access to all 41 flashcards in this deck.
Unlock Deck
k this deck
16
The process of evaluating a decision in the face of uncertainty by quantifying the likelihood and magnitude of an undesirable outcome is known as
A)risk analysis.
B)regression analysis.
C)data mining.
D)decision tree analysis.
A)risk analysis.
B)regression analysis.
C)data mining.
D)decision tree analysis.
Unlock Deck
Unlock for access to all 41 flashcards in this deck.
Unlock Deck
k this deck
17
The choice of the probability distribution for a random variable can be guided by
A)an objective function.
B)likelihood factors.
C)forecasting.
D)historical data.
A)an objective function.
B)likelihood factors.
C)forecasting.
D)historical data.
Unlock Deck
Unlock for access to all 41 flashcards in this deck.
Unlock Deck
k this deck
18
A disadvantage of the simple what-if analyses is that
A)there are errors induced as a result of rounding.
B)the optimal solutions are not guaranteed.
C)there is no indication of the likelihood of various output values.
D)it cannot compute alternate optimal solutions.
A)there are errors induced as a result of rounding.
B)the optimal solutions are not guaranteed.
C)there is no indication of the likelihood of various output values.
D)it cannot compute alternate optimal solutions.
Unlock Deck
Unlock for access to all 41 flashcards in this deck.
Unlock Deck
k this deck
19
In simulation analysis, the ___________ of random variables can be adjusted to determine the impact of the assumptions about the shape of the uncertainty on the results.
A)probability distributions
B)ranges
C)relative frequencies
D)manual generations
A)probability distributions
B)ranges
C)relative frequencies
D)manual generations
Unlock Deck
Unlock for access to all 41 flashcards in this deck.
Unlock Deck
k this deck
20
The outcome of a simulation experiment is a(n)
A)objective function.
B)probability distribution for one or more output measures.
C)single number.
D)what-if scenario.
A)objective function.
B)probability distribution for one or more output measures.
C)single number.
D)what-if scenario.
Unlock Deck
Unlock for access to all 41 flashcards in this deck.
Unlock Deck
k this deck
21
Which of the following cannot be modeled by a continuous distribution?
A)Length of time it takes to manufacture a product
B)Height of the finished manufactured product
C)Weight of a finished manufactured product
D)Number of products produced in an hour
A)Length of time it takes to manufacture a product
B)Height of the finished manufactured product
C)Weight of a finished manufactured product
D)Number of products produced in an hour
Unlock Deck
Unlock for access to all 41 flashcards in this deck.
Unlock Deck
k this deck
22
Which of the following parameters is required to convert a computer-generated random variable into a uniform random variable?
A)Range of the distribution
B)Mean of the distribution
C)Variance of the distribution
D)Moments of the distribution
A)Range of the distribution
B)Mean of the distribution
C)Variance of the distribution
D)Moments of the distribution
Unlock Deck
Unlock for access to all 41 flashcards in this deck.
Unlock Deck
k this deck
23
The __________ function is used to generate a pseudorandom number in Excel.
A)FREQUENCY()
B)RAND()
C)NORM.INV()
D)ROUND()
A)FREQUENCY()
B)RAND()
C)NORM.INV()
D)ROUND()
Unlock Deck
Unlock for access to all 41 flashcards in this deck.
Unlock Deck
k this deck
24
The time it takes to manufacture a product is modeled by a continuous distribution. The time to manufacture one unit can take anywhere from 5 to 6 minutes with equal probability. What distribution can be used to model the random variable, production time?
A)Normal distribution
B)Uniform distribution
C)Discrete probability distribution
D)Binomial distribution
A)Normal distribution
B)Uniform distribution
C)Discrete probability distribution
D)Binomial distribution
Unlock Deck
Unlock for access to all 41 flashcards in this deck.
Unlock Deck
k this deck
25
Which of the following Excel functions would generate random integers from 0 to 100?
A)=RAND( )
B)=RANDBETWEEN(0, 100)
C)=SUMIF(A1:A100, 100)
D)=100*RAND( )
A)=RAND( )
B)=RANDBETWEEN(0, 100)
C)=SUMIF(A1:A100, 100)
D)=100*RAND( )
Unlock Deck
Unlock for access to all 41 flashcards in this deck.
Unlock Deck
k this deck
26
Which of the following is a disadvantage of using simulation?
A)Experimenting directly with a simulation model is often not feasible.
B)Each simulation run provides only a sample of how the real system will operate.
C)The simulation models are used to describe systems without requiring the assumptions that are required by mathematical models.
D)Simulation models warn against poor decision strategies by projecting disastrous outcomes such as system failures, large financial losses, and so on.
Unlock Deck
Unlock for access to all 41 flashcards in this deck.
Unlock Deck
k this deck
27
The profit realized by the sales of a particular item follows a normal distribution with a mean of $0.5 million per quarter and a standard deviation of $0.1 million per quarter. What percent of the quarters can be expected to see a profit of at least $0.5 million?
A)50%
B)40%
C)60%
D)10%
A)50%
B)40%
C)60%
D)10%
Unlock Deck
Unlock for access to all 41 flashcards in this deck.
Unlock Deck
k this deck
28
The process of determining that a computer program implements a simulation model as it is intended is known as
A)validation.
B)verification.
C)correlation.
D)optimization.
A)validation.
B)verification.
C)correlation.
D)optimization.
Unlock Deck
Unlock for access to all 41 flashcards in this deck.
Unlock Deck
k this deck
29
All the values of computer-generated random numbers are
A)Poisson distributed.
B)lognormally distributed.
C)uniformly distributed.
D)normally distributed.
A)Poisson distributed.
B)lognormally distributed.
C)uniformly distributed.
D)normally distributed.
Unlock Deck
Unlock for access to all 41 flashcards in this deck.
Unlock Deck
k this deck
30
Which of the following cannot be described by a discrete probability distribution?
A)Sales of two medical devices in which Device A generates $35 per unit sold and will likely constitute 30% of the sales and Device B generates $50 per unit sold and will likely constitute 70% of the sales.
B)The labor cost for manufacturing goods, where one-third of the units cost $10 in labor, one-third cost $15 in labor, and one-third cost $50 in labor.
C)The cost of parts for manufacturing an item, where the parts can take on any value between $80 and $100.
D)The number of units produced in a given day, where 20% of the time 99 units are produced and 80% of the time 100 units are produced.
Unlock Deck
Unlock for access to all 41 flashcards in this deck.
Unlock Deck
k this deck
31
The weekly demand for an item in a retail store follows a uniform distribution over the range 70 to 83. What would be the weekly demand if its corresponding computer-generated value is 0.5?
A)90.1
B)83
C)76.5
D)50.85
A)90.1
B)83
C)76.5
D)50.85
Unlock Deck
Unlock for access to all 41 flashcards in this deck.
Unlock Deck
k this deck
32
The random variables corresponding to the interarrival times of customers and the service times of the servers are commonly part of a(n) __________ simulation.
A)Monte Carlo
B)what-if
C)risk analysis
D)discrete-event
A)Monte Carlo
B)what-if
C)risk analysis
D)discrete-event
Unlock Deck
Unlock for access to all 41 flashcards in this deck.
Unlock Deck
k this deck
33
Which of the following is true of verification?
A)It is largely a debugging task.
B)It requires an agreement among analysts and managers.
C)It deals with the accurate modeling of real system operations.
D)It is performed prior to the development of the computer procedure for simulation.
A)It is largely a debugging task.
B)It requires an agreement among analysts and managers.
C)It deals with the accurate modeling of real system operations.
D)It is performed prior to the development of the computer procedure for simulation.
Unlock Deck
Unlock for access to all 41 flashcards in this deck.
Unlock Deck
k this deck
34
Which of the following functions computes a value such that 2.5% of the area under the standard normal distribution lies in the upper tail defined by this value?
A)=NORM.S.INV(0.975)
B)=NORM.S.INV(0.025)
C)=NORM.S.INV(0.05)
D)=NORM.S.INV(0.95)
A)=NORM.S.INV(0.975)
B)=NORM.S.INV(0.025)
C)=NORM.S.INV(0.05)
D)=NORM.S.INV(0.95)
Unlock Deck
Unlock for access to all 41 flashcards in this deck.
Unlock Deck
k this deck
35
The Excel function __________ generates integer values between lower and upper bounds.
A)RAND
B)RANDBETWEEN
C)LOWER
D)UPPER
A)RAND
B)RANDBETWEEN
C)LOWER
D)UPPER
Unlock Deck
Unlock for access to all 41 flashcards in this deck.
Unlock Deck
k this deck
36
The __________ function in Excel is used to compute the statistics required to create a histogram.
A)NORM.INV
B)RAND
C)FREQUENCY
D)STDEV.S
A)NORM.INV
B)RAND
C)FREQUENCY
D)STDEV.S
Unlock Deck
Unlock for access to all 41 flashcards in this deck.
Unlock Deck
k this deck
37
Which of the following numbers cannot result from the Excel function =NORM.INV(RAND( ), 100, 10)?
A)99
B)115
C)121
D)All of these numbers can result from this Excel function.
A)99
B)115
C)121
D)All of these numbers can result from this Excel function.
Unlock Deck
Unlock for access to all 41 flashcards in this deck.
Unlock Deck
k this deck
38
For a given mean and standard deviation, the __________ function in Excel is used to generate a value for the random variable characterized by a normal distribution.
A)NORM.INV
B)RAND
C)VLOOKUP
D)FREQUENCY
A)NORM.INV
B)RAND
C)VLOOKUP
D)FREQUENCY
Unlock Deck
Unlock for access to all 41 flashcards in this deck.
Unlock Deck
k this deck
39
__________ is the process of determining that a simulation model provides an accurate representation of a real system.
A)Regression
B)Verification
C)Consideration
D)Validation
A)Regression
B)Verification
C)Consideration
D)Validation
Unlock Deck
Unlock for access to all 41 flashcards in this deck.
Unlock Deck
k this deck
40
In Excel, the expression LN(RAND())*(-m) would generate a(n) __________ random variable with mean m.
A)lognormal
B)logarithmic
C)normal
D)exponential
A)lognormal
B)logarithmic
C)normal
D)exponential
Unlock Deck
Unlock for access to all 41 flashcards in this deck.
Unlock Deck
k this deck
41
A store is offering a discount on 800 pairs of basketball shoes. The amount of the discount varies and is not revealed to the customer until checkout. The distribution of discounts is given in the below table.
How many pairs of shoes does a customer have to buy so that, on average, he has purchased five containing a 65% or 90% discount? (Hint: Use the hypergeometric distribution in ASP to answer this question.)
How many pairs of shoes does a customer have to buy so that, on average, he has purchased five containing a 65% or 90% discount? (Hint: Use the hypergeometric distribution in ASP to answer this question.)
Unlock Deck
Unlock for access to all 41 flashcards in this deck.
Unlock Deck
k this deck
Unlock Deck
Unlock for access to all 41 flashcards in this deck.


