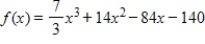
Deck 11: Applications of Derivatives
Full screen (f)
Question
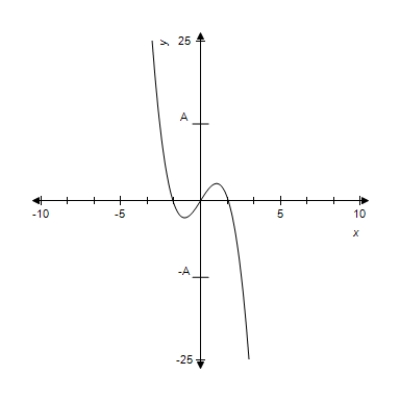
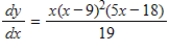
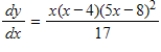
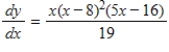
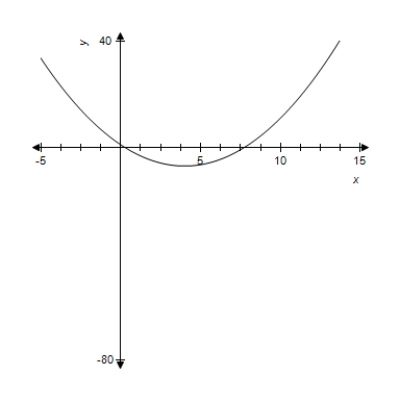
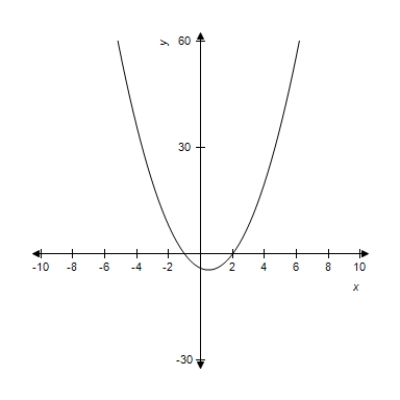
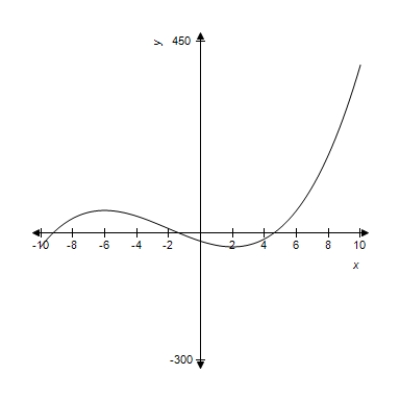
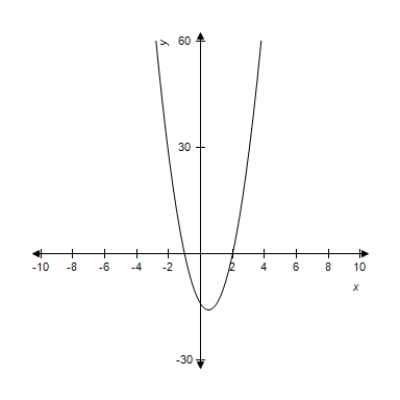
For the given function, find all intervals of x-values where the function is decreasing. 
A)
B)
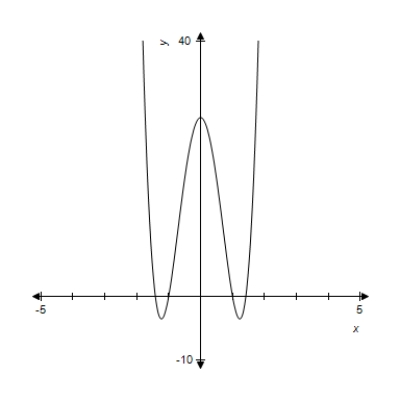
C)
Or
D)
E)
A)
B)
C)
Or
D)
E)
Question
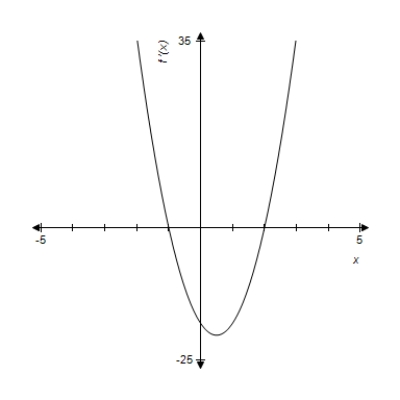
For the given function, find the critical points. 
A)
And
B)
And
C)
And
D)
And
E)(
And
A)
And
B)
And
C)
And
D)
And
E)(
And
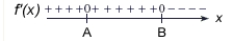
Question
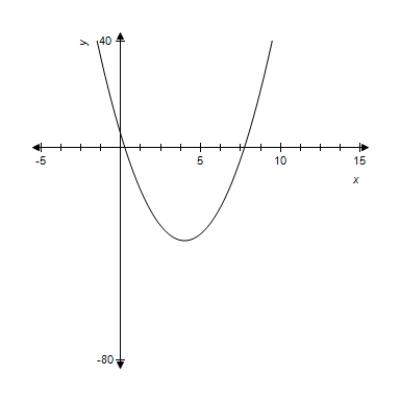
Use the sign diagram for  to determine x-values at which relative minima occur, where
  and
and  .
. 
A)
B)
C)
And
D)
E)no relative minima
to determine x-values at which relative minima occur, where and . A)
B)
C)
And
D)
E)no relative minima
Question
Make a sign diagram for the function and determine all x-values at which relative maxima occur. 
A)
B)
C)
D)
E)no relative maxima
A)
B)
C)
D)
E)no relative maxima
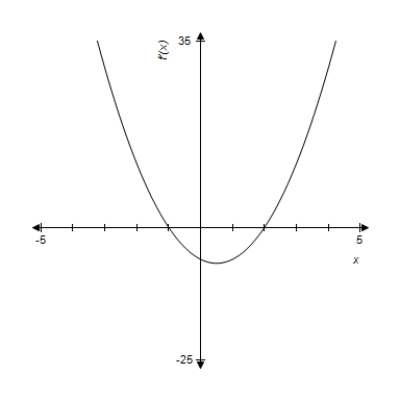
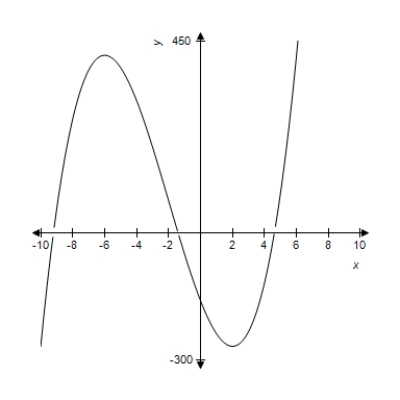
Question
Use the graph of  to identify at which of the indicated points the derivative
  does not change sign.
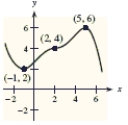
A)(-1, 2), (2, 4), (5, 6)
B)(-1, 2)
C)(-1, 2), (5, 6)
D)(-1, 2), (2, 4)
E)(2, 4)
to identify at which of the indicated points the derivative does not change sign. A)(-1, 2), (2, 4), (5, 6)
B)(-1, 2)
C)(-1, 2), (5, 6)
D)(-1, 2), (2, 4)
E)(2, 4)
Question
For the given function and graph, estimate the coordinates of the relative maxima by observing the graph, where  .
. 
A)
B)
C)
D)
E)no relative maxima
. A)
B)
C)
D)
E)no relative maxima
Question
Use the sign diagram for  to determine the largest interval on which f (x) decreases, where
  and
and  .
. 
A)
B)
C)
D)
E)
to determine the largest interval on which f (x) decreases, where and . A)
B)
C)
D)
E)
Question
For the given function and graph, determine all critical value(s), where  .
. 
A)
B)
C)
D)
And
E)
And
And
. A)
B)
C)
D)
And
E)
And
And
Question
Use the sign diagram for  to determine all critical values of f (x), where
  and
and  .
. 
A)
B)
C)
And
D)
E)
to determine all critical values of f (x), where and . A)
B)
C)
And
D)
E)
Question
Make a sign diagram for the function and determine all x-values at which relative minima occur. 
A)
B)
C)
D)
E)no relative minima
A)
B)
C)
D)
E)no relative minima
Question
For the given function and graph, determine all critical point(s), where  .
. 

A)
B)
C)
D)
And
E)
And
And
. A)
B)
C)
D)
And
E)
And
And
Question
Use the graph of  to identify at which of the indicated points the derivative
  changes from positive to negative.
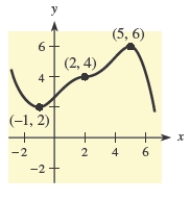
A)(5, 6)
B)(2, 4)
C)(-1, 2), (5, 6)
D)(-1, 2), (2, 4)
E)(2, 4), (5, 6)
to identify at which of the indicated points the derivative changes from positive to negative. A)(5, 6)
B)(2, 4)
C)(-1, 2), (5, 6)
D)(-1, 2), (2, 4)
E)(2, 4), (5, 6)
Question
Use the sign diagram for  to determine the largest interval on which f (x) increases, where
  and
and  .
. 
A)
B)
C)
D)
E)
to determine the largest interval on which f (x) increases, where and . A)
B)
C)
D)
E)
Question
For the given function, find 
A)
B)
C)
D)
E)
A)
B)
C)
D)
E)
Question
For the given function and graph, estimate the coordinates of the relative minima by observing the graph, where  .
. 
A)
B)
C)
D)
E)no relative minima
. A)
B)
C)
D)
E)no relative minima
Question
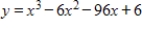
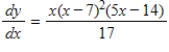
For the given function, find all intervals of x-values where the function is increasing. 
A)
B)
C)
Or
D)
E)
A)
B)
C)
Or
D)
E)
Question
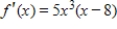
For the given function, find all critical values. 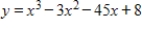
A)
B)
And
C)
And
D)
And
E)
And
A)
B)
And
C)
And
D)
And
E)
And
Question
For the given function, find  .
. 
A)
B)
C)
D)
E)
. A)
B)
C)
D)
E)
Question
Use the graph of  to identify at which of the indicated points the derivative
  changes from negative to positive.
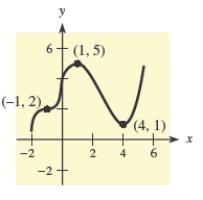
A)(-1, 2), (2, 4)
B)(4, 1)
C)(-1, 2), (2, 4), (5, 6)
D)(2, 4)
E)(2, 4), (5, 6)
to identify at which of the indicated points the derivative changes from negative to positive. A)(-1, 2), (2, 4)
B)(4, 1)
C)(-1, 2), (2, 4), (5, 6)
D)(2, 4)
E)(2, 4), (5, 6)
Question
Use the sign diagram for  to determine x-values at which relative maxima occur, where
  and
and  .
. 
A)
B)
C)
And
D)
E)no relative maxima
to determine x-values at which relative maxima occur, where and . A)
B)
C)
And
D)
E)no relative maxima
Question
For the given function, find the critical points. 
A)
B)
C)
D)
E)
A)
B)
C)
D)
E)
Question
For the given function find the relative maxima, and sketch the graph. You may check your graph with a graphing utility. 
A)
B)
C)
D)
E)
A)
B)
C)
D)
E)
Question
For the given function, use the graph to identify the x-value for which  . You may use the derivative to check your conclusion.
A)
B)
C)
D)
E)
. You may use the derivative to check your conclusion. A)
B)
C)
D)
E)
Question
For the given function, classify the critical points as relative maxima, relative minima, or points of inflection. In each case, you may check your conclusions with a graphing utility. 
A)
Is a relative minimum and
Is point of inflection.
B)
Is a point of inflection and
Is a relative minimum.
C)
Is a point of inflection and
Is a relative maximum.
D)
Is a relative minimum and
Is a relative maximum.
E)
Is a relative maximum and
Is a relative minimum.
A)
Is a relative minimum and
Is point of inflection.
B)
Is a point of inflection and
Is a relative minimum.
C)
Is a point of inflection and
Is a relative maximum.
D)
Is a relative minimum and
Is a relative maximum.
E)
Is a relative maximum and
Is a relative minimum.
Question
Both a function and its derivative are given. Use them to find the relative maxima. 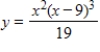
A)
B)
C)
D)
E)no relative maxima
A)
B)
C)
D)
E)no relative maxima
Question
For the given function, find the relative maxima. 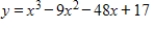
A)
B)
C)
D)
E)no relative maxima
A)
B)
C)
D)
E)no relative maxima
Question
For the given function, find the relative minima. 
A)
B)
C)
D)
E)no relative minima
A)
B)
C)
D)
E)no relative minima
Question
For the given function, use the graph to identify x-values for which  . You may use the derivative to check your conclusion.
A)
B)
C)
D)
E)
. You may use the derivative to check your conclusion. A)
B)
C)
D)
E)
Question
Both a function and its derivative are given. Use them to find all critical values. 
A)
B)
C)
D)
E)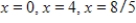
A)
B)
C)
D)
E)
Question
Both a function and its derivative are given. Use them to find all critical points. 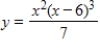
A)
,
,
B)
,
,
C)
,
,
D)
,
,
E)
,
,
A)
,
,
B)
,
,
C)
,
,
D)
,
,
E)
,
,
Question
Both a function and its derivative are given. Use them to find intervals on which the function is decreasing. 
A)
B)
C)
D)
Or
E)
A)
B)
C)
D)
Or
E)
Question
For the given function, find intervals of x-values where the function is decreasing. 
A)
B)
C)
D)
E)
A)
B)
C)
D)
E)
Question
For the given function, find the critical values. 
A)
And
B)
And
C)
And
D)
And
E)
And
A)
And
B)
And
C)
And
D)
And
E)
And
Question
For the given function, find the horizontal points of inflection. 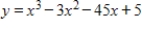
A)
B)
C)
D)
E)no horizontal points of inflection
A)
B)
C)
D)
E)no horizontal points of inflection
Question
Both a function and its derivative are given. Use them to find the relative minima. 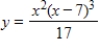
A)
B)
C)
D)
E)no relative minima
A)
B)
C)
D)
E)no relative minima
Question
Use the derivative to locate all critical points. Use a graphing utility if desired. Round your answers to two decimal places. 
A)
B)
C)
D)
E)
A)
B)
C)
D)
E)
Question
For the given function, use the graph to identify x-values for which  . You may use the derivative to check your conclusion.
A)
B)
C)
D)
E)
. You may use the derivative to check your conclusion. A)
B)
C)
D)
E)
Question
For the given function, find intervals of x-values where the function is increasing. 
A)
B)
C)
D)
E)
A)
B)
C)
D)
E)
Question
For the given function find the relative minima, and sketch the graph. You may check your graph with a graphing utility. 
A)
B)
And
C)
And
D)
E)
A)
B)
And
C)
And
D)
E)
Question
Both a function and its derivative are given. Use them to find intervals on which the function is increasing. 
A)
Or
Or
B)
C)
Or
D)
Or
E)
A)
Or
Or
B)
C)
Or
D)
Or
E)
Question
A graph of  is given. Use the graph to determine where f (x) is decreasing.

A)
B)
C)
D)
Or
E)
is given. Use the graph to determine where f (x) is decreasing. A)
B)
C)
D)
Or
E)
Question
Use the indicated x-values on the graph of  to determine intervals over which the graph is concave up.
A)
And
B)
C)
D)
E)
And
to determine intervals over which the graph is concave up. A)
And
B)
C)
D)
E)
And
Question
A function and its graph are given. Use the second derivative to determine intervals on which the function is concave up. Check these results against the graph shown. 
A)
B)
C)
D)
Or
E)
A)
B)
C)
D)
Or
E)
Question
Suppose the average costs of a mining operation depend on the number of machines used, and average costs, in dollars, are given by 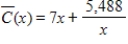 ,
,  , where x is the number of machines used. Over what interval in the domain do average costs increase?
A)
B)
C)
D)
E)
, , where x is the number of machines used. Over what interval in the domain do average costs increase? A)
B)
C)
D)
E)
Question
A graph of  is given. Use the graph to determine all critical values of
  .
. 
A)
B)
C)
D)
E)
,
,
is given. Use the graph to determine all critical values of . A)
B)
C)
D)
E)
,
,
Question
Suppose that a chain of auto service stations, Quick-Oil, Inc., has found that its monthly sales volume y (in thousands of dollars) is related to the price p (in dollars) of an oil change by 
 . Is y increasing or decreasing for all values of
A)increasing
B)decreasing
. Is y increasing or decreasing for all values of A)increasing
B)decreasing
Question
The number of milligrams x of a medication in the bloodstream t hours after a dose is taken can be modeled by  ,
,  . Find the maximum value of x. Round your answer to two decimal places.
A)2.83 mg
B)530.33 mg
C)1166.73 mg
D)8.77 mg
E)1125.30 mg
, . Find the maximum value of x. Round your answer to two decimal places. A)2.83 mg
B)530.33 mg
C)1166.73 mg
D)8.77 mg
E)1125.30 mg
Question
The number of milligrams x of a medication in the bloodstream t hours after a dose is taken can be modeled by  ,
,  . Find the t-value at which x is maximum. Round your answer to two decimal places.
A)0 hours
B)1.41 hours
C)1767.77 hours
D)3.41 hours
E)3.45 hours
, . Find the t-value at which x is maximum. Round your answer to two decimal places. A)0 hours
B)1.41 hours
C)1767.77 hours
D)3.41 hours
E)3.45 hours
Question
A graph of  is given. Use the graph to determine where the graph of
  has a relative minimum.
A)
B)
C)
D)
E)no relative minima
is given. Use the graph to determine where the graph of has a relative minimum. A)
B)
C)
D)
E)no relative minima
Question
A function and its graph are given. Use the second derivative to determine intervals on which the function is concave down. Check these results against the graph shown. 
A)
B)
C)
D)
Or
E)
A)
B)
C)
D)
Or
E)
Question
Suppose the average costs of a mining operation depend on the number of machines used, and average costs, in dollars, are given by 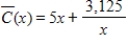 ,
,  , where x is the number of machines used. How many machines give minimum average costs?
A)Using 25 machines gives the minimum average costs.
B)Using zero machines gives the minimum average costs.
C)Using 35 machines gives the minimum average costs.
D)Using 50 machines gives the minimum average costs.
E)Using 55 machines gives the minimum average costs.
, , where x is the number of machines used. How many machines give minimum average costs? A)Using 25 machines gives the minimum average costs.
B)Using zero machines gives the minimum average costs.
C)Using 35 machines gives the minimum average costs.
D)Using 50 machines gives the minimum average costs.
E)Using 55 machines gives the minimum average costs.
Question
Use the indicated  -values on the graph of
  to find all the intervals where
  .
. 
A)
B)
And
C)
D)
E)
And
-values on the graph of to find all the intervals where . A)
B)
And
C)
D)
E)
And
Question
The number of milligrams x of a medication in the bloodstream t hours after a dose is taken can be modeled by  ,
,  . For what
  -values is
  increasing? Round answers to two decimal places.
A)
B)
C)
D)
E)
, . For what -values is increasing? Round answers to two decimal places.A)
B)
C)
D)
E)
Question
Suppose the average costs of a mining operation depend on the number of machines used, and average costs, in dollars, are given by 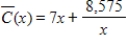 ,
,  , where x is the number of machines used. What is the minimum average cost? Round your answer to the nearest dollar.
A)$0
B)$35
C)$490
D)$245
E)$8,582
, , where x is the number of machines used. What is the minimum average cost? Round your answer to the nearest dollar. A)$0
B)$35
C)$490
D)$245
E)$8,582
Question
A function and its graph are given. Use the second derivative to locate all x-values of points of inflection on the graph of  . Check these results against the graph shown.
A)
B)
C)
D)
,
E)
,
,
. Check these results against the graph shown. A)
B)
C)
D)
,
E)
,
,
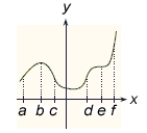
Question
Use the indicated x-values on the graph of  to find the x-coordinate of any horizontal point of inflection.
A)a
B)c
C)f
D)e
E)d
to find the x-coordinate of any horizontal point of inflection. A)a
B)c
C)f
D)e
E)d
Question
Suppose the average costs of a mining operation depend on the number of machines used, and average costs, in dollars, are given by  ,
,  , where x is the number of machines used. Over what interval in the domain do average costs decrease?
A)
B)
C)
D)
E)
, , where x is the number of machines used. Over what interval in the domain do average costs decrease? A)
B)
C)
D)
E)
Question
Suppose the average costs of a mining operation depend on the number of machines used, and average costs, in dollars, are given by  ,
,  , where x is the number of machines used. Find the critical values of
  that lie in the domain of the problem.
A)
B)
C)
D)
E)
, , where x is the number of machines used. Find the critical values of that lie in the domain of the problem.
A)
B)
C)
D)
E)
Question
Determine whether the given function is concave up or concave down at the indicated point. 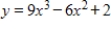 at
at 
A)concave down
B)concave up
at A)concave down
B)concave up
Question
A graph of  is given. Use the graph to determine where the graph of
  has a relative maximum.
A)
B)
C)
D)
E)no relative maxima
is given. Use the graph to determine where the graph of has a relative maximum. A)
B)
C)
D)
E)no relative maxima
Question
Find all points of inflection of the given function. Round your answer to two decimal places. 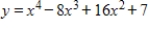
A)
B)
C)
D)
E)
A)
B)
C)
D)
E)
Question
In this problem,  and its graph are given. Use the graph of
  to determine where
  is concave up.
A)
B)
C)
D)
E)
and its graph are given. Use the graph of to determine where is concave up. A)
B)
C)
D)
E)
Question
Find all relative minima of the given function. 
A)
B)
C)
D)
,
E)no relative minima
A)
B)
C)
D)
,
E)no relative minima
Question
Use the graph shown in the figure and identify points from A through I that satisfy the given condition.  and
and 

A)I
B)F
C)C
D)D
E)H
and A)I
B)F
C)C
D)D
E)H
Question
In this problem,  and its graph are given. Use the graph of
  to determine where
  is concave down.
A)
B)
C)
D)
E)
and its graph are given. Use the graph of to determine where is concave down. A)
B)
C)
D)
E)
Question
A function and its graph are given. From the graph, estimate where  .
. 
A)
B)
C)
D)
E)
. A)
B)
C)
D)
E)
Question
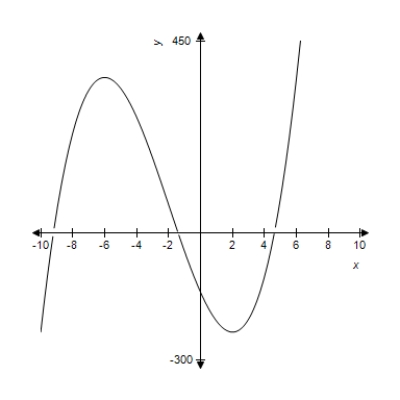
The following figure shows the growth of a population as a function of time.  If P represents the population and t represents the time, write a mathematical symbol that represents the rate of change (growth rate) of the population with respect to time.
A)
B)
C)
D)
E)
If P represents the population and t represents the time, write a mathematical symbol that represents the rate of change (growth rate) of the population with respect to time.A)
B)
C)
D)
E)
Question
A function and its first and second derivatives are given. Use these to find the relative maxima. 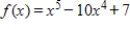

A)
B)
C)
D)
E)no relative maxima
A)
B)
C)
D)
E)no relative maxima
Question
Use the graph shown in the figure and identify points from A through I that satisfy the given condition.  and
and 

A)C
B)F
C)I
D)A
E)B
and A)C
B)F
C)I
D)A
E)B
Question
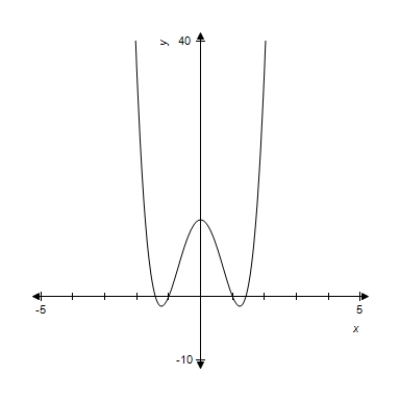
A function and its graph are given. From the graph estimate where  has a relative maximum.
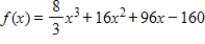

A)
B)
C)
D)
E)no relative maxima
has a relative maximum. A)
B)
C)
D)
E)no relative maxima
Question
A function and its first and second derivatives are given. Use these to find all points of inflection. 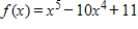


A)
B)
C)
D)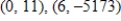
E)no points of inflection
A)
B)
C)
D)
E)no points of inflection
Question
Find all relative maxima of the given function. 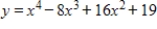
A)
B)
C)
D)
E)no relative maxima
A)
B)
C)
D)
E)no relative maxima
Question
A function and its graph are given. From the graph estimate where  has a relative minimum.
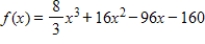
A)
B)
C)
D)
E)no relative minima
has a relative minimum. A)
B)
C)
D)
E)no relative minima
Question
A function and its first and second derivatives are given. Use these to find all critical values. 
A)
B)
C)
D)
E)
A)
B)
C)
D)
E)
Question
Use the graph shown in the figure and identify points from A through I that satisfy the given condition.  and
and 

A)B
B)E
C)A
D)D
E)H
and A)B
B)E
C)A
D)D
E)H
Question
A function and its graph are given. From the graph, estimate where  .
. 

A)
B)
C)
D)
E)
. A)
B)
C)
D)
E)
Question
Use the graph shown in the figure and identify points from A through I that satisfy the given condition.  and
and 
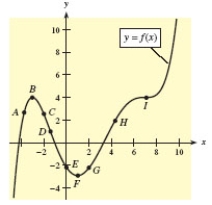
A)D
B)G
C)B
D)C
E)E
and A)D
B)G
C)B
D)C
E)E
Question
The following figure shows the growth of a population as a function of time. 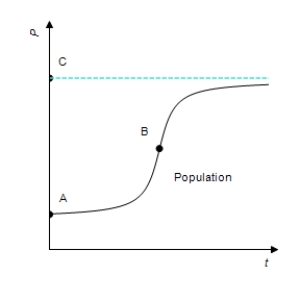 Which of A, B, and C correspond(s) to the point(s) at which the growth rate attains its maximum?
A)B
B)A
C)C
D)A and C
E)none of the above
Which of A, B, and C correspond(s) to the point(s) at which the growth rate attains its maximum? A)B
B)A
C)C
D)A and C
E)none of the above
Question
In this problem,  and its graph are given. Use the graph of
  to determine where
  has a point of inflection.
A)
B)
C)
D)
E)no point of inflection
and its graph are given. Use the graph of to determine where has a point of inflection. A)
B)
C)
D)
E)no point of inflection
Question
A function and its first and second derivatives are given. Use these to find all relative minima. 

A)
B)
C)
D)
E)no relative minima
A)
B)
C)
D)
E)no relative minima

Unlock Deck
Sign up to unlock the cards in this deck!
Unlock Deck
Unlock Deck
1/172
Play
Full screen (f)
Deck 11: Applications of Derivatives
1
For the given function, find all intervals of x-values where the function is decreasing.
A)
B)
C)
Or
D)
E)
A)
B)
C)
Or
D)
E)
2
For the given function, find the critical points.
A)
And
B)
And
C)
And
D)
And
E)(
And
A)
And
B)
And
C)
And
D)
And
E)(
And
And
3
Use the sign diagram for to determine x-values at which relative minima occur, where and .
A)
B)
C)
And
D)
E)no relative minima
to determine x-values at which relative minima occur, where and . A)
B)
C)
And
D)
E)no relative minima
no relative minima
4
Make a sign diagram for the function and determine all x-values at which relative maxima occur.
A)
B)
C)
D)
E)no relative maxima
A)
B)
C)
D)
E)no relative maxima
Unlock Deck
Unlock for access to all 172 flashcards in this deck.
Unlock Deck
k this deck
5
Use the graph of to identify at which of the indicated points the derivative does not change sign.
A)(-1, 2), (2, 4), (5, 6)
B)(-1, 2)
C)(-1, 2), (5, 6)
D)(-1, 2), (2, 4)
E)(2, 4)
to identify at which of the indicated points the derivative does not change sign. A)(-1, 2), (2, 4), (5, 6)
B)(-1, 2)
C)(-1, 2), (5, 6)
D)(-1, 2), (2, 4)
E)(2, 4)
Unlock Deck
Unlock for access to all 172 flashcards in this deck.
Unlock Deck
k this deck
6
For the given function and graph, estimate the coordinates of the relative maxima by observing the graph, where .
A)
B)
C)
D)
E)no relative maxima
. A)
B)
C)
D)
E)no relative maxima
Unlock Deck
Unlock for access to all 172 flashcards in this deck.
Unlock Deck
k this deck
7
Use the sign diagram for to determine the largest interval on which f (x) decreases, where and .
A)
B)
C)
D)
E)
to determine the largest interval on which f (x) decreases, where and . A)
B)
C)
D)
E)
Unlock Deck
Unlock for access to all 172 flashcards in this deck.
Unlock Deck
k this deck
8
For the given function and graph, determine all critical value(s), where .
A)
B)
C)
D)
And
E)
And
And
. A)
B)
C)
D)
And
E)
And
And
Unlock Deck
Unlock for access to all 172 flashcards in this deck.
Unlock Deck
k this deck
9
Use the sign diagram for to determine all critical values of f (x), where and .
A)
B)
C)
And
D)
E)
to determine all critical values of f (x), where and . A)
B)
C)
And
D)
E)
Unlock Deck
Unlock for access to all 172 flashcards in this deck.
Unlock Deck
k this deck
10
Make a sign diagram for the function and determine all x-values at which relative minima occur.
A)
B)
C)
D)
E)no relative minima
A)
B)
C)
D)
E)no relative minima
Unlock Deck
Unlock for access to all 172 flashcards in this deck.
Unlock Deck
k this deck
11
For the given function and graph, determine all critical point(s), where .
A)
B)
C)
D)
And
E)
And
And
. A)
B)
C)
D)
And
E)
And
And
Unlock Deck
Unlock for access to all 172 flashcards in this deck.
Unlock Deck
k this deck
12
Use the graph of to identify at which of the indicated points the derivative changes from positive to negative.
A)(5, 6)
B)(2, 4)
C)(-1, 2), (5, 6)
D)(-1, 2), (2, 4)
E)(2, 4), (5, 6)
to identify at which of the indicated points the derivative changes from positive to negative. A)(5, 6)
B)(2, 4)
C)(-1, 2), (5, 6)
D)(-1, 2), (2, 4)
E)(2, 4), (5, 6)
Unlock Deck
Unlock for access to all 172 flashcards in this deck.
Unlock Deck
k this deck
13
Use the sign diagram for to determine the largest interval on which f (x) increases, where and .
A)
B)
C)
D)
E)
to determine the largest interval on which f (x) increases, where and . A)
B)
C)
D)
E)
Unlock Deck
Unlock for access to all 172 flashcards in this deck.
Unlock Deck
k this deck
14
For the given function, find
A)
B)
C)
D)
E)
A)
B)
C)
D)
E)
Unlock Deck
Unlock for access to all 172 flashcards in this deck.
Unlock Deck
k this deck
15
For the given function and graph, estimate the coordinates of the relative minima by observing the graph, where .
A)
B)
C)
D)
E)no relative minima
. A)
B)
C)
D)
E)no relative minima
Unlock Deck
Unlock for access to all 172 flashcards in this deck.
Unlock Deck
k this deck
16
For the given function, find all intervals of x-values where the function is increasing.
A)
B)
C)
Or
D)
E)
A)
B)
C)
Or
D)
E)
Unlock Deck
Unlock for access to all 172 flashcards in this deck.
Unlock Deck
k this deck
17
For the given function, find all critical values.
A)
B)
And
C)
And
D)
And
E)
And
A)
B)
And
C)
And
D)
And
E)
And
Unlock Deck
Unlock for access to all 172 flashcards in this deck.
Unlock Deck
k this deck
18
For the given function, find .
A)
B)
C)
D)
E)
. A)
B)
C)
D)
E)
Unlock Deck
Unlock for access to all 172 flashcards in this deck.
Unlock Deck
k this deck
19
Use the graph of to identify at which of the indicated points the derivative changes from negative to positive.
A)(-1, 2), (2, 4)
B)(4, 1)
C)(-1, 2), (2, 4), (5, 6)
D)(2, 4)
E)(2, 4), (5, 6)
to identify at which of the indicated points the derivative changes from negative to positive. A)(-1, 2), (2, 4)
B)(4, 1)
C)(-1, 2), (2, 4), (5, 6)
D)(2, 4)
E)(2, 4), (5, 6)
Unlock Deck
Unlock for access to all 172 flashcards in this deck.
Unlock Deck
k this deck
20
Use the sign diagram for to determine x-values at which relative maxima occur, where and .
A)
B)
C)
And
D)
E)no relative maxima
to determine x-values at which relative maxima occur, where and . A)
B)
C)
And
D)
E)no relative maxima
Unlock Deck
Unlock for access to all 172 flashcards in this deck.
Unlock Deck
k this deck
21
For the given function, find the critical points.
A)
B)
C)
D)
E)
A)
B)
C)
D)
E)
Unlock Deck
Unlock for access to all 172 flashcards in this deck.
Unlock Deck
k this deck
22
For the given function find the relative maxima, and sketch the graph. You may check your graph with a graphing utility.
A)
B)
C)
D)
E)
A)
B)
C)
D)
E)
Unlock Deck
Unlock for access to all 172 flashcards in this deck.
Unlock Deck
k this deck
23
For the given function, use the graph to identify the x-value for which . You may use the derivative to check your conclusion.
A)
B)
C)
D)
E)
. You may use the derivative to check your conclusion. A)
B)
C)
D)
E)
Unlock Deck
Unlock for access to all 172 flashcards in this deck.
Unlock Deck
k this deck
24
For the given function, classify the critical points as relative maxima, relative minima, or points of inflection. In each case, you may check your conclusions with a graphing utility.
A)
Is a relative minimum and
Is point of inflection.
B)
Is a point of inflection and
Is a relative minimum.
C)
Is a point of inflection and
Is a relative maximum.
D)
Is a relative minimum and
Is a relative maximum.
E)
Is a relative maximum and
Is a relative minimum.
A)
Is a relative minimum and
Is point of inflection.
B)
Is a point of inflection and
Is a relative minimum.
C)
Is a point of inflection and
Is a relative maximum.
D)
Is a relative minimum and
Is a relative maximum.
E)
Is a relative maximum and
Is a relative minimum.
Unlock Deck
Unlock for access to all 172 flashcards in this deck.
Unlock Deck
k this deck
25
Both a function and its derivative are given. Use them to find the relative maxima.
A)
B)
C)
D)
E)no relative maxima
A)
B)
C)
D)
E)no relative maxima
Unlock Deck
Unlock for access to all 172 flashcards in this deck.
Unlock Deck
k this deck
26
For the given function, find the relative maxima.
A)
B)
C)
D)
E)no relative maxima
A)
B)
C)
D)
E)no relative maxima
Unlock Deck
Unlock for access to all 172 flashcards in this deck.
Unlock Deck
k this deck
27
For the given function, find the relative minima.
A)
B)
C)
D)
E)no relative minima
A)
B)
C)
D)
E)no relative minima
Unlock Deck
Unlock for access to all 172 flashcards in this deck.
Unlock Deck
k this deck
28
For the given function, use the graph to identify x-values for which . You may use the derivative to check your conclusion.
A)
B)
C)
D)
E)
. You may use the derivative to check your conclusion. A)
B)
C)
D)
E)
Unlock Deck
Unlock for access to all 172 flashcards in this deck.
Unlock Deck
k this deck
29
Both a function and its derivative are given. Use them to find all critical values.
A)
B)
C)
D)
E)
A)
B)
C)
D)
E)
Unlock Deck
Unlock for access to all 172 flashcards in this deck.
Unlock Deck
k this deck
30
Both a function and its derivative are given. Use them to find all critical points.
A)
,
,
B)
,
,
C)
,
,
D)
,
,
E)
,
,
A)
,
,
B)
,
,
C)
,
,
D)
,
,
E)
,
,
Unlock Deck
Unlock for access to all 172 flashcards in this deck.
Unlock Deck
k this deck
31
Both a function and its derivative are given. Use them to find intervals on which the function is decreasing.
A)
B)
C)
D)
Or
E)
A)
B)
C)
D)
Or
E)
Unlock Deck
Unlock for access to all 172 flashcards in this deck.
Unlock Deck
k this deck
32
For the given function, find intervals of x-values where the function is decreasing.
A)
B)
C)
D)
E)
A)
B)
C)
D)
E)
Unlock Deck
Unlock for access to all 172 flashcards in this deck.
Unlock Deck
k this deck
33
For the given function, find the critical values.
A)
And
B)
And
C)
And
D)
And
E)
And
A)
And
B)
And
C)
And
D)
And
E)
And
Unlock Deck
Unlock for access to all 172 flashcards in this deck.
Unlock Deck
k this deck
34
For the given function, find the horizontal points of inflection.
A)
B)
C)
D)
E)no horizontal points of inflection
A)
B)
C)
D)
E)no horizontal points of inflection
Unlock Deck
Unlock for access to all 172 flashcards in this deck.
Unlock Deck
k this deck
35
Both a function and its derivative are given. Use them to find the relative minima.
A)
B)
C)
D)
E)no relative minima
A)
B)
C)
D)
E)no relative minima
Unlock Deck
Unlock for access to all 172 flashcards in this deck.
Unlock Deck
k this deck
36
Use the derivative to locate all critical points. Use a graphing utility if desired. Round your answers to two decimal places.
A)
B)
C)
D)
E)
A)
B)
C)
D)
E)
Unlock Deck
Unlock for access to all 172 flashcards in this deck.
Unlock Deck
k this deck
37
For the given function, use the graph to identify x-values for which . You may use the derivative to check your conclusion.
A)
B)
C)
D)
E)
. You may use the derivative to check your conclusion. A)
B)
C)
D)
E)
Unlock Deck
Unlock for access to all 172 flashcards in this deck.
Unlock Deck
k this deck
38
For the given function, find intervals of x-values where the function is increasing.
A)
B)
C)
D)
E)
A)
B)
C)
D)
E)
Unlock Deck
Unlock for access to all 172 flashcards in this deck.
Unlock Deck
k this deck
39
For the given function find the relative minima, and sketch the graph. You may check your graph with a graphing utility.
A)
B)
And
C)
And
D)
E)
A)
B)
And
C)
And
D)
E)
Unlock Deck
Unlock for access to all 172 flashcards in this deck.
Unlock Deck
k this deck
40
Both a function and its derivative are given. Use them to find intervals on which the function is increasing.
A)
Or
Or
B)
C)
Or
D)
Or
E)
A)
Or
Or
B)
C)
Or
D)
Or
E)
Unlock Deck
Unlock for access to all 172 flashcards in this deck.
Unlock Deck
k this deck
41
A graph of is given. Use the graph to determine where f (x) is decreasing.
A)
B)
C)
D)
Or
E)
is given. Use the graph to determine where f (x) is decreasing. A)
B)
C)
D)
Or
E)
Unlock Deck
Unlock for access to all 172 flashcards in this deck.
Unlock Deck
k this deck
42
Use the indicated x-values on the graph of to determine intervals over which the graph is concave up.
A)
And
B)
C)
D)
E)
And
to determine intervals over which the graph is concave up. A)
And
B)
C)
D)
E)
And
Unlock Deck
Unlock for access to all 172 flashcards in this deck.
Unlock Deck
k this deck
43
A function and its graph are given. Use the second derivative to determine intervals on which the function is concave up. Check these results against the graph shown.
A)
B)
C)
D)
Or
E)
A)
B)
C)
D)
Or
E)
Unlock Deck
Unlock for access to all 172 flashcards in this deck.
Unlock Deck
k this deck
44
Suppose the average costs of a mining operation depend on the number of machines used, and average costs, in dollars, are given by , , where x is the number of machines used. Over what interval in the domain do average costs increase?
A)
B)
C)
D)
E)
, , where x is the number of machines used. Over what interval in the domain do average costs increase? A)
B)
C)
D)
E)
Unlock Deck
Unlock for access to all 172 flashcards in this deck.
Unlock Deck
k this deck
45
A graph of is given. Use the graph to determine all critical values of .
A)
B)
C)
D)
E)
,
,
is given. Use the graph to determine all critical values of . A)
B)
C)
D)
E)
,
,
Unlock Deck
Unlock for access to all 172 flashcards in this deck.
Unlock Deck
k this deck
46
Suppose that a chain of auto service stations, Quick-Oil, Inc., has found that its monthly sales volume y (in thousands of dollars) is related to the price p (in dollars) of an oil change by . Is y increasing or decreasing for all values of
A)increasing
B)decreasing
. Is y increasing or decreasing for all values of A)increasing
B)decreasing
Unlock Deck
Unlock for access to all 172 flashcards in this deck.
Unlock Deck
k this deck
47
The number of milligrams x of a medication in the bloodstream t hours after a dose is taken can be modeled by , . Find the maximum value of x. Round your answer to two decimal places.
A)2.83 mg
B)530.33 mg
C)1166.73 mg
D)8.77 mg
E)1125.30 mg
, . Find the maximum value of x. Round your answer to two decimal places. A)2.83 mg
B)530.33 mg
C)1166.73 mg
D)8.77 mg
E)1125.30 mg
Unlock Deck
Unlock for access to all 172 flashcards in this deck.
Unlock Deck
k this deck
48
The number of milligrams x of a medication in the bloodstream t hours after a dose is taken can be modeled by , . Find the t-value at which x is maximum. Round your answer to two decimal places.
A)0 hours
B)1.41 hours
C)1767.77 hours
D)3.41 hours
E)3.45 hours
, . Find the t-value at which x is maximum. Round your answer to two decimal places. A)0 hours
B)1.41 hours
C)1767.77 hours
D)3.41 hours
E)3.45 hours
Unlock Deck
Unlock for access to all 172 flashcards in this deck.
Unlock Deck
k this deck
49
A graph of is given. Use the graph to determine where the graph of has a relative minimum.
A)
B)
C)
D)
E)no relative minima
is given. Use the graph to determine where the graph of has a relative minimum. A)
B)
C)
D)
E)no relative minima
Unlock Deck
Unlock for access to all 172 flashcards in this deck.
Unlock Deck
k this deck
50
A function and its graph are given. Use the second derivative to determine intervals on which the function is concave down. Check these results against the graph shown.
A)
B)
C)
D)
Or
E)
A)
B)
C)
D)
Or
E)
Unlock Deck
Unlock for access to all 172 flashcards in this deck.
Unlock Deck
k this deck
51
Suppose the average costs of a mining operation depend on the number of machines used, and average costs, in dollars, are given by , , where x is the number of machines used. How many machines give minimum average costs?
A)Using 25 machines gives the minimum average costs.
B)Using zero machines gives the minimum average costs.
C)Using 35 machines gives the minimum average costs.
D)Using 50 machines gives the minimum average costs.
E)Using 55 machines gives the minimum average costs.
, , where x is the number of machines used. How many machines give minimum average costs? A)Using 25 machines gives the minimum average costs.
B)Using zero machines gives the minimum average costs.
C)Using 35 machines gives the minimum average costs.
D)Using 50 machines gives the minimum average costs.
E)Using 55 machines gives the minimum average costs.
Unlock Deck
Unlock for access to all 172 flashcards in this deck.
Unlock Deck
k this deck
52
Use the indicated -values on the graph of to find all the intervals where .
A)
B)
And
C)
D)
E)
And
-values on the graph of to find all the intervals where . A)
B)
And
C)
D)
E)
And
Unlock Deck
Unlock for access to all 172 flashcards in this deck.
Unlock Deck
k this deck
53
The number of milligrams x of a medication in the bloodstream t hours after a dose is taken can be modeled by , . For what -values is increasing? Round answers to two decimal places.
A)
B)
C)
D)
E)
, . For what -values is increasing? Round answers to two decimal places.A)
B)
C)
D)
E)
Unlock Deck
Unlock for access to all 172 flashcards in this deck.
Unlock Deck
k this deck
54
Suppose the average costs of a mining operation depend on the number of machines used, and average costs, in dollars, are given by , , where x is the number of machines used. What is the minimum average cost? Round your answer to the nearest dollar.
A)$0
B)$35
C)$490
D)$245
E)$8,582
, , where x is the number of machines used. What is the minimum average cost? Round your answer to the nearest dollar. A)$0
B)$35
C)$490
D)$245
E)$8,582
Unlock Deck
Unlock for access to all 172 flashcards in this deck.
Unlock Deck
k this deck
55
A function and its graph are given. Use the second derivative to locate all x-values of points of inflection on the graph of . Check these results against the graph shown.
A)
B)
C)
D)
,
E)
,
,
. Check these results against the graph shown. A)
B)
C)
D)
,
E)
,
,
Unlock Deck
Unlock for access to all 172 flashcards in this deck.
Unlock Deck
k this deck
56
Use the indicated x-values on the graph of to find the x-coordinate of any horizontal point of inflection.
A)a
B)c
C)f
D)e
E)d
to find the x-coordinate of any horizontal point of inflection. A)a
B)c
C)f
D)e
E)d
Unlock Deck
Unlock for access to all 172 flashcards in this deck.
Unlock Deck
k this deck
57
Suppose the average costs of a mining operation depend on the number of machines used, and average costs, in dollars, are given by , , where x is the number of machines used. Over what interval in the domain do average costs decrease?
A)
B)
C)
D)
E)
, , where x is the number of machines used. Over what interval in the domain do average costs decrease? A)
B)
C)
D)
E)
Unlock Deck
Unlock for access to all 172 flashcards in this deck.
Unlock Deck
k this deck
58
Suppose the average costs of a mining operation depend on the number of machines used, and average costs, in dollars, are given by , , where x is the number of machines used. Find the critical values of that lie in the domain of the problem.
A)
B)
C)
D)
E)
, , where x is the number of machines used. Find the critical values of that lie in the domain of the problem.
A)
B)
C)
D)
E)
Unlock Deck
Unlock for access to all 172 flashcards in this deck.
Unlock Deck
k this deck
59
Determine whether the given function is concave up or concave down at the indicated point. at
A)concave down
B)concave up
at A)concave down
B)concave up
Unlock Deck
Unlock for access to all 172 flashcards in this deck.
Unlock Deck
k this deck
60
A graph of is given. Use the graph to determine where the graph of has a relative maximum.
A)
B)
C)
D)
E)no relative maxima
is given. Use the graph to determine where the graph of has a relative maximum. A)
B)
C)
D)
E)no relative maxima
Unlock Deck
Unlock for access to all 172 flashcards in this deck.
Unlock Deck
k this deck
61
Find all points of inflection of the given function. Round your answer to two decimal places.
A)
B)
C)
D)
E)
A)
B)
C)
D)
E)
Unlock Deck
Unlock for access to all 172 flashcards in this deck.
Unlock Deck
k this deck
62
In this problem, and its graph are given. Use the graph of to determine where is concave up.
A)
B)
C)
D)
E)
and its graph are given. Use the graph of to determine where is concave up. A)
B)
C)
D)
E)
Unlock Deck
Unlock for access to all 172 flashcards in this deck.
Unlock Deck
k this deck
63
Find all relative minima of the given function.
A)
B)
C)
D)
,
E)no relative minima
A)
B)
C)
D)
,
E)no relative minima
Unlock Deck
Unlock for access to all 172 flashcards in this deck.
Unlock Deck
k this deck
64
Use the graph shown in the figure and identify points from A through I that satisfy the given condition. and
A)I
B)F
C)C
D)D
E)H
and A)I
B)F
C)C
D)D
E)H
Unlock Deck
Unlock for access to all 172 flashcards in this deck.
Unlock Deck
k this deck
65
In this problem, and its graph are given. Use the graph of to determine where is concave down.
A)
B)
C)
D)
E)
and its graph are given. Use the graph of to determine where is concave down. A)
B)
C)
D)
E)
Unlock Deck
Unlock for access to all 172 flashcards in this deck.
Unlock Deck
k this deck
66
A function and its graph are given. From the graph, estimate where .
A)
B)
C)
D)
E)
. A)
B)
C)
D)
E)
Unlock Deck
Unlock for access to all 172 flashcards in this deck.
Unlock Deck
k this deck
67
The following figure shows the growth of a population as a function of time. If P represents the population and t represents the time, write a mathematical symbol that represents the rate of change (growth rate) of the population with respect to time.
A)
B)
C)
D)
E)
If P represents the population and t represents the time, write a mathematical symbol that represents the rate of change (growth rate) of the population with respect to time.A)
B)
C)
D)
E)
Unlock Deck
Unlock for access to all 172 flashcards in this deck.
Unlock Deck
k this deck
68
A function and its first and second derivatives are given. Use these to find the relative maxima.
A)
B)
C)
D)
E)no relative maxima
A)
B)
C)
D)
E)no relative maxima
Unlock Deck
Unlock for access to all 172 flashcards in this deck.
Unlock Deck
k this deck
69
Use the graph shown in the figure and identify points from A through I that satisfy the given condition. and
A)C
B)F
C)I
D)A
E)B
and A)C
B)F
C)I
D)A
E)B
Unlock Deck
Unlock for access to all 172 flashcards in this deck.
Unlock Deck
k this deck
70
A function and its graph are given. From the graph estimate where has a relative maximum.
A)
B)
C)
D)
E)no relative maxima
has a relative maximum. A)
B)
C)
D)
E)no relative maxima
Unlock Deck
Unlock for access to all 172 flashcards in this deck.
Unlock Deck
k this deck
71
A function and its first and second derivatives are given. Use these to find all points of inflection.
A)
B)
C)
D)
E)no points of inflection
A)
B)
C)
D)
E)no points of inflection
Unlock Deck
Unlock for access to all 172 flashcards in this deck.
Unlock Deck
k this deck
72
Find all relative maxima of the given function.
A)
B)
C)
D)
E)no relative maxima
A)
B)
C)
D)
E)no relative maxima
Unlock Deck
Unlock for access to all 172 flashcards in this deck.
Unlock Deck
k this deck
73
A function and its graph are given. From the graph estimate where has a relative minimum.
A)
B)
C)
D)
E)no relative minima
has a relative minimum. A)
B)
C)
D)
E)no relative minima
Unlock Deck
Unlock for access to all 172 flashcards in this deck.
Unlock Deck
k this deck
74
A function and its first and second derivatives are given. Use these to find all critical values.
A)
B)
C)
D)
E)
A)
B)
C)
D)
E)
Unlock Deck
Unlock for access to all 172 flashcards in this deck.
Unlock Deck
k this deck
75
Use the graph shown in the figure and identify points from A through I that satisfy the given condition. and
A)B
B)E
C)A
D)D
E)H
and A)B
B)E
C)A
D)D
E)H
Unlock Deck
Unlock for access to all 172 flashcards in this deck.
Unlock Deck
k this deck
76
A function and its graph are given. From the graph, estimate where .
A)
B)
C)
D)
E)
. A)
B)
C)
D)
E)
Unlock Deck
Unlock for access to all 172 flashcards in this deck.
Unlock Deck
k this deck
77
Use the graph shown in the figure and identify points from A through I that satisfy the given condition. and
A)D
B)G
C)B
D)C
E)E
and A)D
B)G
C)B
D)C
E)E
Unlock Deck
Unlock for access to all 172 flashcards in this deck.
Unlock Deck
k this deck
78
The following figure shows the growth of a population as a function of time. Which of A, B, and C correspond(s) to the point(s) at which the growth rate attains its maximum?
A)B
B)A
C)C
D)A and C
E)none of the above
Which of A, B, and C correspond(s) to the point(s) at which the growth rate attains its maximum? A)B
B)A
C)C
D)A and C
E)none of the above
Unlock Deck
Unlock for access to all 172 flashcards in this deck.
Unlock Deck
k this deck
79
In this problem, and its graph are given. Use the graph of to determine where has a point of inflection.
A)
B)
C)
D)
E)no point of inflection
and its graph are given. Use the graph of to determine where has a point of inflection. A)
B)
C)
D)
E)no point of inflection
Unlock Deck
Unlock for access to all 172 flashcards in this deck.
Unlock Deck
k this deck
80
A function and its first and second derivatives are given. Use these to find all relative minima.
A)
B)
C)
D)
E)no relative minima
A)
B)
C)
D)
E)no relative minima
Unlock Deck
Unlock for access to all 172 flashcards in this deck.
Unlock Deck
k this deck
Unlock Deck
Unlock for access to all 172 flashcards in this deck.


