Deck 14: Simple Linear Regression
Full screen (f)
Question
Question
Question
Question
Question
Question
Question
Question
Question
Question
Question
Question
Question
Question
Question
Question
Question
Question
Question
Question
Question
Question
Question
Question
Question
Question
Question
Question
Question
Question
Question
Question
Question
Question
Question
Question
Question
Question
Question
Question
Question
Question
Question
Question
Given below are seven observations collected in a regression study on two variables, x (independent variable) and y (dependent variable). Use Excel to develop a scatter diagram and to compute the least squares estimated regression equation. 
Question
Question
Question
Question
Question
Question
Question
Question
A company has recorded data on the weekly sales for its product (y) and the unit price of the competitor's product (x). The data resulting from a random sample of seven weeks follows. Use Excel to develop a scatter diagram and to compute the least squares estimated regression equation and the coefficient of determination. 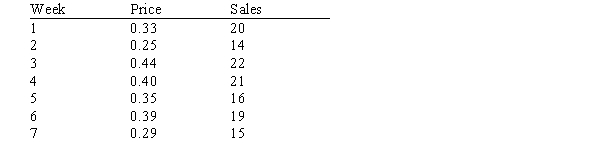
Question
A company has recorded data on the weekly sales for its product (y) and the unit price of the competitor's product (x). The data resulting from a random sample of seven weeks follows. Use Excel's Regression tool to construct a residual plot and use it to determine if any model assumptions have been violated. 
Question
Question
Given below are seven observations collected in a regression study on two variables, x (independent variable) and y (dependent variable). Use Excel's Regression tool to construct a residual plot and use it to determine if any model assumptions have been violated. 
Question
Question
Given below are seven observations collected in a regression study on two variables, x (independent variable) and y (dependent variable). Use Excel to develop a scatter diagram and to compute the least squares estimated regression equation and the coefficient of determination. 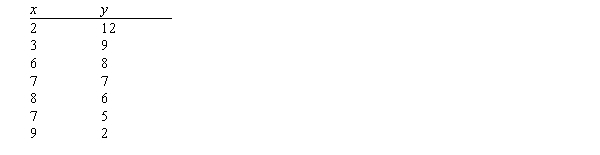
Question
Given below are seven observations collected in a regression study on two variables, x (independent variable) and y (dependent variable). Use Excel to 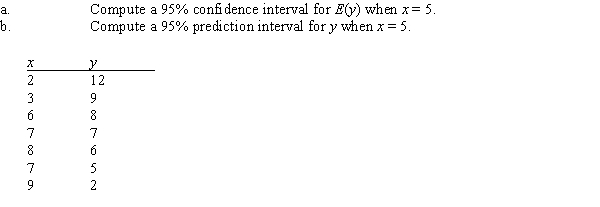
Question
A company has recorded data on the weekly sales for its product (y) and the unit price of the competitor's product (x). The data resulting from a random sample of seven weeks follows. Use Excel to 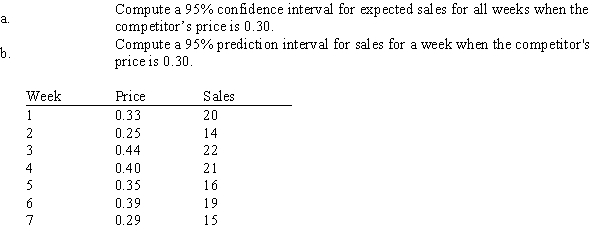
Question
Question
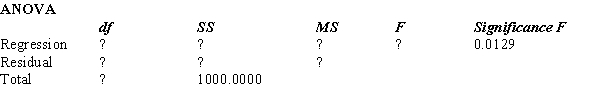
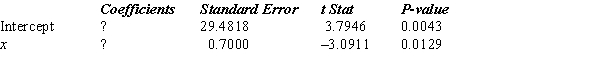
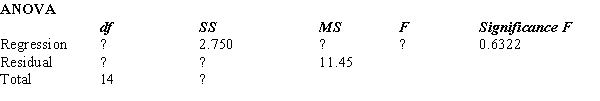
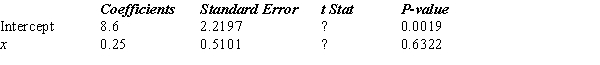
Part of an Excel output relating x (independent variable) and y (dependent variable) is shown below. Fill in all the blanks marked with a question mark. 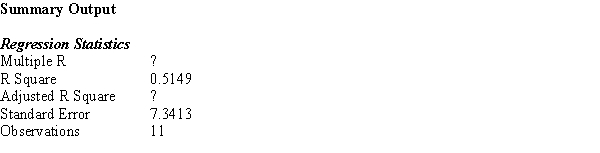
Question
Given below are seven observations collected in a regression study on two variables, x (independent variable) and y (dependent variable). Use Excel's Regression tool to construct a residual plot and use it to determine if any model assumptions have been violated. 
Question
Coyote Cable has been experiencing an increase in cable service subscribers in recent months due to increased advertising and an influx of new residents to the region. The number of subscribers (in 1000s) for the last 16 months is as follows: 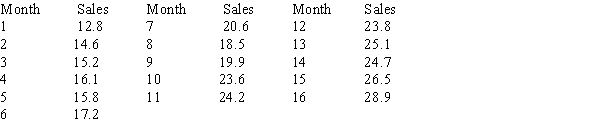
Using simple linear regression, forecast the number of subscribers for months 17, 18, 19, and 20.
Using simple linear regression, forecast the number of subscribers for months 17, 18, 19, and 20.
Question
Part of an Excel output relating x (independent variable) and y (dependent variable) is shown below. Fill in all the blanks marked with a question mark. 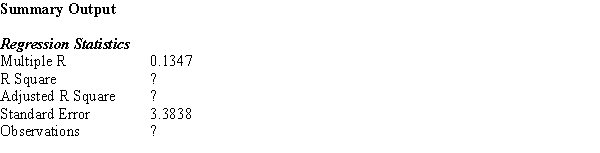

Unlock Deck
Sign up to unlock the cards in this deck!
Unlock Deck
Unlock Deck
1/64
Play
Full screen (f)
Deck 14: Simple Linear Regression
1
The interval estimate of the mean value of y for a given value of x is the _____.
A) confidence interval
B) prediction interval
C) residual interval
D) correlation interval
A) confidence interval
B) prediction interval
C) residual interval
D) correlation interval
confidence interval
2
The difference between the observed value of the dependent variable and the value predicted by using the estimated regression equation is called _____.
A) the standard error
B) a residual
C) a prediction interval
D) the variance
A) the standard error
B) a residual
C) a prediction interval
D) the variance
a residual
3
A regression analysis between demand (y in 1000 units) and price (x in dollars) resulted in the following equation: ? = 9 ? 3x
?
The above equation implies that if the price is increased by $1, the demand is expected to _____.
A) increase by 6 units
B) decrease by 3 units
C) decrease by 6,000 units
D) decrease by 3,000 units
?
The above equation implies that if the price is increased by $1, the demand is expected to _____.
A) increase by 6 units
B) decrease by 3 units
C) decrease by 6,000 units
D) decrease by 3,000 units
decrease by 3,000 units
4
In a simple regression analysis (where y is a dependent and x an independent variable), if the y-intercept is positive, then it must be true that _____.
A) there is a positive correlation between x and y
B) there is a negative correlation between x and y
C) if x is increased, y must also increase
D) None of the answers is correct.
A) there is a positive correlation between x and y
B) there is a negative correlation between x and y
C) if x is increased, y must also increase
D) None of the answers is correct.
Unlock Deck
Unlock for access to all 64 flashcards in this deck.
Unlock Deck
k this deck
5
In a residual plot against x that does NOT suggest we should challenge the assumptions of our regression model, we would expect to see a _____.
A) horizontal band of points centered near 0
B) widening band of points
C) band of points having a slope consistent with that of the regression equation
D) parabolic band of points
A) horizontal band of points centered near 0
B) widening band of points
C) band of points having a slope consistent with that of the regression equation
D) parabolic band of points
Unlock Deck
Unlock for access to all 64 flashcards in this deck.
Unlock Deck
k this deck
6
In regression analysis, the independent variable is typically plotted on the _____.
A) y-axis of a scatter diagram
B) x-axis of a scatter diagram
C) y-axis of a histogram
D) x-axis of a histogram
A) y-axis of a scatter diagram
B) x-axis of a scatter diagram
C) y-axis of a histogram
D) x-axis of a histogram
Unlock Deck
Unlock for access to all 64 flashcards in this deck.
Unlock Deck
k this deck
7
The least squares criterion is _____.
A) min
B) min
C) min
D) min
A) min
B) min
C) min
D) min
Unlock Deck
Unlock for access to all 64 flashcards in this deck.
Unlock Deck
k this deck
8
A procedure used for finding the equation of a straight line that provides the best approximation for the relationship between the independent and dependent variables is ______.
A) correlation analysis
B) the mean squares method
C) the least squares method
D) the most squares method
A) correlation analysis
B) the mean squares method
C) the least squares method
D) the most squares method
Unlock Deck
Unlock for access to all 64 flashcards in this deck.
Unlock Deck
k this deck
9
Regression analysis is a statistical procedure for developing a mathematical equation that describes how _____.
A) one independent and one or more dependent variables are related
B) several independent and several dependent variables are related
C) one dependent and one or more independent variables are related
D) None of the answers is correct.
A) one independent and one or more dependent variables are related
B) several independent and several dependent variables are related
C) one dependent and one or more independent variables are related
D) None of the answers is correct.
Unlock Deck
Unlock for access to all 64 flashcards in this deck.
Unlock Deck
k this deck
10
A measure of the strength of the relationship between two variables is the _____.
A) confidence interval estimate
B) slope b1 of the estimated regression line
C) standard error of the estimate
D) correlation coefficient
A) confidence interval estimate
B) slope b1 of the estimated regression line
C) standard error of the estimate
D) correlation coefficient
Unlock Deck
Unlock for access to all 64 flashcards in this deck.
Unlock Deck
k this deck
11
Regression analysis was applied between sales (in $1000s) and advertising (in $100s), and the following regression function was obtained. ? = 500 + 4x
?
Based on the above estimated regression line, if advertising is $10,000, then the point estimate for sales (in dollars) is _____.
A) $900
B) $900,000
C) $40,500
D) $505,000
?
Based on the above estimated regression line, if advertising is $10,000, then the point estimate for sales (in dollars) is _____.
A) $900
B) $900,000
C) $40,500
D) $505,000
Unlock Deck
Unlock for access to all 64 flashcards in this deck.
Unlock Deck
k this deck
12
As the goodness of fit for the estimated regression equation increases, the _____.
A) absolute value of the regression equation's slope increases
B) value of the regression equation's y-intercept decreases
C) value of the coefficient of determination increases
D) value of the correlation coefficient increases
A) absolute value of the regression equation's slope increases
B) value of the regression equation's y-intercept decreases
C) value of the coefficient of determination increases
D) value of the correlation coefficient increases
Unlock Deck
Unlock for access to all 64 flashcards in this deck.
Unlock Deck
k this deck
13
In regression analysis, if the dependent variable is measured in dollars, the independent variable _____.
A) must also be in dollars
B) must be in some unit of currency
C) can be any units
D) cannot be in dollars
A) must also be in dollars
B) must be in some unit of currency
C) can be any units
D) cannot be in dollars
Unlock Deck
Unlock for access to all 64 flashcards in this deck.
Unlock Deck
k this deck
14
The equation that describes how the dependent variable (y) is related to the independent variable (x) is called _____.
A) the correlation model
B) the regression model
C) correlation analysis
D) None of the answers is correct.
A) the correlation model
B) the regression model
C) correlation analysis
D) None of the answers is correct.
Unlock Deck
Unlock for access to all 64 flashcards in this deck.
Unlock Deck
k this deck
15
Application of the least squares method results in values of the y-intercept and the slope that minimizes the sum of the squared deviations between the _____.
A) observed values of the independent variable and the predicted values of the independent variable
B) actual values of the independent variable and the predicted values of the dependent variable
C) observed values of the dependent variable and the predicted values of the dependent variable
D) None of the answers is correct.
Unlock Deck
Unlock for access to all 64 flashcards in this deck.
Unlock Deck
k this deck
16
The proportion of the variation in the dependent variable y that is explained by the estimated regression equation is measured by the _____.
A) correlation coefficient
B) standard error of the estimate
C) coefficient of determination
D) confidence interval estimate
A) correlation coefficient
B) standard error of the estimate
C) coefficient of determination
D) confidence interval estimate
Unlock Deck
Unlock for access to all 64 flashcards in this deck.
Unlock Deck
k this deck
17
A least squares regression line ______.
A) may be used to predict a value of y if the corresponding x value is given
B) implies a cause-effect relationship between x and y
C) can only be determined if a good linear relationship exists between x and y
D) All of the answers are correct.
A) may be used to predict a value of y if the corresponding x value is given
B) implies a cause-effect relationship between x and y
C) can only be determined if a good linear relationship exists between x and y
D) All of the answers are correct.
Unlock Deck
Unlock for access to all 64 flashcards in this deck.
Unlock Deck
k this deck
18
In regression analysis, the variable that is being predicted is the _____.
A) dependent variable
B) independent variable
C) intervening variable
D) None of the answers is correct.
A) dependent variable
B) independent variable
C) intervening variable
D) None of the answers is correct.
Unlock Deck
Unlock for access to all 64 flashcards in this deck.
Unlock Deck
k this deck
19
Regression analysis was applied between sales (in $1000s) and advertising (in $100s), and the following regression function was obtained. ? = 80 + 6.2x
?
Based on the above estimated regression line, if advertising is $10,000, then the point estimate for sales (in dollars) is _____.
A) $62,080
B) $142,000
C) $700
D) $700,000
?
Based on the above estimated regression line, if advertising is $10,000, then the point estimate for sales (in dollars) is _____.
A) $62,080
B) $142,000
C) $700
D) $700,000
Unlock Deck
Unlock for access to all 64 flashcards in this deck.
Unlock Deck
k this deck
20
In a regression analysis, the variable that is used to predict the dependent variable ______.
A) must have the same units as the variable doing the predicting
B) is the independent variable
C) is the dependent variable
D) usually is denoted by x
A) must have the same units as the variable doing the predicting
B) is the independent variable
C) is the dependent variable
D) usually is denoted by x
Unlock Deck
Unlock for access to all 64 flashcards in this deck.
Unlock Deck
k this deck
21
In a regression analysis, if r2 = 1, then _____.
A) SSE = SST
B) SSE = 1
C) SSR = SSE
D) SSR = SST
A) SSE = SST
B) SSE = 1
C) SSR = SSE
D) SSR = SST
Unlock Deck
Unlock for access to all 64 flashcards in this deck.
Unlock Deck
k this deck
22
If there is a very strong correlation between two variables, then the coefficient of correlation must be _____.
A) much larger than 1, if the correlation is positive
B) much smaller than 1, if the correlation is negative
C) either much larger than 1 or much smaller than 1
D) None of the answers is correct.
A) much larger than 1, if the correlation is positive
B) much smaller than 1, if the correlation is negative
C) either much larger than 1 or much smaller than 1
D) None of the answers is correct.
Unlock Deck
Unlock for access to all 64 flashcards in this deck.
Unlock Deck
k this deck
23
A regression analysis between sales (in $1000s) and price (in dollars) resulted in the following equation: ? = 50,000 ? 8x
?
The above equation implies that an increase of _____.
A) $1 in price is associated with a decrease of $8 in sales
B) $8 in price is associated with an increase of $8,000 in sales
C) $1 in price is associated with a decrease of $42,000 in sales
D) $1 in price is associated with a decrease of $8,000 in sales
Unlock Deck
Unlock for access to all 64 flashcards in this deck.
Unlock Deck
k this deck
24
If the coefficient of determination is a positive value, then the regression equation _____.
A) must have a positive slope
B) must have a negative slope
C) could have either a positive or a negative slope
D) must have a positive y-intercept
A) must have a positive slope
B) must have a negative slope
C) could have either a positive or a negative slope
D) must have a positive y-intercept
Unlock Deck
Unlock for access to all 64 flashcards in this deck.
Unlock Deck
k this deck
25
If a data set has SST = 2,000 and SSE = 800, then the coefficient of determination is _____.
A) .4
B) .6
C) .5
D) .8
A) .4
B) .6
C) .5
D) .8
Unlock Deck
Unlock for access to all 64 flashcards in this deck.
Unlock Deck
k this deck
26
In simple linear regression, r2 is the _____.
A) estimated regression equation
B) coefficient of correlation
C) sum of the squared residuals
D) coefficient of determination
A) estimated regression equation
B) coefficient of correlation
C) sum of the squared residuals
D) coefficient of determination
Unlock Deck
Unlock for access to all 64 flashcards in this deck.
Unlock Deck
k this deck
27
If the coefficient of correlation is .4, the percentage of variation in the dependent variable explained by the estimated regression equation _____.
A) is 40%
B) is 16%
C) is 4%
D) can be any positive value
A) is 40%
B) is 16%
C) is 4%
D) can be any positive value
Unlock Deck
Unlock for access to all 64 flashcards in this deck.
Unlock Deck
k this deck
28
Which of the following is correct?
A) SSE = SSR + SST
B) SSR = SSE + SST
C) SST = SSR + SSE
D) SST = (SSR)2
A) SSE = SSR + SST
B) SSR = SSE + SST
C) SST = SSR + SSE
D) SST = (SSR)2
Unlock Deck
Unlock for access to all 64 flashcards in this deck.
Unlock Deck
k this deck
29
A regression analysis between sales (y in $1000) and advertising (x in dollars) resulted in the following equation: = 50,000 + 6x ?
The above equation implies that an increase of _____.
A) $6 in advertising is associated with an increase of $6,000 in sales
B) $1 in advertising is associated with an increase of $6 in sales
C) $1 in advertising is associated with an increase of $56,000 in sales
D) $1 in advertising is associated with an increase of $6,000 in sales
Unlock Deck
Unlock for access to all 64 flashcards in this deck.
Unlock Deck
k this deck
30
It is possible for the coefficient of determination to be _____.
A) larger than 1
B) less than 1
C) less than 0
D) All of the answers are correct, depending on the situation under consideration.
A) larger than 1
B) less than 1
C) less than 0
D) All of the answers are correct, depending on the situation under consideration.
Unlock Deck
Unlock for access to all 64 flashcards in this deck.
Unlock Deck
k this deck
31
If the coefficient of determination is equal to 1, then the coefficient of correlation _____.
A) must also be equal to 1
B) can be either -1 or 1
C) can be any value between -1 and 1
D) must be -1
A) must also be equal to 1
B) can be either -1 or 1
C) can be any value between -1 and 1
D) must be -1
Unlock Deck
Unlock for access to all 64 flashcards in this deck.
Unlock Deck
k this deck
32
If all the points of a scatter diagram lie on the least squares regression line, then the coefficient of determination for these variables based on these data _____.
A) is 0
B) is 1
C) is either 1 or -1, depending upon whether the relationship is positive or negative
D) could be any value between -1 and 1
A) is 0
B) is 1
C) is either 1 or -1, depending upon whether the relationship is positive or negative
D) could be any value between -1 and 1
Unlock Deck
Unlock for access to all 64 flashcards in this deck.
Unlock Deck
k this deck
33
In regression and correlation analysis, if SSE and SST are known, then with this information the _____.
A) coefficient of determination can be computed
B) slope of the line can be computed
C) y-intercept can be computed
D) All of the answers are correct.
A) coefficient of determination can be computed
B) slope of the line can be computed
C) y-intercept can be computed
D) All of the answers are correct.
Unlock Deck
Unlock for access to all 64 flashcards in this deck.
Unlock Deck
k this deck
34
If the coefficient of correlation is .8, then the percentage of variation in the dependent variable explained by the estimated regression equation is _____.
A) 0.80%
B) 80%
C) 0.64%
D) 64%
A) 0.80%
B) 80%
C) 0.64%
D) 64%
Unlock Deck
Unlock for access to all 64 flashcards in this deck.
Unlock Deck
k this deck
35
In a regression analysis, if r2 = 1, then _____.
A) SSE must also be equal to 1
B) SSE must be equal to 0
C) SSE can be any positive value
D) SSE must be negative
A) SSE must also be equal to 1
B) SSE must be equal to 0
C) SSE can be any positive value
D) SSE must be negative
Unlock Deck
Unlock for access to all 64 flashcards in this deck.
Unlock Deck
k this deck
36
In a regression analysis, if SSE = 200 and SSR = 300, then the coefficient of determination is _____.
A) .667
B) .600
C) .400
D) 1.500
A) .667
B) .600
C) .400
D) 1.500
Unlock Deck
Unlock for access to all 64 flashcards in this deck.
Unlock Deck
k this deck
37
In a regression analysis, if SST = 4500 and SSE = 1575, then the coefficient of determination is _____.
A) .35
B) .65
C) 2.85
D) .45
A) .35
B) .65
C) 2.85
D) .45
Unlock Deck
Unlock for access to all 64 flashcards in this deck.
Unlock Deck
k this deck
38
In a regression analysis, if SSE = 500 and SSR = 300, then the coefficient of determination is _____.
A) .600
B) .166
C) 1.666
D) .375
A) .600
B) .166
C) 1.666
D) .375
Unlock Deck
Unlock for access to all 64 flashcards in this deck.
Unlock Deck
k this deck
39
SSE can never be _____.
A) larger than SST
B) smaller than SST
C) equal to 1
D) equal to 0
A) larger than SST
B) smaller than SST
C) equal to 1
D) equal to 0
Unlock Deck
Unlock for access to all 64 flashcards in this deck.
Unlock Deck
k this deck
40
Larger values of r2 imply that the observations are more closely grouped about the _____.
A) average value of the independent variables
B) average value of the dependent variable
C) least squares line
D) origin
A) average value of the independent variables
B) average value of the dependent variable
C) least squares line
D) origin
Unlock Deck
Unlock for access to all 64 flashcards in this deck.
Unlock Deck
k this deck
41
The standardized residual is provided by dividing each residual by its _____.
A) mean residual
B) corresponding x value
C) standard deviation
D) z-score
A) mean residual
B) corresponding x value
C) standard deviation
D) z-score
Unlock Deck
Unlock for access to all 64 flashcards in this deck.
Unlock Deck
k this deck
42
The numerical value of the coefficient of determination ______.
A) is always larger than the coefficient of correlation
B) is always smaller than the coefficient of correlation
C) is negative if the coefficient of determination is negative
D) can be larger or smaller than the coefficient of correlation
A) is always larger than the coefficient of correlation
B) is always smaller than the coefficient of correlation
C) is negative if the coefficient of determination is negative
D) can be larger or smaller than the coefficient of correlation
Unlock Deck
Unlock for access to all 64 flashcards in this deck.
Unlock Deck
k this deck
43
An observation that has a strong effect on the regression results is called a(n) _____.
A) residual
B) sum of squares error
C) influential observation
D) None of the answers is correct.
A) residual
B) sum of squares error
C) influential observation
D) None of the answers is correct.
Unlock Deck
Unlock for access to all 64 flashcards in this deck.
Unlock Deck
k this deck
44
Given below are seven observations collected in a regression study on two variables, x (independent variable) and y (dependent variable). Use Excel to develop a scatter diagram and to compute the least squares estimated regression equation.
Unlock Deck
Unlock for access to all 64 flashcards in this deck.
Unlock Deck
k this deck
45
A data point (observation) that does not fit the trend shown by the remaining data is called a(n) _____.
A) residual
B) outlier
C) point estimate
D) None of the answers is correct.
A) residual
B) outlier
C) point estimate
D) None of the answers is correct.
Unlock Deck
Unlock for access to all 64 flashcards in this deck.
Unlock Deck
k this deck
46
In regression analysis, which of the following is NOT a required assumption about the error term ε?
A) The expected value of the error term is 0.
B) The variance of the error term is the same for all values of x.
C) The values of the error term are independent.
D) All are required assumptions about the error term.
A) The expected value of the error term is 0.
B) The variance of the error term is the same for all values of x.
C) The values of the error term are independent.
D) All are required assumptions about the error term.
Unlock Deck
Unlock for access to all 64 flashcards in this deck.
Unlock Deck
k this deck
47
Compared to the confidence interval estimate for a particular value of y (in a linear regression model), the interval estimate for an average value of y will be _____.
A) narrower
B) wider
C) the same
D) Not enough information is given.
A) narrower
B) wider
C) the same
D) Not enough information is given.
Unlock Deck
Unlock for access to all 64 flashcards in this deck.
Unlock Deck
k this deck
48
If the coefficient of determination is .81, then the coefficient of correlation _____.
A) is .6561
B) must be 0.9
C) must be positive
D) None of the answers is correct.
A) is .6561
B) must be 0.9
C) must be positive
D) None of the answers is correct.
Unlock Deck
Unlock for access to all 64 flashcards in this deck.
Unlock Deck
k this deck
49
Data points having high leverage are often _____.
A) residuals
B) sum of squares error
C) influential
D) None of the answers is correct.
A) residuals
B) sum of squares error
C) influential
D) None of the answers is correct.
Unlock Deck
Unlock for access to all 64 flashcards in this deck.
Unlock Deck
k this deck
50
In simple linear regression analysis, which of the following is NOT true?
A) The F test and the t test yield the same results.
B) The F test and the t test may or may not yield the same results.
C) The relationship between x and y is represented by means of a straight line.
D) The value of F = t2.
A) The F test and the t test yield the same results.
B) The F test and the t test may or may not yield the same results.
C) The relationship between x and y is represented by means of a straight line.
D) The value of F = t2.
Unlock Deck
Unlock for access to all 64 flashcards in this deck.
Unlock Deck
k this deck
51
If two variables, x and y, have a strong linear relationship, then _____.
A) there may or may not be any causal relationship between x and y
B) x causes y to happen
C) y causes x to happen
D) None of the answers is correct.
A) there may or may not be any causal relationship between x and y
B) x causes y to happen
C) y causes x to happen
D) None of the answers is correct.
Unlock Deck
Unlock for access to all 64 flashcards in this deck.
Unlock Deck
k this deck
52
A company has recorded data on the weekly sales for its product (y) and the unit price of the competitor's product (x). The data resulting from a random sample of seven weeks follows. Use Excel to develop a scatter diagram and to compute the least squares estimated regression equation and the coefficient of determination.
Unlock Deck
Unlock for access to all 64 flashcards in this deck.
Unlock Deck
k this deck
53
A company has recorded data on the weekly sales for its product (y) and the unit price of the competitor's product (x). The data resulting from a random sample of seven weeks follows. Use Excel's Regression tool to construct a residual plot and use it to determine if any model assumptions have been violated.
Unlock Deck
Unlock for access to all 64 flashcards in this deck.
Unlock Deck
k this deck
54
If the coefficient of correlation is a positive value, then the slope of the regression line _____.
A) must also be positive
B) can be either negative or positive
C) can be 0
D) None of the answers is correct.
A) must also be positive
B) can be either negative or positive
C) can be 0
D) None of the answers is correct.
Unlock Deck
Unlock for access to all 64 flashcards in this deck.
Unlock Deck
k this deck
55
Given below are seven observations collected in a regression study on two variables, x (independent variable) and y (dependent variable). Use Excel's Regression tool to construct a residual plot and use it to determine if any model assumptions have been violated.
Unlock Deck
Unlock for access to all 64 flashcards in this deck.
Unlock Deck
k this deck
56
The primary tool or measure for determining whether the assumed regression model is appropriate is _____.
A) the F test
B) residual analysis
C) the r2 value
D) the correlation coefficient
A) the F test
B) residual analysis
C) the r2 value
D) the correlation coefficient
Unlock Deck
Unlock for access to all 64 flashcards in this deck.
Unlock Deck
k this deck
57
Given below are seven observations collected in a regression study on two variables, x (independent variable) and y (dependent variable). Use Excel to develop a scatter diagram and to compute the least squares estimated regression equation and the coefficient of determination.
Unlock Deck
Unlock for access to all 64 flashcards in this deck.
Unlock Deck
k this deck
58
Given below are seven observations collected in a regression study on two variables, x (independent variable) and y (dependent variable). Use Excel to
Unlock Deck
Unlock for access to all 64 flashcards in this deck.
Unlock Deck
k this deck
59
A company has recorded data on the weekly sales for its product (y) and the unit price of the competitor's product (x). The data resulting from a random sample of seven weeks follows. Use Excel to
Unlock Deck
Unlock for access to all 64 flashcards in this deck.
Unlock Deck
k this deck
60
If the coefficient of correlation is a negative value, then the coefficient of determination _____.
A) must also be negative
B) must be 0
C) can be either negative or positive
D) must be positive
A) must also be negative
B) must be 0
C) can be either negative or positive
D) must be positive
Unlock Deck
Unlock for access to all 64 flashcards in this deck.
Unlock Deck
k this deck
61
Part of an Excel output relating x (independent variable) and y (dependent variable) is shown below. Fill in all the blanks marked with a question mark.
Unlock Deck
Unlock for access to all 64 flashcards in this deck.
Unlock Deck
k this deck
62
Given below are seven observations collected in a regression study on two variables, x (independent variable) and y (dependent variable). Use Excel's Regression tool to construct a residual plot and use it to determine if any model assumptions have been violated.
Unlock Deck
Unlock for access to all 64 flashcards in this deck.
Unlock Deck
k this deck
63
Coyote Cable has been experiencing an increase in cable service subscribers in recent months due to increased advertising and an influx of new residents to the region. The number of subscribers (in 1000s) for the last 16 months is as follows:
Using simple linear regression, forecast the number of subscribers for months 17, 18, 19, and 20.
Using simple linear regression, forecast the number of subscribers for months 17, 18, 19, and 20.
Unlock Deck
Unlock for access to all 64 flashcards in this deck.
Unlock Deck
k this deck
64
Part of an Excel output relating x (independent variable) and y (dependent variable) is shown below. Fill in all the blanks marked with a question mark.
Unlock Deck
Unlock for access to all 64 flashcards in this deck.
Unlock Deck
k this deck
Unlock Deck
Unlock for access to all 64 flashcards in this deck.


