Deck 12: Tests of Goodness of Fit, Independence, and Multiple Proportions
Full screen (f)
Question
Question
Before the presidential debates, it was expected that the percentages of registered voters in favor of various candidates would be as follows:  After the presidential debates, a random sample of 1200 voters showed that 540 favored the Democrat candidate; 480 were in favor of the Republican candidate; 40 were in favor of the Independent candidate, and 140 were undecided. At a 5% level of significance, carry out a test to determine if the proportion of voters has changed.
After the presidential debates, a random sample of 1200 voters showed that 540 favored the Democrat candidate; 480 were in favor of the Republican candidate; 40 were in favor of the Independent candidate, and 140 were undecided. At a 5% level of significance, carry out a test to determine if the proportion of voters has changed. Question
Question
Question
Question
Question
Question
Question
Question
A medical journal reported the following frequencies of deaths due to cardiac arrest for each day of the week: 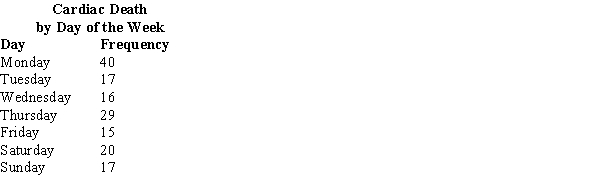 At a 5% level of significance, determine whether the number of deaths is uniform over the week.
At a 5% level of significance, determine whether the number of deaths is uniform over the week.
Question
Question
Question
Question
Question
Question
Question
Question
Last school year, in the school of Business Administration, 30% were Accounting majors, 24% Management majors, 26% Marketing majors, and 20% Economics majors. A random sample of 300 students taken this year showed the following number of students in each major:  Has there been a significant change in the number of students in each major between the last school year and this school year? Use α = .05.
Has there been a significant change in the number of students in each major between the last school year and this school year? Use α = .05. Question
Question
Question
A random sample of 2,000 individuals from three different cities was asked whether they owned a foreign or a domestic car. The following contingency table shows the results of the survey.
 At α = .05, test to determine if the type of car purchased is independent of the city in which the purchasers live.
At α = .05, test to determine if the type of car purchased is independent of the city in which the purchasers live. Question
A random sample of 1,000 managers with degrees in Business Administration classified each person according to their field of concentration and management level as shown below.
 Test at α = .01 to determine if the position in management is independent of the major of concentration.
Test at α = .01 to determine if the position in management is independent of the major of concentration. Question
From a poll of a random sample of 800 television viewers, the following data have been collected. The table below classifies each individual by their level of education and preference of television station.  Test at α = .05 to determine if the selection of a TV station is dependent upon the level of education.
Test at α = .05 to determine if the selection of a TV station is dependent upon the level of education. Question
Members of a focus group stated their preferences between three possible slogans. The results follow. Use Excel to test at α = .05 to determine any difference in preference among the three slogans. 
Question
A random sample of 150 individuals (males and females) was surveyed, and the individuals were asked to indicate their yearly incomes. The results of the survey are shown below.  Test at α = .05 to determine if the yearly income is independent of the gender.
Test at α = .05 to determine if the yearly income is independent of the gender. Question
Shown below is a 2 × 3 contingency table with observed values from a random sample of size 500. At 95% confidence, test for independence of the row and column factors. 
Question
Question
Dr. Ross's diet pills are supposed to cause significant weight loss. The following table shows the results of a recent study where a random sample of individuals took part in a placebo controlled study.

With 95% confidence, determine if weight loss is dependent upon taking the diet pills.
With 95% confidence, determine if weight loss is dependent upon taking the diet pills.
Question
In the last presidential election before the candidates began their major campaigns, the percentages of registered voters who favored the various candidates were as follows:  After the major campaigns began, a random sample of 400 voters showed that 172 favored the Republican candidate, 164 were in favor of the Democrat candidate, and 64 favored the Independent candidate. Use α = .01 to determine if the proportion of voters who favored the various candidates changed.
After the major campaigns began, a random sample of 400 voters showed that 172 favored the Republican candidate, 164 were in favor of the Democrat candidate, and 64 favored the Independent candidate. Use α = .01 to determine if the proportion of voters who favored the various candidates changed. Question
Shown below is a 3 × 2 contingency table with observed values from a sample of 1,500. At 95% confidence, test for independence of the row and column factors. 
Question
City planners are evaluating three proposed alternatives for relieving the growing traffic congestion on a north-south highway in a booming city. The proposed alternatives are: (1) designate high-occupancy vehicle (HOV) lanes on the existing highway, (2) construct a new, parallel highway, and (3) construct a light (passenger) rail system.
In an analysis of the three proposals, a citizen group has raised the question of whether preferences for the three alternatives differ among residents near the highway and nonresidents. A test of independence will address this question, with the hypotheses being:
H0: Proposal preference is independent of the residency status of the individual
Ha: Proposal preference is not independent of the residency status of the individual
A simple random sample of 500 individuals has been selected. A crosstabulation of the residency statuses and proposal preferences of the individuals sampled is shown below.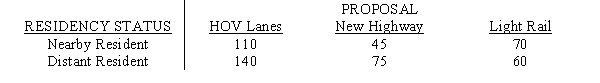 Conduct a test of independence using α = .05 to address the question of whether residency status is independent of the proposal preference.
In an analysis of the three proposals, a citizen group has raised the question of whether preferences for the three alternatives differ among residents near the highway and nonresidents. A test of independence will address this question, with the hypotheses being:
H0: Proposal preference is independent of the residency status of the individual
Ha: Proposal preference is not independent of the residency status of the individual
A simple random sample of 500 individuals has been selected. A crosstabulation of the residency statuses and proposal preferences of the individuals sampled is shown below.
Conduct a test of independence using α = .05 to address the question of whether residency status is independent of the proposal preference. Question
Question
During "sweeps week" last year, the viewing audience was distributed as follows: 36% NBC, 22% ABC, 24% CBS, and 18% FOX. This year during sweeps week, a random sample of 50 homes yielded the following data. Use Excel to test at α = .05 to determine if the audience proportions have changed. 
Question
A major automobile manufacturer claimed that the frequencies of repairs on all five models of its cars are the same. A random sample of 200 repair services showed the following frequencies on the various makes of cars:  At α = .05, test the manufacturer's claim.
At α = .05, test the manufacturer's claim. Question
A study of wage discrimination at a local store compared employees' race and status. Partial results of the study follow. Use Excel and test at α = .05 to determine if race is independent of status. 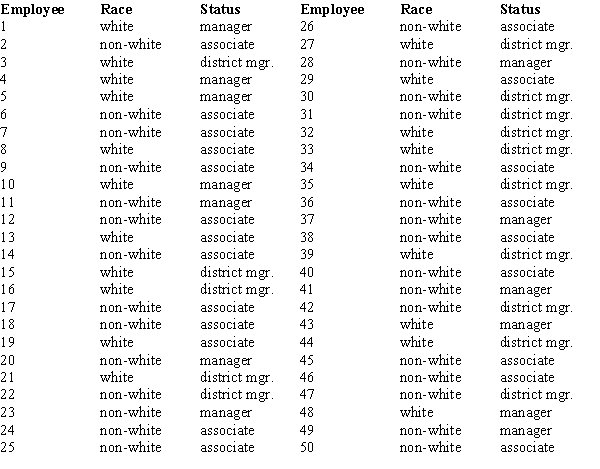
Question
Question
A random sample of 500 individuals was asked to cast their votes regarding a particular issue of the Equal Rights Amendment. The following contingency table shows the results of the votes:
 Test at α = .05 to determine if voting preference is independent of the gender of the individuals.
Test at α = .05 to determine if voting preference is independent of the gender of the individuals.
Unlock Deck
Sign up to unlock the cards in this deck!
Unlock Deck
Unlock Deck
1/37
Play
Full screen (f)
Deck 12: Tests of Goodness of Fit, Independence, and Multiple Proportions
1
In order NOT to violate the requirements necessary to use the chi-square distribution, each expected frequency in a goodness of fit test must be _____.
A) at least 5
B) at least 10
C) no more than 5
D) less than 2
A) at least 5
B) at least 10
C) no more than 5
D) less than 2
at least 5
2
Before the presidential debates, it was expected that the percentages of registered voters in favor of various candidates would be as follows: After the presidential debates, a random sample of 1200 voters showed that 540 favored the Democrat candidate; 480 were in favor of the Republican candidate; 40 were in favor of the Independent candidate, and 140 were undecided. At a 5% level of significance, carry out a test to determine if the proportion of voters has changed.
After the presidential debates, a random sample of 1200 voters showed that 540 favored the Democrat candidate; 480 were in favor of the Republican candidate; 40 were in favor of the Independent candidate, and 140 were undecided. At a 5% level of significance, carry out a test to determine if the proportion of voters has changed.Since 8.18 > 7.81, reject H0. Therefore, there has been a change.
3
The sampling distribution for a goodness of fit test is the _____.
A) Poisson distribution
B) t distribution
C) normal distribution
D) chi-square distribution
A) Poisson distribution
B) t distribution
C) normal distribution
D) chi-square distribution
chi-square distribution
4
The properties of a multinomial experiment include all of the following EXCEPT _____.
A) the experiment consists of a sequence of n identical trials
B) three or more outcomes are possible on each trial
C) the probability of each outcome can change from trial to trial
D) the trials are independent
A) the experiment consists of a sequence of n identical trials
B) three or more outcomes are possible on each trial
C) the probability of each outcome can change from trial to trial
D) the trials are independent
Unlock Deck
Unlock for access to all 37 flashcards in this deck.
Unlock Deck
k this deck
5
Excel's ____ function is used to perform a goodness of fit test.
A) ZTEST
B) TTEST
C) CHISQ.DIST.RT
D) NORM.S.DIST
A) ZTEST
B) TTEST
C) CHISQ.DIST.RT
D) NORM.S.DIST
Unlock Deck
Unlock for access to all 37 flashcards in this deck.
Unlock Deck
k this deck
6
The test for goodness of fit, test of independence, and test of multiple proportions are designed for use with _____.
A) categorical data
B) bivariate data
C) quantitative data
D) ordinal data
A) categorical data
B) bivariate data
C) quantitative data
D) ordinal data
Unlock Deck
Unlock for access to all 37 flashcards in this deck.
Unlock Deck
k this deck
7
A statistical test conducted to determine whether to reject or not reject a hypothesized probability distribution for a population is known as a _____.
A) contingency test
B) probability test
C) goodness of fit test
D) None of the answers is correct.
A) contingency test
B) probability test
C) goodness of fit test
D) None of the answers is correct.
Unlock Deck
Unlock for access to all 37 flashcards in this deck.
Unlock Deck
k this deck
8
A goodness of fit test is always conducted as a(n) _____.
A) lower-tail test
B) upper-tail test
C) middle test
D) None of the answers is correct.
A) lower-tail test
B) upper-tail test
C) middle test
D) None of the answers is correct.
Unlock Deck
Unlock for access to all 37 flashcards in this deck.
Unlock Deck
k this deck
9
An important application of the chi-square distribution is _____.
A) testing for equality of three or more population proportions
B) testing for goodness of fit
C) testing for the independence of two variables
D) All of the answers are correct.
A) testing for equality of three or more population proportions
B) testing for goodness of fit
C) testing for the independence of two variables
D) All of the answers are correct.
Unlock Deck
Unlock for access to all 37 flashcards in this deck.
Unlock Deck
k this deck
10
A medical journal reported the following frequencies of deaths due to cardiac arrest for each day of the week: At a 5% level of significance, determine whether the number of deaths is uniform over the week.
At a 5% level of significance, determine whether the number of deaths is uniform over the week.
Unlock Deck
Unlock for access to all 37 flashcards in this deck.
Unlock Deck
k this deck
11
In a goodness of fit test, Excel's CHISQ.DIST.RT function returns a _____.
A) chi-square critical value
B) chi-square test statistic
C) p-value
D) confidence interval estimate
A) chi-square critical value
B) chi-square test statistic
C) p-value
D) confidence interval estimate
Unlock Deck
Unlock for access to all 37 flashcards in this deck.
Unlock Deck
k this deck
12
The number of categories of outcomes per trial for a multinomial probability distribution is _____.
A) two or more
B) three or more
C) four or more
D) five or more
A) two or more
B) three or more
C) four or more
D) five or more
Unlock Deck
Unlock for access to all 37 flashcards in this deck.
Unlock Deck
k this deck
13
The degrees of freedom for a contingency table with 10 rows and 11 columns is _____.
A) 100
B) 110
C) 21
D) 90
A) 100
B) 110
C) 21
D) 90
Unlock Deck
Unlock for access to all 37 flashcards in this deck.
Unlock Deck
k this deck
14
The degrees of freedom for a contingency table with 6 rows and 3 columns is _____.
A) 18
B) 15
C) 6
D) 10
A) 18
B) 15
C) 6
D) 10
Unlock Deck
Unlock for access to all 37 flashcards in this deck.
Unlock Deck
k this deck
15
Excel's CHISQ.DIST function can be used to perform _____.
A) a test for equality of population means
B) a test for equality of population proportions
C) a goodness of fit test
D) All of the answers are correct.
A) a test for equality of population means
B) a test for equality of population proportions
C) a goodness of fit test
D) All of the answers are correct.
Unlock Deck
Unlock for access to all 37 flashcards in this deck.
Unlock Deck
k this deck
16
A population where each element of the population is assigned to one and only one of several classes or categories is a _____.
A) multinomial population
B) Poisson population
C) normal population
D) None of the answers is correct.
A) multinomial population
B) Poisson population
C) normal population
D) None of the answers is correct.
Unlock Deck
Unlock for access to all 37 flashcards in this deck.
Unlock Deck
k this deck
17
The number of degrees of freedom for the appropriate chi-square distribution in a test of independence is _____.
A) n - 1
B) k - 1
C) number of rows minus 1 times number of columns minus 1
D) dependent upon the statement of the null hypothesis
A) n - 1
B) k - 1
C) number of rows minus 1 times number of columns minus 1
D) dependent upon the statement of the null hypothesis
Unlock Deck
Unlock for access to all 37 flashcards in this deck.
Unlock Deck
k this deck
18
Last school year, in the school of Business Administration, 30% were Accounting majors, 24% Management majors, 26% Marketing majors, and 20% Economics majors. A random sample of 300 students taken this year showed the following number of students in each major: Has there been a significant change in the number of students in each major between the last school year and this school year? Use α = .05.
Has there been a significant change in the number of students in each major between the last school year and this school year? Use α = .05. Unlock Deck
Unlock for access to all 37 flashcards in this deck.
Unlock Deck
k this deck
19
The degrees of freedom for a contingency table with 12 rows and 12 columns is _____.
A) 144
B) 121
C) 12
D) 120
A) 144
B) 121
C) 12
D) 120
Unlock Deck
Unlock for access to all 37 flashcards in this deck.
Unlock Deck
k this deck
20
Excel's ____ function is used to perform a test of independence.
A) ZTEST
B) TTEST
C) CHISQ.DIST.RT
D) NORM.S.DIST
A) ZTEST
B) TTEST
C) CHISQ.DIST.RT
D) NORM.S.DIST
Unlock Deck
Unlock for access to all 37 flashcards in this deck.
Unlock Deck
k this deck
21
A random sample of 2,000 individuals from three different cities was asked whether they owned a foreign or a domestic car. The following contingency table shows the results of the survey.
At α = .05, test to determine if the type of car purchased is independent of the city in which the purchasers live.
At α = .05, test to determine if the type of car purchased is independent of the city in which the purchasers live. Unlock Deck
Unlock for access to all 37 flashcards in this deck.
Unlock Deck
k this deck
22
A random sample of 1,000 managers with degrees in Business Administration classified each person according to their field of concentration and management level as shown below.
Test at α = .01 to determine if the position in management is independent of the major of concentration.
Test at α = .01 to determine if the position in management is independent of the major of concentration. Unlock Deck
Unlock for access to all 37 flashcards in this deck.
Unlock Deck
k this deck
23
From a poll of a random sample of 800 television viewers, the following data have been collected. The table below classifies each individual by their level of education and preference of television station. Test at α = .05 to determine if the selection of a TV station is dependent upon the level of education.
Test at α = .05 to determine if the selection of a TV station is dependent upon the level of education. Unlock Deck
Unlock for access to all 37 flashcards in this deck.
Unlock Deck
k this deck
24
Members of a focus group stated their preferences between three possible slogans. The results follow. Use Excel to test at α = .05 to determine any difference in preference among the three slogans.
Unlock Deck
Unlock for access to all 37 flashcards in this deck.
Unlock Deck
k this deck
25
A random sample of 150 individuals (males and females) was surveyed, and the individuals were asked to indicate their yearly incomes. The results of the survey are shown below. Test at α = .05 to determine if the yearly income is independent of the gender.
Test at α = .05 to determine if the yearly income is independent of the gender. Unlock Deck
Unlock for access to all 37 flashcards in this deck.
Unlock Deck
k this deck
26
Shown below is a 2 × 3 contingency table with observed values from a random sample of size 500. At 95% confidence, test for independence of the row and column factors.
Unlock Deck
Unlock for access to all 37 flashcards in this deck.
Unlock Deck
k this deck
27
In 1996, forty percent of the students at a major university were Business majors, 35% were Engineering majors and the rest of the students were majoring in other fields. In a random sample of 600 students from the same university taken in 1997, 200 were Business majors, 220 were Engineering majors, and the remaining students in the sample were majoring in other fields. At a 5% significance level, test to see if there has been a significant change in the proportions between 1996 and 1997.
Unlock Deck
Unlock for access to all 37 flashcards in this deck.
Unlock Deck
k this deck
28
Dr. Ross's diet pills are supposed to cause significant weight loss. The following table shows the results of a recent study where a random sample of individuals took part in a placebo controlled study.
With 95% confidence, determine if weight loss is dependent upon taking the diet pills.
With 95% confidence, determine if weight loss is dependent upon taking the diet pills.
Unlock Deck
Unlock for access to all 37 flashcards in this deck.
Unlock Deck
k this deck
29
In the last presidential election before the candidates began their major campaigns, the percentages of registered voters who favored the various candidates were as follows: After the major campaigns began, a random sample of 400 voters showed that 172 favored the Republican candidate, 164 were in favor of the Democrat candidate, and 64 favored the Independent candidate. Use α = .01 to determine if the proportion of voters who favored the various candidates changed.
After the major campaigns began, a random sample of 400 voters showed that 172 favored the Republican candidate, 164 were in favor of the Democrat candidate, and 64 favored the Independent candidate. Use α = .01 to determine if the proportion of voters who favored the various candidates changed. Unlock Deck
Unlock for access to all 37 flashcards in this deck.
Unlock Deck
k this deck
30
Shown below is a 3 × 2 contingency table with observed values from a sample of 1,500. At 95% confidence, test for independence of the row and column factors.
Unlock Deck
Unlock for access to all 37 flashcards in this deck.
Unlock Deck
k this deck
31
City planners are evaluating three proposed alternatives for relieving the growing traffic congestion on a north-south highway in a booming city. The proposed alternatives are: (1) designate high-occupancy vehicle (HOV) lanes on the existing highway, (2) construct a new, parallel highway, and (3) construct a light (passenger) rail system.
In an analysis of the three proposals, a citizen group has raised the question of whether preferences for the three alternatives differ among residents near the highway and nonresidents. A test of independence will address this question, with the hypotheses being:
H0: Proposal preference is independent of the residency status of the individual
Ha: Proposal preference is not independent of the residency status of the individual
A simple random sample of 500 individuals has been selected. A crosstabulation of the residency statuses and proposal preferences of the individuals sampled is shown below. Conduct a test of independence using α = .05 to address the question of whether residency status is independent of the proposal preference.
In an analysis of the three proposals, a citizen group has raised the question of whether preferences for the three alternatives differ among residents near the highway and nonresidents. A test of independence will address this question, with the hypotheses being:
H0: Proposal preference is independent of the residency status of the individual
Ha: Proposal preference is not independent of the residency status of the individual
A simple random sample of 500 individuals has been selected. A crosstabulation of the residency statuses and proposal preferences of the individuals sampled is shown below.
Conduct a test of independence using α = .05 to address the question of whether residency status is independent of the proposal preference. Unlock Deck
Unlock for access to all 37 flashcards in this deck.
Unlock Deck
k this deck
32
Before the rush began for Christmas shopping, a department store noted that the percentage of its customers who use the store's credit card, the percentage of those who use a major credit card, and the percentage of those who pay cash are the same. During the Christmas rush, a random sample of 150 shoppers was selected. Of those, 46 used the store's credit card, 43 used a major credit card, and 61 paid cash. Use α = .05 to determine if the methods of payment have changed during the Christmas rush.
Unlock Deck
Unlock for access to all 37 flashcards in this deck.
Unlock Deck
k this deck
33
During "sweeps week" last year, the viewing audience was distributed as follows: 36% NBC, 22% ABC, 24% CBS, and 18% FOX. This year during sweeps week, a random sample of 50 homes yielded the following data. Use Excel to test at α = .05 to determine if the audience proportions have changed.
Unlock Deck
Unlock for access to all 37 flashcards in this deck.
Unlock Deck
k this deck
34
A major automobile manufacturer claimed that the frequencies of repairs on all five models of its cars are the same. A random sample of 200 repair services showed the following frequencies on the various makes of cars: At α = .05, test the manufacturer's claim.
At α = .05, test the manufacturer's claim. Unlock Deck
Unlock for access to all 37 flashcards in this deck.
Unlock Deck
k this deck
35
A study of wage discrimination at a local store compared employees' race and status. Partial results of the study follow. Use Excel and test at α = .05 to determine if race is independent of status.
Unlock Deck
Unlock for access to all 37 flashcards in this deck.
Unlock Deck
k this deck
36
Employee panel preferences for three proposed company logo designs follow.
? ?
Use = .05 and test to determine any difference in preference among the three logo designs.
? ?
Use = .05 and test to determine any difference in preference among the three logo designs.
Unlock Deck
Unlock for access to all 37 flashcards in this deck.
Unlock Deck
k this deck
37
A random sample of 500 individuals was asked to cast their votes regarding a particular issue of the Equal Rights Amendment. The following contingency table shows the results of the votes:
Test at α = .05 to determine if voting preference is independent of the gender of the individuals.
Test at α = .05 to determine if voting preference is independent of the gender of the individuals. Unlock Deck
Unlock for access to all 37 flashcards in this deck.
Unlock Deck
k this deck
Unlock Deck
Unlock for access to all 37 flashcards in this deck.


