Deck 16: Quality Control Methods
Full screen (f)
Question
The 3-sigma lower control limit (LCL) for an S chart is given by LCL =  where the values of
  for n=3, ….., 8 are tabulated in your text. This expression for LCL will be negative if
  __________, in which case it is customary to use LCL = __________.
where the values of for n=3, ….., 8 are tabulated in your text. This expression for LCL will be negative if __________, in which case it is customary to use LCL = __________. Question
The two control limit for 3 sigma  chart have been calculated. If the variable of interest is normally distributed, and 3 is replaced by 3.09 in the control limits formulas, then probability of Type I error
  __________, but for any fixed n and
  , probability of Type II error
  will __________.
chart have been calculated. If the variable of interest is normally distributed, and 3 is replaced by 3.09 in the control limits formulas, then probability of Type I error __________, but for any fixed n and , probability of Type II error will __________. Question
An  control chart is based on control limits
  When the process is in control, then the probability that a point falls outside the limits is __________.
control chart is based on control limits When the process is in control, then the probability that a point falls outside the limits is __________. Question
Question
An  control chart is based on control limits
  When the process is in control, then the average run length (ARL) is __________.
control chart is based on control limits When the process is in control, then the average run length (ARL) is __________. Question
Question
For a sample of size 5, the tabulated value of  If the population standard deviation
  then the standard deviation of the sample standard deviation S is
  __________, rounded to 3 decimal places.
If the population standard deviation then the standard deviation of the sample standard deviation S is __________, rounded to 3 decimal places. Question
Question
Question
Question
Question
An  control chart is constructed using 25 samples of size 3 each, when the process is in-control and the random variable of interest is normally distributed with a mean of 20 and standard deviation of 1.732. Then, the 3 standard deviation control limits are LCL = __________ and UCL =__________.
control chart is constructed using 25 samples of size 3 each, when the process is in-control and the random variable of interest is normally distributed with a mean of 20 and standard deviation of 1.732. Then, the 3 standard deviation control limits are LCL = __________ and UCL =__________. Question
Question
Question
The 3-sigma lower control limit (LCL) for an R chart is given by LCL =  where the values of
  for n=3,…..,8 are tabulated in your text. This expression for LCL will be negative if
  __________, in which case it is customary to use LCL = __________.
where the values of for n=3,…..,8 are tabulated in your text. This expression for LCL will be negative if __________, in which case it is customary to use LCL = __________. Question
The two control limits for 3=sigma  chart have been calculated. If the variable of interest is normally distributed, and 3 is replaced by 2.5 in the control limits formulas, then probability of Type I error
  __________, but for fixed n and
  , probability of Type II error
  will __________.
chart have been calculated. If the variable of interest is normally distributed, and 3 is replaced by 2.5 in the control limits formulas, then probability of Type I error __________, but for fixed n and , probability of Type II error will __________. Question
The sample variance  is an unbiased estimator of the population variance
  that is, __________ = __________.
is an unbiased estimator of the population variance that is, __________ = __________. Question
Any point outside the lower control limit (LCL) and/or the upper control limit (UCL) of a 3-sigma  chart suggests that the process may have been __________ at that time, so a search for __________ should be initiated.
chart suggests that the process may have been __________ at that time, so a search for __________ should be initiated. Question
Question
Question
If Y is a Poisson random variable with parameter  then E(Y) = __________, V(Y) = __________, and also has approximately a __________ distribution when
  is large
then E(Y) = __________, V(Y) = __________, and also has approximately a __________ distribution when is large Question
Question
Question
Question
Question
Question
Let p denote the proportion of defective items in the lot, and P(A) denote the probability that the lot is accepted. Let us designate two different values of p, one for which P(A) is a specified value close to 1 and the other for which P(A) is a specified value near 0. These tow values of  are often called the __________, denoted AQL, and the __________, denoted by LTPD.
are often called the __________, denoted AQL, and the __________, denoted by LTPD. Question
Question
If the size of a shift in a process mean  is .40, then the customarily value of the slope of the lower arm of the V-mask is __________.
is .40, then the customarily value of the slope of the lower arm of the V-mask is __________. Question
Which of the following statements are not true?
A) Raising quality levels can lead to decreased costs, a greater degree of consumer satisfaction, and thus increased profitability.
B) Control Charting is now used extensively in industry as a diagnostic technique for monitoring production processes to identify instability and unusual circumstances.
C) The basis for most of control charts lies in our work concerning probability distributions of various statistics such as the sample mean
And sample proportion
D) All of the above statements are true.
E) None of the above statements are true.
Question
Question
At time r, a process is judged out of control if any of the cumulative sum plotted values  lies outside the __________; either above the upper arm or below the lower arm.
lies outside the __________; either above the upper arm or below the lower arm. Question
The 3-sigma control limits of the p chart for the fraction of defective items in a process believed to be in control are LCL = .0125 and UCL = .1425. If the smallest and largest values of  the fraction of defective items, are .0062 and .1685 respectively, then the process is __________.
the fraction of defective items, are .0062 and .1685 respectively, then the process is __________. Question
Question
Question
Question
Question
Suppose that 25 samples, each of size 100, were selected from what is believed to be an in-control process, and that  where
where  is the fraction of defective items in sample i. The p chart for the fraction of defective items has its center line at height equals to __________.
where is the fraction of defective items in sample i. The p chart for the fraction of defective items has its center line at height equals to __________. Question
If  are independent Poisson variables with common parameter
  then
then  has also a Poisson distribution with parameter
  = __________, where
  denotes the expected number of defects per unit.
are independent Poisson variables with common parameter then has also a Poisson distribution with parameter = __________, where denotes the expected number of defects per unit. Question
Question
Assume that for an in-control process, the random variable of interest X has a normal distribution with mean value  and standard deviation
  . If
. If  denotes the sample mean for a random sample of size n selected at a particular time, then
A)
B)
C)
Has a normal distribution.
D) All of the above are true.
E) None of the above are true.
and standard deviation . If denotes the sample mean for a random sample of size n selected at a particular time, thenA)
B)
C)
Has a normal distribution.
D) All of the above are true.
E) None of the above are true.
Question
The inability of  charts with 3-sigma limits to quickly detect small shifts in the process mean has prompted investigators to develop procedures that provide improved behavior in this respect. Which of the following conditions need to be satisfied for an appropriated intervention to take corrective action?
A) Two out of three successive points fall outside 2-sigma limits on the same side of the center line.
B) Four out of five successive points fall outside 1-sigma limits on the same side of the center line.
C) Eight successive points fall on the same side of the center line.
D) All of the above.
E) None of the above.
charts with 3-sigma limits to quickly detect small shifts in the process mean has prompted investigators to develop procedures that provide improved behavior in this respect. Which of the following conditions need to be satisfied for an appropriated intervention to take corrective action?A) Two out of three successive points fall outside 2-sigma limits on the same side of the center line.
B) Four out of five successive points fall outside 1-sigma limits on the same side of the center line.
C) Eight successive points fall on the same side of the center line.
D) All of the above.
E) None of the above.
Question
Question
Question
Which of the following statements are true?
A) The p control chart for the fraction of items not conforming to specifications is based on the binomial probability distribution.
B) The c control chart for the number of defectives is based on the Poisson probability distribution.
C) If the random variable X has a binomial distribution with parameters n and p, then when p is small the transformation
Is recommended and that the points
Should be used to construct the p chart.
D) If the random variable X has a Poisson distribution with parameter
And
Is small, then the transformation
Is recommended and that the points
Should be used to construct the c chart.
E) All of the above statements are correct
Question
Which of the following statements are true?
A) A defect on the traditional
Chart is its inability to detect a relatively small change in a process mean.
B) Whether a process is judged out of control at a particular time depends only on the sample at that time, and not on the past history of the process.
C) The computational version of a cumulative sum (CUSUM) procedure is used almost exclusively in practice, but the logic behind the procedure is most easily grasped by first considering the graphical form.
D) All of the above statements are true.
E) None of the above statements are true.
Question
Which of the following statements are true?
A) Generally speaking, a control chart will be effective if it gives very few out-of-control signals when the process is I control, but shows a point outside the control limits almost as soon as the process goes out of control.
B) One assessment of a control chart's effectiveness is based on the notion of "error probabilities"
C) The use of a 3-sigma limits for an
Chart makes it highly unlikely that an out-of-control signal will result from an in-control process.
D) One assessment of a control chart's effectiveness involves the average run length (ARL) needed to observe an out-of-control signal.
E) All of the above statements are true.
Question
Suppose there are 28 samples obtained at equally spaced time points, and n=7 observations in each sample. If the sum of the 28 sample ranges is 98, and that the tabulated values of  and
and  are 2.706 and .833, respectively, then the 3-sigma control limits LCL and UCL for an R control chart are respectively
A) 0.0 and 6.73
B) .27 and 6.73
C) -30.61 and 37.61
D) 0.0 and 37.61
E) None of the above answers are correct.
and are 2.706 and .833, respectively, then the 3-sigma control limits LCL and UCL for an R control chart are respectivelyA) 0.0 and 6.73
B) .27 and 6.73
C) -30.61 and 37.61
D) 0.0 and 37.61
E) None of the above answers are correct.
Question
Suppose there are 10 sample obtained at equally spaced time points, and n=4 observations in each sample. If the sum of the 20 sample standard deviations is 42, and that the tabulated value of  is .921, then the 3-sigma control limits LCL and UCL for an S control chart are respectively
A) 1.062 and 3.138
B) 3.138 and 4.765
C) 0.0 and 4.765
D) -.354 and 4.554
E) -.565 and 4.765
is .921, then the 3-sigma control limits LCL and UCL for an S control chart are respectivelyA) 1.062 and 3.138
B) 3.138 and 4.765
C) 0.0 and 4.765
D) -.354 and 4.554
E) -.565 and 4.765
Question
Which of the following statements are not true?
A) To construct an
Chart, there are two different commonly used methods for estimating the unknown process standard deviation
; one based on the k sample standard deviations and the other on the k sample ranges.
B) In the case of a normal population distribution, the estimator of the unknown process standard deviation
Based on sample standard deviations S is more efficient than that based on the sample range.
C) The sample standard deviation S is an unbiased estimator of the population standard deviation
; that is, E(S)=
)
D) All of the above statements are true.
E) None of the above statements are true.
Question
Which of the following statements are not correct?
A) For a 3-sigma
Chart, where the process mean
And standard deviation
Are known, the probability that a point on the chart falls above the UCL is .013, as is the probability that the point falls below the LCL.
B) For a 3-sigma S chart,
C) For a 3-sigma R chart,
D) Only B and C are not correct.
E) Only A and C are not correct.
Question
Which of the following statements are true?
A) It is important to ensure that a process is under control with respect to location (equivalently, central tendency) as well as variation.
B) Most practitioners recommend that control of a process be established on variation prior to constructing an
Chart or any other chart for controlling location.
C) Charts for variation are based on the sample standard deviation S and also based on the sample range R.
D) Charts for variation that are based on the sample standard deviation S are generally preferred over charts that are based on the sample range R because the standard deviation gives a more efficient assessment of variation than does the range.
E) All of the above statements are true.
Question
Which of the following statements are not true?
A) One important use of control charts is to see whether some measure of location of the variable's distribution remains stable over time.
B) It is highly unlikely that for an in-control process, the sample mean will fall within 3 standard deviations
Of the process mean
C) The use of control charts based on 3 standard deviation limits is traditional, but tradition is certainly not inviolable.
D) All of the above statements are true.
E) None of the above statements are true.
Question
Suppose that 25 samples, each of size 200, we selected from what is believed to be an in-control process, and that  is the fraction of defective items in sample i. The 3-sigma control limits, LCL and UCL, of the p chart for the fraction of defective items are respectively
A) .0236 and .244
B) -.0462 and .0942
C) 0 and .0564
D) 0 and .0942
E) -.0084 and .0564
is the fraction of defective items in sample i. The 3-sigma control limits, LCL and UCL, of the p chart for the fraction of defective items are respectivelyA) .0236 and .244
B) -.0462 and .0942
C) 0 and .0564
D) 0 and .0942
E) -.0084 and .0564
Question
Consider a sample of n items obtained at a particular time, and let X be the number of defectives and  Which of the following statements are not true?
A) E(X) = np
B) V(X) = p(1-p)
C)
D)
E) If
Has approximately a normal distribution.
Which of the following statements are not true?A) E(X) = np
B) V(X) = p(1-p)
C)
D)
E) If
Has approximately a normal distribution.
Question
Suppose that k independently selected samples are available, each one consisting of n observations on a normally distributed variable. Denote the sample standard deviations by  The values
  are plotted in sequence on an S chart. The center line of the chart will be at height equals to the
A) average of the values
)
B) range of the values
)
C) standard deviation of the values
)
D) first quartile of the values
)
E) third quartile of the values
)
The values are plotted in sequence on an S chart. The center line of the chart will be at height equals to theA) average of the values
)
B) range of the values
)
C) standard deviation of the values
)
D) first quartile of the values
)
E) third quartile of the values
)
Question
Question
Suppose that at each of the time points 1,2,3,….., a sample of size n is selected at random from a normal distribution with known mean  and standard deviation
  In order to construct a 3-sigma
  chart, we need to
A) determine
Calculated values of the corresponding sample means.
B) plot
Over time; that is, plot the points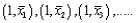
And so on.
C) Draw horizontal lines across the plot as
)
D) All of the above are needed.
E) Only A and B are needed.
and standard deviation In order to construct a 3-sigma chart, we need toA) determine
Calculated values of the corresponding sample means.
B) plot
Over time; that is, plot the points
And so on.
C) Draw horizontal lines across the plot as
)
D) All of the above are needed.
E) Only A and B are needed.
Question
Which of the following statements are not true?
A) A particular V-mask is determined by specifying the "lead distance" d and "half angle"
, or equivalently, by specifying d and the length h of the vertical line segment from 0 to the lower (or to the upper) arm of the mask.
B) One method for deciding which V-mask to use involves specifying the size of a shift in the process mean that is of particular concern to an investigator, then the parameters of the mask are chosen to give desired values of
The false-alarm probability and the probability of not detecting the specified shift, respectively.
C) One method for deciding which V-mask to use involves selecting the mask that yields specified values of the ARL (average run length) both for an in-control process and for a process in which the mean has shifted by a designated amount.
D) All of the above statements are true.
E) None of the above statements are true.
Question
Question
Which of the following statements are not true?
A) If we let
Denote the size of a shift in a process mean
That is to be quickly detected using a CUSUM procedure, then it is common practice to let
Where k denotes the slope of the lower arm of the V-mask.
B) A quality control practitioner may specify a desired value of an ARL (average run length) when the process is in control
C) A quality control practitioner may specify a desire value of an ARL (average run length) when the process is out of control because the mean has shifted by
D) All of the above statements are true.
E) None of the above statements are true.
Question
Question
A manufacturer of dustless chalk instituted a quality control program to monitor chalk density. The sample standard deviations of densities of n = 8 chalk specimens, were as follow: 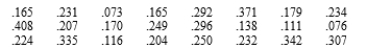 Calculate limits for an S chart, and check for out-of-control points. If there is an out-of-control point, delete it and repeat the process.
Calculate limits for an S chart, and check for out-of-control points. If there is an out-of-control point, delete it and repeat the process. Question
A sample of ROM computer chips was selected on each of 30 consecutive days, and the number of nonconforming chips on each day was as follows: 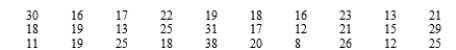 Determine control limits for a 3-sigma p chart and specify any out-of-control points.
Determine control limits for a 3-sigma p chart and specify any out-of-control points. Question
Consider a double-sampling plan with  Which of the following equalities are not correct if the lot will be accepted?
A)
B)
C)
D)
E) None of the above are correct
Which of the following equalities are not correct if the lot will be accepted?A)
B)
C)
D)
E) None of the above are correct
Question
Let the random variable X denote the number of defective items in the lot, A denote the event that the lot is accepted, and p denote the proportion of defective items in the lot. Which of the following statements is not true?
A) If the sample size n is large relative to the lot size N, then the probability of accepting the lot, P(A), is calculated using the hypergeometric distribution.
B) When the sample size n is small relative to the lot size N (the rule of thumb suggested in your text was
), then the probability of accepting the , P(A), is calculated using the binomial distribution.
C) If the probability of accepting the lot, P(A), is large only when p is small (this, of course, depends on the specified critical value c), then the Poisson approximation to the binomial distribution is justified.
D) The larger value of p, the larger the probability P(A) of accepting the lot.
E) All of the above statements are true.
Question
Question
In the case of known  what control limits are necessary for the probability of a single point being outside the limits for an in-control process to be .003?
what control limits are necessary for the probability of a single point being outside the limits for an in-control process to be .003? Question
For what  values will the LCL in a 3-sigma c chart be negative?
values will the LCL in a 3-sigma c chart be negative? Question
Question
The accompanying table gives sample means and standard deviations, each based on n = 6 observations of the refractive index of fiber-optic cable. Calculate the control limits for an ![The accompanying table gives sample means and standard deviations, each based on n = 6 observations of the refractive index of fiber-optic cable. Calculate the control limits for an chart based on the sample standard deviations given, and comment on the behavior of the chart. [Hint: ] <div style=padding-top: 35px>](https://storage.examlex.com/TB3498/11eb0e05_3e54_0160_9431_a9b050daf839_TB3498_00.jpg) chart based on the sample standard deviations given, and comment on the behavior of the chart. [Hint:
chart based on the sample standard deviations given, and comment on the behavior of the chart. [Hint: ![The accompanying table gives sample means and standard deviations, each based on n = 6 observations of the refractive index of fiber-optic cable. Calculate the control limits for an chart based on the sample standard deviations given, and comment on the behavior of the chart. [Hint: ] <div style=padding-top: 35px>](https://storage.examlex.com/TB3498/11eb0e05_3e54_0161_9431_ed42fb082576_TB3498_00.jpg) ]
] ![The accompanying table gives sample means and standard deviations, each based on n = 6 observations of the refractive index of fiber-optic cable. Calculate the control limits for an chart based on the sample standard deviations given, and comment on the behavior of the chart. [Hint: ] <div style=padding-top: 35px>](https://storage.examlex.com/TB3498/11eb0e05_3e54_0162_9431_214ba5331359_TB3498_00.jpg)
chart based on the sample standard deviations given, and comment on the behavior of the chart. [Hint: ] Question
Question
A control chart for thickness of rolled-steel sheets is based on an upper control limit of .0525 inch and a lower limit of .0475 inch. The first ten values of the quality statistic (in this case  the sample mean thickness of n =5 sample sheets) are .0508, .0495, .0504, .0503, .0514, .0500, .0487, .0502, .0507, and .0485. Comment on the behavior of this control chart.
the sample mean thickness of n =5 sample sheets) are .0508, .0495, .0504, .0503, .0514, .0500, .0487, .0502, .0507, and .0485. Comment on the behavior of this control chart. Question
When n = 180, what is the smallest value of  for which the LCL in a 3-sigma p chart is positive?
for which the LCL in a 3-sigma p chart is positive? Question
Consider a 3-sigma control chart with center line at  and based on n = 5. Assuming normality, calculate the probability that a single point will fall outside the control limits when the actual process mean is
a.
b.
c.
and based on n = 5. Assuming normality, calculate the probability that a single point will fall outside the control limits when the actual process mean is a.
b.
c.
Question
Question
Consider the control chart based on control limits 
a. What is the ARL when the process is in control?
b. What is the ARL when n = 4 and the process mean has shifted to
?
c. How do the values of parts (a) and (b) compare to the corresponding values for a 3-sigma chart?
a. What is the ARL when the process is in control?
b. What is the ARL when n = 4 and the process mean has shifted to
?
c. How do the values of parts (a) and (b) compare to the corresponding values for a 3-sigma chart?
Question
Question
Which of the following statements are not true?
A) One standard method for designing a double-sampling plan involves specifying values
Along with corresponding acceptance probabilities
Then find a plan that satisfies these conditions.
B) The average outgoing quality (AOQ) is the short-run proportion of defective items among those sent on before the sampling plan is employed.
C) Because the average outgoing quality AOQ = 0 when either p = 0 or p = 1, it follows that there is a value of p between 0 and 1 for which AOQ is a maximum.
D) The maximum value of the average outgoing quality (AOQ) is called the average outgoing quality limit (AOQL).
E) It is common practice to select a sampling plan that has a specified average outgoing quality limit (AOQL) and, in addition, minimum average total number inspected (ATI) at a particular quality level p.
Question

Unlock Deck
Sign up to unlock the cards in this deck!
Unlock Deck
Unlock Deck
1/86
Play
Full screen (f)
Deck 16: Quality Control Methods
1
The 3-sigma lower control limit (LCL) for an S chart is given by LCL = where the values of for n=3, ….., 8 are tabulated in your text. This expression for LCL will be negative if __________, in which case it is customary to use LCL = __________.
where the values of for n=3, ….., 8 are tabulated in your text. This expression for LCL will be negative if __________, in which case it is customary to use LCL = __________.5, 0
2
The two control limit for 3 sigma chart have been calculated. If the variable of interest is normally distributed, and 3 is replaced by 3.09 in the control limits formulas, then probability of Type I error __________, but for any fixed n and , probability of Type II error will __________.
chart have been calculated. If the variable of interest is normally distributed, and 3 is replaced by 3.09 in the control limits formulas, then probability of Type I error __________, but for any fixed n and , probability of Type II error will __________.decreases, increase
3
An control chart is based on control limits When the process is in control, then the probability that a point falls outside the limits is __________.
control chart is based on control limits When the process is in control, then the probability that a point falls outside the limits is __________..0124
4
Sources of variation that may have a pernicious impact on the quality of items produced by some process, such as contaminated material, are referred to as __________ in the quality control literature.
Unlock Deck
Unlock for access to all 86 flashcards in this deck.
Unlock Deck
k this deck
5
An control chart is based on control limits When the process is in control, then the average run length (ARL) is __________.
control chart is based on control limits When the process is in control, then the average run length (ARL) is __________. Unlock Deck
Unlock for access to all 86 flashcards in this deck.
Unlock Deck
k this deck
6
Suppose there are 25 samples obtained at equally spaced time points, and n=5 observations in each sample. If the sum of the 25 sample standard deviations is 50, then the center line of the S chart will be at height equals to __________.
Unlock Deck
Unlock for access to all 86 flashcards in this deck.
Unlock Deck
k this deck
7
For a sample of size 5, the tabulated value of If the population standard deviation then the standard deviation of the sample standard deviation S is __________, rounded to 3 decimal places.
If the population standard deviation then the standard deviation of the sample standard deviation S is __________, rounded to 3 decimal places. Unlock Deck
Unlock for access to all 86 flashcards in this deck.
Unlock Deck
k this deck
8
When an in-control process yields a point outside the control limits (an out-of-control signal), a type __________ error has occurred.
Unlock Deck
Unlock for access to all 86 flashcards in this deck.
Unlock Deck
k this deck
9
If the points on a control chart all lie between the two central limits, the process is deemed to __________.
Unlock Deck
Unlock for access to all 86 flashcards in this deck.
Unlock Deck
k this deck
10
When an out-of-control process produces a point inside the control limits, a type __________ error has occurred.
Unlock Deck
Unlock for access to all 86 flashcards in this deck.
Unlock Deck
k this deck
11
__________ are now used extensively in industry as diagnostic techniques for monitoring production processes to identify instability and unusual circumstances.
Unlock Deck
Unlock for access to all 86 flashcards in this deck.
Unlock Deck
k this deck
12
An control chart is constructed using 25 samples of size 3 each, when the process is in-control and the random variable of interest is normally distributed with a mean of 20 and standard deviation of 1.732. Then, the 3 standard deviation control limits are LCL = __________ and UCL =__________.
control chart is constructed using 25 samples of size 3 each, when the process is in-control and the random variable of interest is normally distributed with a mean of 20 and standard deviation of 1.732. Then, the 3 standard deviation control limits are LCL = __________ and UCL =__________. Unlock Deck
Unlock for access to all 86 flashcards in this deck.
Unlock Deck
k this deck
13
Suppose there are 24 samples obtained at equally spaced time points, and n=4 observations in each sample. If the sum of the 24 samples ranges is 108, then the center line of the R chart will be at height equals to __________.
Unlock Deck
Unlock for access to all 86 flashcards in this deck.
Unlock Deck
k this deck
14
In addition to the plotted points themselves (e.g., sample means or sample proportions), a control chart has a __________ and two__________.
Unlock Deck
Unlock for access to all 86 flashcards in this deck.
Unlock Deck
k this deck
15
The 3-sigma lower control limit (LCL) for an R chart is given by LCL = where the values of for n=3,…..,8 are tabulated in your text. This expression for LCL will be negative if __________, in which case it is customary to use LCL = __________.
where the values of for n=3,…..,8 are tabulated in your text. This expression for LCL will be negative if __________, in which case it is customary to use LCL = __________. Unlock Deck
Unlock for access to all 86 flashcards in this deck.
Unlock Deck
k this deck
16
The two control limits for 3=sigma chart have been calculated. If the variable of interest is normally distributed, and 3 is replaced by 2.5 in the control limits formulas, then probability of Type I error __________, but for fixed n and , probability of Type II error will __________.
chart have been calculated. If the variable of interest is normally distributed, and 3 is replaced by 2.5 in the control limits formulas, then probability of Type I error __________, but for fixed n and , probability of Type II error will __________. Unlock Deck
Unlock for access to all 86 flashcards in this deck.
Unlock Deck
k this deck
17
The sample variance is an unbiased estimator of the population variance that is, __________ = __________.
is an unbiased estimator of the population variance that is, __________ = __________. Unlock Deck
Unlock for access to all 86 flashcards in this deck.
Unlock Deck
k this deck
18
Any point outside the lower control limit (LCL) and/or the upper control limit (UCL) of a 3-sigma chart suggests that the process may have been __________ at that time, so a search for __________ should be initiated.
chart suggests that the process may have been __________ at that time, so a search for __________ should be initiated. Unlock Deck
Unlock for access to all 86 flashcards in this deck.
Unlock Deck
k this deck
19
The term __________ data is used in quality control to describe situations such as each item produced conforms to specifications or does not, or a single item (e.g., one automobile) may have one or more defects, and the number of defects is determined.
Unlock Deck
Unlock for access to all 86 flashcards in this deck.
Unlock Deck
k this deck
20
The c control chart for the number of defectives in a single item (e.g., one automobile) or a group of items (e.g., blemishes on a set of four tires) is based on the __________ probability distribution.
Unlock Deck
Unlock for access to all 86 flashcards in this deck.
Unlock Deck
k this deck
21
If Y is a Poisson random variable with parameter then E(Y) = __________, V(Y) = __________, and also has approximately a __________ distribution when is large
then E(Y) = __________, V(Y) = __________, and also has approximately a __________ distribution when is large Unlock Deck
Unlock for access to all 86 flashcards in this deck.
Unlock Deck
k this deck
22
One important characteristic of a sampling plan with rectifying inspection is the __________, denoted by AOQ.
Unlock Deck
Unlock for access to all 86 flashcards in this deck.
Unlock Deck
k this deck
23
The average outgoing quality equals 0 when the proportion of defective items in the lot, p, is either __________ or __________.
Unlock Deck
Unlock for access to all 86 flashcards in this deck.
Unlock Deck
k this deck
24
Which of the following are not examples of assignable causes of variation?
A) Contaminated material
B) Incorrect machine settings
C) Environmental factors
D) Unusual machine tools wear
E) All of the above
A) Contaminated material
B) Incorrect machine settings
C) Environmental factors
D) Unusual machine tools wear
E) All of the above
Unlock Deck
Unlock for access to all 86 flashcards in this deck.
Unlock Deck
k this deck
25
The __________ is a chart developed by Kenneth Kemp that can be used to determine values of h and n that achieves a specified ARL (average run length).
Unlock Deck
Unlock for access to all 86 flashcards in this deck.
Unlock Deck
k this deck
26
There are two equivalent versions of a cumulative sum procedure for a process mean, one __________ and the __________.
Unlock Deck
Unlock for access to all 86 flashcards in this deck.
Unlock Deck
k this deck
27
Let p denote the proportion of defective items in the lot, and P(A) denote the probability that the lot is accepted. Let us designate two different values of p, one for which P(A) is a specified value close to 1 and the other for which P(A) is a specified value near 0. These tow values of are often called the __________, denoted AQL, and the __________, denoted by LTPD.
are often called the __________, denoted AQL, and the __________, denoted by LTPD. Unlock Deck
Unlock for access to all 86 flashcards in this deck.
Unlock Deck
k this deck
28
In a double-sampling plan, it is customary to terminate inspection of the second sample if the number of defectives is sufficient to justify rejection before all items have been examined. This is referred to as __________ in the second sample.
Unlock Deck
Unlock for access to all 86 flashcards in this deck.
Unlock Deck
k this deck
29
If the size of a shift in a process mean is .40, then the customarily value of the slope of the lower arm of the V-mask is __________.
is .40, then the customarily value of the slope of the lower arm of the V-mask is __________. Unlock Deck
Unlock for access to all 86 flashcards in this deck.
Unlock Deck
k this deck
30
Which of the following statements are not true?
A) Raising quality levels can lead to decreased costs, a greater degree of consumer satisfaction, and thus increased profitability.
B) Control Charting is now used extensively in industry as a diagnostic technique for monitoring production processes to identify instability and unusual circumstances.
C) The basis for most of control charts lies in our work concerning probability distributions of various statistics such as the sample mean
And sample proportion
D) All of the above statements are true.
E) None of the above statements are true.
Unlock Deck
Unlock for access to all 86 flashcards in this deck.
Unlock Deck
k this deck
31
Under curtailment in a double-sampling plan, it can be shown that the expected number of items inspected in a __________ is smaller than the number of items examined in a __________ when the operating characteristic (OC) curves of the two plans are close to be identical.
Unlock Deck
Unlock for access to all 86 flashcards in this deck.
Unlock Deck
k this deck
32
At time r, a process is judged out of control if any of the cumulative sum plotted values lies outside the __________; either above the upper arm or below the lower arm.
lies outside the __________; either above the upper arm or below the lower arm. Unlock Deck
Unlock for access to all 86 flashcards in this deck.
Unlock Deck
k this deck
33
The 3-sigma control limits of the p chart for the fraction of defective items in a process believed to be in control are LCL = .0125 and UCL = .1425. If the smallest and largest values of the fraction of defective items, are .0062 and .1685 respectively, then the process is __________.
the fraction of defective items, are .0062 and .1685 respectively, then the process is __________. Unlock Deck
Unlock for access to all 86 flashcards in this deck.
Unlock Deck
k this deck
34
Which of the following statements are true?
A) We might think of "natural random variation" as uncontrollable background noise.
B) Control charts provide a mechanism for recognizing situations where assignable causes may be adversely affecting product quality.
C) Once a control chart indicates an out-of-control situation, an investigation can be launched to identify causes and take corrective action.
D) A basic element of control charting is that samples have been selected from the process of interest at a sequence of time points.
E) All of the above statements are true.
Unlock Deck
Unlock for access to all 86 flashcards in this deck.
Unlock Deck
k this deck
35
The use of 3-sigma control limits is presumed to result in P(statistic __________, when the process is in control.
Unlock Deck
Unlock for access to all 86 flashcards in this deck.
Unlock Deck
k this deck
36
The p control chart for the fraction of defective items produced is based on the __________ probability distribution.
Unlock Deck
Unlock for access to all 86 flashcards in this deck.
Unlock Deck
k this deck
37
The behavior of a sampling plan can be nicely summarized by graphing P(A); the probability that the lot is accepted, as a function of p; the proportion of defective items in the lot. Such a graph is called the __________ for the plan.
Unlock Deck
Unlock for access to all 86 flashcards in this deck.
Unlock Deck
k this deck
38
Suppose that 25 samples, each of size 100, were selected from what is believed to be an in-control process, and that where is the fraction of defective items in sample i. The p chart for the fraction of defective items has its center line at height equals to __________.
where is the fraction of defective items in sample i. The p chart for the fraction of defective items has its center line at height equals to __________. Unlock Deck
Unlock for access to all 86 flashcards in this deck.
Unlock Deck
k this deck
39
If are independent Poisson variables with common parameter then has also a Poisson distribution with parameter = __________, where denotes the expected number of defects per unit.
are independent Poisson variables with common parameter then has also a Poisson distribution with parameter = __________, where denotes the expected number of defects per unit. Unlock Deck
Unlock for access to all 86 flashcards in this deck.
Unlock Deck
k this deck
40
Which of the following statements are not true?
A) Control charts and acceptance sampling plans were first developed in the 1960's and 1970's.
B) Statisticians and engineers have recently introduced many statistical methods for identifying types and levels of production inputs that will ensure high-quality output.
C) There is a large body of material known as "Taguchi methods", named after Japanese engineer/statistician G. Taguchi.
D) All of the above statements are true.
E) None of the above statements are true.
Unlock Deck
Unlock for access to all 86 flashcards in this deck.
Unlock Deck
k this deck
41
Assume that for an in-control process, the random variable of interest X has a normal distribution with mean value and standard deviation . If denotes the sample mean for a random sample of size n selected at a particular time, then
A)
B)
C)
Has a normal distribution.
D) All of the above are true.
E) None of the above are true.
and standard deviation . If denotes the sample mean for a random sample of size n selected at a particular time, thenA)
B)
C)
Has a normal distribution.
D) All of the above are true.
E) None of the above are true.
Unlock Deck
Unlock for access to all 86 flashcards in this deck.
Unlock Deck
k this deck
42
The inability of charts with 3-sigma limits to quickly detect small shifts in the process mean has prompted investigators to develop procedures that provide improved behavior in this respect. Which of the following conditions need to be satisfied for an appropriated intervention to take corrective action?
A) Two out of three successive points fall outside 2-sigma limits on the same side of the center line.
B) Four out of five successive points fall outside 1-sigma limits on the same side of the center line.
C) Eight successive points fall on the same side of the center line.
D) All of the above.
E) None of the above.
charts with 3-sigma limits to quickly detect small shifts in the process mean has prompted investigators to develop procedures that provide improved behavior in this respect. Which of the following conditions need to be satisfied for an appropriated intervention to take corrective action?A) Two out of three successive points fall outside 2-sigma limits on the same side of the center line.
B) Four out of five successive points fall outside 1-sigma limits on the same side of the center line.
C) Eight successive points fall on the same side of the center line.
D) All of the above.
E) None of the above.
Unlock Deck
Unlock for access to all 86 flashcards in this deck.
Unlock Deck
k this deck
43
Which of the following statements are true?
A) The CUSUM procedures discussed in your text are used for controlling process location.
B) There are CUSUM procedures for controlling process variation.
C) There are CUSUM procedures for attribute data.
D) None of the above statements are true.
E) All of the above statements are true.
A) The CUSUM procedures discussed in your text are used for controlling process location.
B) There are CUSUM procedures for controlling process variation.
C) There are CUSUM procedures for attribute data.
D) None of the above statements are true.
E) All of the above statements are true.
Unlock Deck
Unlock for access to all 86 flashcards in this deck.
Unlock Deck
k this deck
44
Assume that the total number of defects in 50 samples are 450. Which of the following statements are not true regarding the c chart for the number of defectives?
A) The center line of the chart is at height 9
B) The lower control limit (LCL) is 0
C) The upper control limit (UCL) is 18
D) All of the above statements are true
E) None of the above statements are true
A) The center line of the chart is at height 9
B) The lower control limit (LCL) is 0
C) The upper control limit (UCL) is 18
D) All of the above statements are true
E) None of the above statements are true
Unlock Deck
Unlock for access to all 86 flashcards in this deck.
Unlock Deck
k this deck
45
Which of the following statements are true?
A) The p control chart for the fraction of items not conforming to specifications is based on the binomial probability distribution.
B) The c control chart for the number of defectives is based on the Poisson probability distribution.
C) If the random variable X has a binomial distribution with parameters n and p, then when p is small the transformation
Is recommended and that the points
Should be used to construct the p chart.
D) If the random variable X has a Poisson distribution with parameter
And
Is small, then the transformation
Is recommended and that the points
Should be used to construct the c chart.
E) All of the above statements are correct
Unlock Deck
Unlock for access to all 86 flashcards in this deck.
Unlock Deck
k this deck
46
Which of the following statements are true?
A) A defect on the traditional
Chart is its inability to detect a relatively small change in a process mean.
B) Whether a process is judged out of control at a particular time depends only on the sample at that time, and not on the past history of the process.
C) The computational version of a cumulative sum (CUSUM) procedure is used almost exclusively in practice, but the logic behind the procedure is most easily grasped by first considering the graphical form.
D) All of the above statements are true.
E) None of the above statements are true.
Unlock Deck
Unlock for access to all 86 flashcards in this deck.
Unlock Deck
k this deck
47
Which of the following statements are true?
A) Generally speaking, a control chart will be effective if it gives very few out-of-control signals when the process is I control, but shows a point outside the control limits almost as soon as the process goes out of control.
B) One assessment of a control chart's effectiveness is based on the notion of "error probabilities"
C) The use of a 3-sigma limits for an
Chart makes it highly unlikely that an out-of-control signal will result from an in-control process.
D) One assessment of a control chart's effectiveness involves the average run length (ARL) needed to observe an out-of-control signal.
E) All of the above statements are true.
Unlock Deck
Unlock for access to all 86 flashcards in this deck.
Unlock Deck
k this deck
48
Suppose there are 28 samples obtained at equally spaced time points, and n=7 observations in each sample. If the sum of the 28 sample ranges is 98, and that the tabulated values of and are 2.706 and .833, respectively, then the 3-sigma control limits LCL and UCL for an R control chart are respectively
A) 0.0 and 6.73
B) .27 and 6.73
C) -30.61 and 37.61
D) 0.0 and 37.61
E) None of the above answers are correct.
and are 2.706 and .833, respectively, then the 3-sigma control limits LCL and UCL for an R control chart are respectivelyA) 0.0 and 6.73
B) .27 and 6.73
C) -30.61 and 37.61
D) 0.0 and 37.61
E) None of the above answers are correct.
Unlock Deck
Unlock for access to all 86 flashcards in this deck.
Unlock Deck
k this deck
49
Suppose there are 10 sample obtained at equally spaced time points, and n=4 observations in each sample. If the sum of the 20 sample standard deviations is 42, and that the tabulated value of is .921, then the 3-sigma control limits LCL and UCL for an S control chart are respectively
A) 1.062 and 3.138
B) 3.138 and 4.765
C) 0.0 and 4.765
D) -.354 and 4.554
E) -.565 and 4.765
is .921, then the 3-sigma control limits LCL and UCL for an S control chart are respectivelyA) 1.062 and 3.138
B) 3.138 and 4.765
C) 0.0 and 4.765
D) -.354 and 4.554
E) -.565 and 4.765
Unlock Deck
Unlock for access to all 86 flashcards in this deck.
Unlock Deck
k this deck
50
Which of the following statements are not true?
A) To construct an
Chart, there are two different commonly used methods for estimating the unknown process standard deviation
; one based on the k sample standard deviations and the other on the k sample ranges.
B) In the case of a normal population distribution, the estimator of the unknown process standard deviation
Based on sample standard deviations S is more efficient than that based on the sample range.
C) The sample standard deviation S is an unbiased estimator of the population standard deviation
; that is, E(S)=
)
D) All of the above statements are true.
E) None of the above statements are true.
Unlock Deck
Unlock for access to all 86 flashcards in this deck.
Unlock Deck
k this deck
51
Which of the following statements are not correct?
A) For a 3-sigma
Chart, where the process mean
And standard deviation
Are known, the probability that a point on the chart falls above the UCL is .013, as is the probability that the point falls below the LCL.
B) For a 3-sigma S chart,
C) For a 3-sigma R chart,
D) Only B and C are not correct.
E) Only A and C are not correct.
A) For a 3-sigma
Chart, where the process mean
And standard deviation
Are known, the probability that a point on the chart falls above the UCL is .013, as is the probability that the point falls below the LCL.
B) For a 3-sigma S chart,
C) For a 3-sigma R chart,
D) Only B and C are not correct.
E) Only A and C are not correct.
Unlock Deck
Unlock for access to all 86 flashcards in this deck.
Unlock Deck
k this deck
52
Which of the following statements are true?
A) It is important to ensure that a process is under control with respect to location (equivalently, central tendency) as well as variation.
B) Most practitioners recommend that control of a process be established on variation prior to constructing an
Chart or any other chart for controlling location.
C) Charts for variation are based on the sample standard deviation S and also based on the sample range R.
D) Charts for variation that are based on the sample standard deviation S are generally preferred over charts that are based on the sample range R because the standard deviation gives a more efficient assessment of variation than does the range.
E) All of the above statements are true.
Unlock Deck
Unlock for access to all 86 flashcards in this deck.
Unlock Deck
k this deck
53
Which of the following statements are not true?
A) One important use of control charts is to see whether some measure of location of the variable's distribution remains stable over time.
B) It is highly unlikely that for an in-control process, the sample mean will fall within 3 standard deviations
Of the process mean
C) The use of control charts based on 3 standard deviation limits is traditional, but tradition is certainly not inviolable.
D) All of the above statements are true.
E) None of the above statements are true.
Unlock Deck
Unlock for access to all 86 flashcards in this deck.
Unlock Deck
k this deck
54
Suppose that 25 samples, each of size 200, we selected from what is believed to be an in-control process, and that is the fraction of defective items in sample i. The 3-sigma control limits, LCL and UCL, of the p chart for the fraction of defective items are respectively
A) .0236 and .244
B) -.0462 and .0942
C) 0 and .0564
D) 0 and .0942
E) -.0084 and .0564
is the fraction of defective items in sample i. The 3-sigma control limits, LCL and UCL, of the p chart for the fraction of defective items are respectivelyA) .0236 and .244
B) -.0462 and .0942
C) 0 and .0564
D) 0 and .0942
E) -.0084 and .0564
Unlock Deck
Unlock for access to all 86 flashcards in this deck.
Unlock Deck
k this deck
55
Consider a sample of n items obtained at a particular time, and let X be the number of defectives and Which of the following statements are not true?
A) E(X) = np
B) V(X) = p(1-p)
C)
D)
E) If
Has approximately a normal distribution.
Which of the following statements are not true?A) E(X) = np
B) V(X) = p(1-p)
C)
D)
E) If
Has approximately a normal distribution.
Unlock Deck
Unlock for access to all 86 flashcards in this deck.
Unlock Deck
k this deck
56
Suppose that k independently selected samples are available, each one consisting of n observations on a normally distributed variable. Denote the sample standard deviations by The values are plotted in sequence on an S chart. The center line of the chart will be at height equals to the
A) average of the values
)
B) range of the values
)
C) standard deviation of the values
)
D) first quartile of the values
)
E) third quartile of the values
)
The values are plotted in sequence on an S chart. The center line of the chart will be at height equals to theA) average of the values
)
B) range of the values
)
C) standard deviation of the values
)
D) first quartile of the values
)
E) third quartile of the values
)
Unlock Deck
Unlock for access to all 86 flashcards in this deck.
Unlock Deck
k this deck
57
Which of the following statements are not true?
A) The basis for the choice of a center line for a control chart is sometimes a target value or design specification, for example a desired value of the bearing diameter.
B) An "in-control" process is a process that "meets design specifications or tolerance".
C) An in-control process is simply one whose behavior with respect to variation is stable over time, showing indications of unusual extraneous causes.
D) If the points on a control chart all lie between the two control limits, the process is deemed to be in control.
E) All of the above statements are true.
Unlock Deck
Unlock for access to all 86 flashcards in this deck.
Unlock Deck
k this deck
58
Suppose that at each of the time points 1,2,3,….., a sample of size n is selected at random from a normal distribution with known mean and standard deviation In order to construct a 3-sigma chart, we need to
A) determine
Calculated values of the corresponding sample means.
B) plot
Over time; that is, plot the points
And so on.
C) Draw horizontal lines across the plot as
)
D) All of the above are needed.
E) Only A and B are needed.
and standard deviation In order to construct a 3-sigma chart, we need toA) determine
Calculated values of the corresponding sample means.
B) plot
Over time; that is, plot the points
And so on.
C) Draw horizontal lines across the plot as
)
D) All of the above are needed.
E) Only A and B are needed.
Unlock Deck
Unlock for access to all 86 flashcards in this deck.
Unlock Deck
k this deck
59
Which of the following statements are not true?
A) A particular V-mask is determined by specifying the "lead distance" d and "half angle"
, or equivalently, by specifying d and the length h of the vertical line segment from 0 to the lower (or to the upper) arm of the mask.
B) One method for deciding which V-mask to use involves specifying the size of a shift in the process mean that is of particular concern to an investigator, then the parameters of the mask are chosen to give desired values of
The false-alarm probability and the probability of not detecting the specified shift, respectively.
C) One method for deciding which V-mask to use involves selecting the mask that yields specified values of the ARL (average run length) both for an in-control process and for a process in which the mean has shifted by a designated amount.
D) All of the above statements are true.
E) None of the above statements are true.
Unlock Deck
Unlock for access to all 86 flashcards in this deck.
Unlock Deck
k this deck
60
Which of the following statements are not true?
A) An in-control process is simply one that is operating in a stable fashion, reflecting only natural random variation.
B) An out-of-control "signal" occurs whenever a plotted point falls outside the two control limits.
C) There is a strong analogy between the logic of control charting and hypothesis testing. The null hypothesis here is that the process is out-of-control.
D) The two control limits are designed so that an in-control process generates very few false alarms, whereas a process not in control quickly gives rise to a point outside the limits.
E) All of the above statements are true.
Unlock Deck
Unlock for access to all 86 flashcards in this deck.
Unlock Deck
k this deck
61
Which of the following statements are not true?
A) If we let
Denote the size of a shift in a process mean
That is to be quickly detected using a CUSUM procedure, then it is common practice to let
Where k denotes the slope of the lower arm of the V-mask.
B) A quality control practitioner may specify a desired value of an ARL (average run length) when the process is in control
C) A quality control practitioner may specify a desire value of an ARL (average run length) when the process is out of control because the mean has shifted by
D) All of the above statements are true.
E) None of the above statements are true.
Unlock Deck
Unlock for access to all 86 flashcards in this deck.
Unlock Deck
k this deck
62
Suppose a control chart is constructed so that the probability of a point falling outside the control limits when the process is actually in control is .005.
a. What is the probability that ten successive points (based on independently selected samples) will be within the control limits?
b. What is the probability that 25 successive points will all lie within the control limits?
c. What is the smallest number of successive points plotted for which the probability of observing at least one outside the control limits exceeds .10?
Unlock Deck
Unlock for access to all 86 flashcards in this deck.
Unlock Deck
k this deck
63
A manufacturer of dustless chalk instituted a quality control program to monitor chalk density. The sample standard deviations of densities of n = 8 chalk specimens, were as follow: Calculate limits for an S chart, and check for out-of-control points. If there is an out-of-control point, delete it and repeat the process.
Calculate limits for an S chart, and check for out-of-control points. If there is an out-of-control point, delete it and repeat the process. Unlock Deck
Unlock for access to all 86 flashcards in this deck.
Unlock Deck
k this deck
64
A sample of ROM computer chips was selected on each of 30 consecutive days, and the number of nonconforming chips on each day was as follows: Determine control limits for a 3-sigma p chart and specify any out-of-control points.
Determine control limits for a 3-sigma p chart and specify any out-of-control points. Unlock Deck
Unlock for access to all 86 flashcards in this deck.
Unlock Deck
k this deck
65
Consider a double-sampling plan with Which of the following equalities are not correct if the lot will be accepted?
A)
B)
C)
D)
E) None of the above are correct
Which of the following equalities are not correct if the lot will be accepted?A)
B)
C)
D)
E) None of the above are correct
Unlock Deck
Unlock for access to all 86 flashcards in this deck.
Unlock Deck
k this deck
66
Let the random variable X denote the number of defective items in the lot, A denote the event that the lot is accepted, and p denote the proportion of defective items in the lot. Which of the following statements is not true?
A) If the sample size n is large relative to the lot size N, then the probability of accepting the lot, P(A), is calculated using the hypergeometric distribution.
B) When the sample size n is small relative to the lot size N (the rule of thumb suggested in your text was
), then the probability of accepting the , P(A), is calculated using the binomial distribution.
C) If the probability of accepting the lot, P(A), is large only when p is small (this, of course, depends on the specified critical value c), then the Poisson approximation to the binomial distribution is justified.
D) The larger value of p, the larger the probability P(A) of accepting the lot.
E) All of the above statements are true.
A) If the sample size n is large relative to the lot size N, then the probability of accepting the lot, P(A), is calculated using the hypergeometric distribution.
B) When the sample size n is small relative to the lot size N (the rule of thumb suggested in your text was
), then the probability of accepting the , P(A), is calculated using the binomial distribution.
C) If the probability of accepting the lot, P(A), is large only when p is small (this, of course, depends on the specified critical value c), then the Poisson approximation to the binomial distribution is justified.
D) The larger value of p, the larger the probability P(A) of accepting the lot.
E) All of the above statements are true.
Unlock Deck
Unlock for access to all 86 flashcards in this deck.
Unlock Deck
k this deck
67
Subgroups of power supply units are selected once each hour from an assembly line, and the high-voltage output of each unit is determined.
a. Suppose the sum of the resulting sample ranges for 30 subgroups, each consisting of four units, is 84. Calculate control limits for an R chart.
b. Repeat part (a) if each subgroup consists of eight units and the sum is 105.
a. Suppose the sum of the resulting sample ranges for 30 subgroups, each consisting of four units, is 84. Calculate control limits for an R chart.
b. Repeat part (a) if each subgroup consists of eight units and the sum is 105.
Unlock Deck
Unlock for access to all 86 flashcards in this deck.
Unlock Deck
k this deck
68
In the case of known what control limits are necessary for the probability of a single point being outside the limits for an in-control process to be .003?
what control limits are necessary for the probability of a single point being outside the limits for an in-control process to be .003? Unlock Deck
Unlock for access to all 86 flashcards in this deck.
Unlock Deck
k this deck
69
For what values will the LCL in a 3-sigma c chart be negative?
values will the LCL in a 3-sigma c chart be negative? Unlock Deck
Unlock for access to all 86 flashcards in this deck.
Unlock Deck
k this deck
70
The accompanying observations are numbers of defects in 25 1-square-yard specimens of woven fabric of a certain type: 3, 7, 5, 3, 4, 2, 8, 4, 3, 3, 6, 6, 2, 3, 2, 4, 7, 3, 2, 3, 4, 1, 5, 4, 6. Determine control limits for a 3-sigma c chart for the number of defects, and discuss the behavior of the chart.
Unlock Deck
Unlock for access to all 86 flashcards in this deck.
Unlock Deck
k this deck
71
The accompanying table gives sample means and standard deviations, each based on n = 6 observations of the refractive index of fiber-optic cable. Calculate the control limits for an chart based on the sample standard deviations given, and comment on the behavior of the chart. [Hint: ]
chart based on the sample standard deviations given, and comment on the behavior of the chart. [Hint: ] Unlock Deck
Unlock for access to all 86 flashcards in this deck.
Unlock Deck
k this deck
72
In acceptance sampling, the risk of accepting a poor quality lot is considered a
A) Type I error.
B) consumer's risk.
C) producer's risk.
D) bad luck lot.
E) None of the above.
A) Type I error.
B) consumer's risk.
C) producer's risk.
D) bad luck lot.
E) None of the above.
Unlock Deck
Unlock for access to all 86 flashcards in this deck.
Unlock Deck
k this deck
73
A control chart for thickness of rolled-steel sheets is based on an upper control limit of .0525 inch and a lower limit of .0475 inch. The first ten values of the quality statistic (in this case the sample mean thickness of n =5 sample sheets) are .0508, .0495, .0504, .0503, .0514, .0500, .0487, .0502, .0507, and .0485. Comment on the behavior of this control chart.
the sample mean thickness of n =5 sample sheets) are .0508, .0495, .0504, .0503, .0514, .0500, .0487, .0502, .0507, and .0485. Comment on the behavior of this control chart. Unlock Deck
Unlock for access to all 86 flashcards in this deck.
Unlock Deck
k this deck
74
When n = 180, what is the smallest value of for which the LCL in a 3-sigma p chart is positive?
for which the LCL in a 3-sigma p chart is positive? Unlock Deck
Unlock for access to all 86 flashcards in this deck.
Unlock Deck
k this deck
75
Consider a 3-sigma control chart with center line at and based on n = 5. Assuming normality, calculate the probability that a single point will fall outside the control limits when the actual process mean is
a.
b.
c.
and based on n = 5. Assuming normality, calculate the probability that a single point will fall outside the control limits when the actual process mean is a.
b.
c.
Unlock Deck
Unlock for access to all 86 flashcards in this deck.
Unlock Deck
k this deck
76
A control chart for thickness of rolled-steel sheets is based on an upper control limit of .0525 inch and a lower limit of .0475inch. Suppose the ten most recent values of the quality statistic are .0493, .0485, .0490, .0503, .0492, .0486, .0495, .0494, .0493, and .0488. Comment on the behavior of this control chart.
Unlock Deck
Unlock for access to all 86 flashcards in this deck.
Unlock Deck
k this deck
77
Consider the control chart based on control limits
a. What is the ARL when the process is in control?
b. What is the ARL when n = 4 and the process mean has shifted to
?
c. How do the values of parts (a) and (b) compare to the corresponding values for a 3-sigma chart?
a. What is the ARL when the process is in control?
b. What is the ARL when n = 4 and the process mean has shifted to
?
c. How do the values of parts (a) and (b) compare to the corresponding values for a 3-sigma chart?
Unlock Deck
Unlock for access to all 86 flashcards in this deck.
Unlock Deck
k this deck
78
In acceptance sampling, the risk of rejecting a good quality lot is considered a
A) Type II error
B) consumer's risk
C) producer's risk
D) bad luck lot
E) None of the above
A) Type II error
B) consumer's risk
C) producer's risk
D) bad luck lot
E) None of the above
Unlock Deck
Unlock for access to all 86 flashcards in this deck.
Unlock Deck
k this deck
79
Which of the following statements are not true?
A) One standard method for designing a double-sampling plan involves specifying values
Along with corresponding acceptance probabilities
Then find a plan that satisfies these conditions.
B) The average outgoing quality (AOQ) is the short-run proportion of defective items among those sent on before the sampling plan is employed.
C) Because the average outgoing quality AOQ = 0 when either p = 0 or p = 1, it follows that there is a value of p between 0 and 1 for which AOQ is a maximum.
D) The maximum value of the average outgoing quality (AOQ) is called the average outgoing quality limit (AOQL).
E) It is common practice to select a sampling plan that has a specified average outgoing quality limit (AOQL) and, in addition, minimum average total number inspected (ATI) at a particular quality level p.
Unlock Deck
Unlock for access to all 86 flashcards in this deck.
Unlock Deck
k this deck
80
On each of the previous 25 days, 100 electronic devices of a certain type were randomly selected and subjected to a severe heat stress test. The total number of items that failed to pass the test was 570.
a. Determine control limits for a 3-sigma p chart.
b. The highest number of failed items on a given day was 40, and the lowest number was 12. Does either of these correspond to an out-of-control point? Explain.
a. Determine control limits for a 3-sigma p chart.
b. The highest number of failed items on a given day was 40, and the lowest number was 12. Does either of these correspond to an out-of-control point? Explain.
Unlock Deck
Unlock for access to all 86 flashcards in this deck.
Unlock Deck
k this deck
Unlock Deck
Unlock for access to all 86 flashcards in this deck.


