Deck 9: Inferences Based on Two Samples
Full screen (f)
Question
In testing  denote the two population properties, the P-value is found to be .0715. Then at .05 level,
  should __________.
denote the two population properties, the P-value is found to be .0715. Then at .05 level, should __________. Question
Let  be a random sample from a normal population with mean
  be a random sample from a normal population with mean
  be a random sample from a normal population with mean
  =16, and that X and Y samples are independent of one another. If the sample mean values are
  then the value of the test statistic to test
  is z = __________ and that
  will be rejected at .01 significance level if
be a random sample from a normal population with mean be a random sample from a normal population with mean be a random sample from a normal population with mean =16, and that X and Y samples are independent of one another. If the sample mean values are then the value of the test statistic to test is z = __________ and that will be rejected at .01 significance level if Question
The pooled t confidence interval for estimating  with confidence level
  using two independent samples X and Y with sizes m and n is given by __________.
with confidence level using two independent samples X and Y with sizes m and n is given by __________. Question
Provided that at least one of the sample sizes m and n of two independent samples X and Y is small, and that the corresponding populations are both normally distributed with unknown values of the population variances, then a confidence interval for the difference between the two population means,  with a confidence level of
  is __________.
with a confidence level of is __________. Question
A 90% confidence interval for  the true mean difference in paired data consisting of n independent pairs, is determined by the formula __________.
the true mean difference in paired data consisting of n independent pairs, is determined by the formula __________. Question
Question
The number of degrees of freedom for a paired t test, where the data consists of n independently pairs  is __________.
is __________. Question
Let  be a random sample from a population with mean
  be a random sample with mean
  and that the X and Y samples are independent of one another. The expected value of
  is __________ and the standard deviation of
  = __________.
be a random sample from a population with mean be a random sample with mean and that the X and Y samples are independent of one another. The expected value of is __________ and the standard deviation of = __________. Question
Analogous to the notation  for the point on the axis that captures __________ of the area under the F density curve with
  degrees of freedom in the __________ tail.
for the point on the axis that captures __________ of the area under the F density curve with degrees of freedom in the __________ tail. Question
The weighted average of the variances  of two independent samples is referred to as the __________ of
  (the common variance of the two population variances), and is denoted by __________.
of two independent samples is referred to as the __________ of (the common variance of the two population variances), and is denoted by __________. Question
The rejection region for level .025 paired t test in testing  is __________, where the data consists of 12 independent pairs.
is __________, where the data consists of 12 independent pairs. Question
Let  with X and Y independent variables, and let
  is an __________ estimator of
with X and Y independent variables, and let is an __________ estimator of Question
Provided that the sample sizes m and n of two independent samples X and Y are both large , then a confidence interval for the difference between the two population means,  with a confidence level of approximately
  is __________, where the values of the population variances are unknown.
with a confidence level of approximately is __________, where the values of the population variances are unknown. Question
In testing  the computed value of the test statistic is z = 2.25. The P-value for this two-tailed test is then __________.
the computed value of the test statistic is z = 2.25. The P-value for this two-tailed test is then __________. Question
Question
In testing  where
where  is the true mean difference in paired data consisting of 16 independent pairs, the value of the test statistic is found to be 2.8. Then the P-value is approximately __________.
where is the true mean difference in paired data consisting of 16 independent pairs, the value of the test statistic is found to be 2.8. Then the P-value is approximately __________. Question
Question
If  are independent __________ random variables with
  degrees of freedom respectively, then the random variable
  has an F distribution.
are independent __________ random variables with degrees of freedom respectively, then the random variable has an F distribution. Question
In testing  where
where  denote the two population proportions, the standardized variable
  is an estimate of the common value of
  and m and n are the two sample sizes, has approximately a standard normal distribution when __________.
where denote the two population proportions, the standardized variable is an estimate of the common value of and m and n are the two sample sizes, has approximately a standard normal distribution when __________. Question
In testing  denote the two population proportions, the following summary statistics are given: m = 400, x = 140, n = 500 and y = 160. Then the value of the test statistic is z = __________.
denote the two population proportions, the following summary statistics are given: m = 400, x = 140, n = 500 and y = 160. Then the value of the test statistic is z = __________. Question
Which of the following statements are true?
A) When the alternative hypothesis is
The null hypothesis
Is considerably smaller than the null value
)
B) When the alternative hypothesis is
The null hypothesis
Is considerably larger than the null value
)
C) When the alternative hypothesis is
The null hypothesis
Is too far to either side of the null value
)
D) All of the above statements are true.
E) None of the above statements are true.
Question
Question
In testing  the computed value of the test statistic is z = 1.98. The P-value for this two-tailed test is then
A) .4761
B) .0478
C) .0239
D) .2381
E) .2619
the computed value of the test statistic is z = 1.98. The P-value for this two-tailed test is thenA) .4761
B) .0478
C) .0239
D) .2381
E) .2619
Question
Which of the following statements are not necessarily true about the paired t test?
A) The data consists of n independently selected pairs
B) The differences
Are assumed to be normally distributed.
C) The X and Y observations within each pair
Are independent.
D) The
Are not independent of one another.
E) All of the above statements are true.
A) The data consists of n independently selected pairs
B) The differences
Are assumed to be normally distributed.
C) The X and Y observations within each pair
Are independent.
D) The
Are not independent of one another.
E) All of the above statements are true.
Question
In calculating 95% confidence interval for  the difference between the means of two normally distributed populations, summary statistics from two independent samples are:
  Then, the lower limit of the confidence interval is:
A) 29.994
B) 11.587
C) 10.006
D) 10.797
E) 28.413
the difference between the means of two normally distributed populations, summary statistics from two independent samples are: Then, the lower limit of the confidence interval is:A) 29.994
B) 11.587
C) 10.006
D) 10.797
E) 28.413
Question
Two independent samples of sizes 15 and 17 are randomly selected from two normal populations with equal variances. Which of the following distributions should be used for developing confidence intervals and for testing hypotheses about the difference between the two population means 
A) The standard normal distribution
B) The t distribution with 32 degrees of freedom
C) The t distribution with 31 degrees of freedom
D) The t distribution with 30 degrees of freedom
E) Any continuous distribution since the sum of the two sample sizes exceeds 30
A) The standard normal distribution
B) The t distribution with 32 degrees of freedom
C) The t distribution with 31 degrees of freedom
D) The t distribution with 30 degrees of freedom
E) Any continuous distribution since the sum of the two sample sizes exceeds 30
Question
At the .05 significance level, the null hypothesis  is rejected in a paired t test, where the data consists of 15 independent pairs, if
A)
B)
C) either
D)
E)
is rejected in a paired t test, where the data consists of 15 independent pairs, ifA)
B)
C) either
D)
E)
Question
In calculating 95% confidence interval for  the difference between the means of two normally distributed populations, summary statistics from two independent samples are:
  Then, the upper limit of the confidence interval is
A) 10.953
B) 9.047
C) 9.216
D) 10.784
E) 10.0
the difference between the means of two normally distributed populations, summary statistics from two independent samples are: Then, the upper limit of the confidence interval isA) 10.953
B) 9.047
C) 9.216
D) 10.784
E) 10.0
Question
Which of the following statements are not true if a test procedure about the difference between two population means  is performed when both population distributions are normal and that the values of both population variances
  are known?
A) The rejection region for level
If the test is an upper-tailed test.
B) The rejection region for level
If the test is a lower-tailed test.
C) The rejection region for level
If the test is a two-tailed test.
D) All of the above statements are true.
E) None of the above statements are true.
is performed when both population distributions are normal and that the values of both population variances are known?A) The rejection region for level
If the test is an upper-tailed test.
B) The rejection region for level
If the test is a lower-tailed test.
C) The rejection region for level
If the test is a two-tailed test.
D) All of the above statements are true.
E) None of the above statements are true.
Question
Question
In testing  degrees of freedom, if the test statistic value f = 4.53, then P-value = __________.
degrees of freedom, if the test statistic value f = 4.53, then P-value = __________. Question
Let  be a random sample from a normal distribution with variance
  be another random sample (independent of the
  from a normal distribution with variance
  denote the two sample variances. Then the random variable
  has an F distribution with
be a random sample from a normal distribution with variance be another random sample (independent of the from a normal distribution with variance denote the two sample variances. Then the random variable has an F distribution with Question
Which of the following statements are not correct assumptions for developing pooled confidence intervals and for testing hypotheses about the difference between two population means 
A) Both populations are normally distributed
B) The samples selected from the two populations are independent random samples.
C) At least one of the two sample sizes is small.
D) The two population variances are equal
E) The two population variances are not equal
A) Both populations are normally distributed
B) The samples selected from the two populations are independent random samples.
C) At least one of the two sample sizes is small.
D) The two population variances are equal
E) The two population variances are not equal
Question
Question
Let  be a random sample from a population with mean
  be a random sample from a population with mean
  and that the X and Y samples are independent of one another. Which of the following statements are not true?
A) The natural estimator of
B) The expected value of
C) The expected value of
D)
Is an unbiased estimator of
E) All of the above statements are true.
be a random sample from a population with mean be a random sample from a population with mean and that the X and Y samples are independent of one another. Which of the following statements are not true?A) The natural estimator of
B) The expected value of
C) The expected value of
D)
Is an unbiased estimator of
E) All of the above statements are true.
Question
When variances  of two independent samples are combined and
  is computed, the
  is referred to as
A) the pooled estimator of
B) the combined estimator of
C) the pooled estimator of the common variance
Of the two populations
D) the adjusted estimator of
E) None of the above answers are correct.
of two independent samples are combined and is computed, the is referred to asA) the pooled estimator of
B) the combined estimator of
C) the pooled estimator of the common variance
Of the two populations
D) the adjusted estimator of
E) None of the above answers are correct.
Question
Let  be a random sample from a normal population with mean
  and let
  be a random sample from a normal population with mean
  and that the X and Y samples are independent of one another. Which of the following statements are true?
A)
Is normally distributed with expected value
B)
Is normally distributed with expected value
C)
Is normally distributed with expected value
D)
Is an unbiased estimator of
)
E) All of the above statements are true.
be a random sample from a normal population with mean and let be a random sample from a normal population with mean and that the X and Y samples are independent of one another. Which of the following statements are true?A)
Is normally distributed with expected value
B)
Is normally distributed with expected value
C)
Is normally distributed with expected value
D)
Is an unbiased estimator of
)
E) All of the above statements are true.
Question
Let  be a random sample from a normal population with mean
  and variance
  be a random sample from a normal population with mean
  and that X and Y samples are independent of one another. Assume the sample mean values are
  and we want to test
  Which of the following statements are correct?
A) The value of the test statistic is z = 2.83
B) The value of the test statistic is z = 1.88
C)
Is rejected at the .05 level if
D)
Is rejected at the .05 level if
E) None of the above statements are correct.
be a random sample from a normal population with mean and variance be a random sample from a normal population with mean and that X and Y samples are independent of one another. Assume the sample mean values are and we want to test Which of the following statements are correct?A) The value of the test statistic is z = 2.83
B) The value of the test statistic is z = 1.88
C)
Is rejected at the .05 level if
D)
Is rejected at the .05 level if
E) None of the above statements are correct.
Question
Question
Two independent samples of sizes m and n and variances  are selected at random from two normal distributions with variances
  In testing
  where the test statistic value is
  the rejection region for a level .05 test is either
are selected at random from two normal distributions with variances In testing where the test statistic value is the rejection region for a level .05 test is either Question
Suppose  are true mean stopping distances at 50 mph for cars of a certain type equipped with two different types of braking systems. Use the two-sample
  test at significance level .01 to test
  for the following statistics:
are true mean stopping distances at 50 mph for cars of a certain type equipped with two different types of braking systems. Use the two-sample test at significance level .01 to test for the following statistics: Question
Let 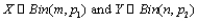 with X and Y independent variables, and let
  Which of the following statements are not correct?
A)
Is an unbiased estimator of
B) When both m and n are large, the estimator
Individually has approximately normal distributions.
C) When both m and n are large, the estimator
Has approximately a normal distribution.
D)
E) All of the above statements are correct.
with X and Y independent variables, and let Which of the following statements are not correct?A)
Is an unbiased estimator of
B) When both m and n are large, the estimator
Individually has approximately normal distributions.
C) When both m and n are large, the estimator
Has approximately a normal distribution.
D)
E) All of the above statements are correct.
Question
Let  denote two population proportions, and let
  be the sample proportions of samples of sizes 150 and 200, respectively. Then a large sample confidence interval for
  with a confidence level of approximately 99% is determined by
A)
B)
C)
D)
E)
denote two population proportions, and let be the sample proportions of samples of sizes 150 and 200, respectively. Then a large sample confidence interval for with a confidence level of approximately 99% is determined byA)
B)
C)
D)
E)
Question
Let  be a random sample from a normal distribution with variance
  be another random sample (independent of the
  from a normal distribution with variance
  denote the two sample variances. Which of the following statements are not true?
A) The random variable
Has an F distribution with parameters
B) The random variables
Each have a t distribution with m-1 and n-1 degrees of freedom, respectively.
C) The hypothesis
Is rejected if the ratio of the sample variances differs by too much from 1.
D) In testing
The rejection region for a level
E) All of the above statements are true.
be a random sample from a normal distribution with variance be another random sample (independent of the from a normal distribution with variance denote the two sample variances. Which of the following statements are not true?A) The random variable
Has an F distribution with parameters
B) The random variables
Each have a t distribution with m-1 and n-1 degrees of freedom, respectively.
C) The hypothesis
Is rejected if the ratio of the sample variances differs by too much from 1.
D) In testing
The rejection region for a level
E) All of the above statements are true.
Question
Question
Let  be a random sample from a normal distribution with variance
  be another random sample (independent of the
  from a normal distribution with variance
  denote the two sample variances. Which of the following statements are not true in testing
  where the test statistic value is
  and the test is performed at .10 level?
A) The rejection region is
B) The rejection region is
C) The rejection region is either
D) All of the above statements are true.
E) None of the above statements are true.
be a random sample from a normal distribution with variance be another random sample (independent of the from a normal distribution with variance denote the two sample variances. Which of the following statements are not true in testing where the test statistic value is and the test is performed at .10 level?A) The rejection region is
B) The rejection region is
C) The rejection region is either
D) All of the above statements are true.
E) None of the above statements are true.
Question
A study comparing different types of batteries showed that the average lifetimes of Duracell Alkaline AA batteries and Eveready Energizer Alkaline AA batteries were given as 4.5 hours and 4.2 hours, respectively. Suppose these are the population average lifetimes.
a. Let
be the sample average lifetime of 150 Duracell batteries and
be the sample average lifetime of 150 Eveready batteries. What is the mean value of
(i.e., where is the distribution of
centered)? How does your answer depend on the specified sample sizes?
b. Suppose the population standard deviations of lifetime are 1.8 hours for Duracell batteries and 2.0 hours for Eveready batteries. With the sample sizes given in part (a), what is the variance of the statistic
, and what is its standard deviation?
c. For the sample sizes given in part (a), what is the approximate distribution curve of
(include a measurement scale on the horizontal axis)? Would the shape of the curve necessarily be the same for sample sizes of 10 batteries of each type? Explain.
Question
Let  denote true average tread life for a premium brand of radial tire and let
  denote the true average tread life for an economy brand of the same size. Test
  versus
  at level .01 using the following statistics:

denote true average tread life for a premium brand of radial tire and let denote the true average tread life for an economy brand of the same size. Test versus at level .01 using the following statistics: Question
Which of the following statements are true?
A) Methods for comparing two population variances (or standard deviations) are occasionally needed, though such problems arise much less frequently than those involving means or proportions.
B) If
Are independent chi-squared random variables with
Degrees of freedom, respectively, divided by their respective degrees of freedom can be shown to have an F distribution.
C) The density curve of an F distribution is positively skewed (skewed to the right).
D) All of the above statements are true.
E) None of the above statements are true.
Question
In testing  denote the two population proportions, and both sample sizes are assumed to be large, the rejection region for approximate level .025 test is
A)
B)
C) either
D)
E)
denote the two population proportions, and both sample sizes are assumed to be large, the rejection region for approximate level .025 test isA)
B)
C) either
D)
E)
Question
In testing  denote the two population proportions, the value of the test statistic is found to be z = -1.82. Then, the P-value is
A) .9312
B) .4656
C) .0688
D) .0344
E) .9656
denote the two population proportions, the value of the test statistic is found to be z = -1.82. Then, the P-value isA) .9312
B) .4656
C) .0688
D) .0344
E) .9656
Question
Which of the following statements are not true about the F distribution with parameters 
A) The parameter
Is called the number of numerator degrees of freedom.
B) The parameter
Is called the number of denominator degrees of freedom.
C) A random variable that has an F distribution can assume a negative value; depends on the values of
D) All of the above statements are true.
E) None of the above statements are true.
Question
Which of the following statements are not necessarily true?
A) The density curve of an F distribution is not symmetric, so it would be necessary that both upper-and lower-tail critical values must be tabulated.
B)
C) There is an important connection between an F distribution and independent chi-squared random variables.
D) A random variable that has an F distribution cannot assume a negative value.
E) All of the above statements are true.
Question
Suppose  are true mean stopping distances at 50 mph for cars of a certain type equipped with two different types of braking systems. The following statistics are given: m = 6,
  Calculate a 95% CI for the difference between true average stopping distance for cars equipped with system 1 and cars equipped with system 2. Does the interval suggest that precise information about the value of this difference is available?
are true mean stopping distances at 50 mph for cars of a certain type equipped with two different types of braking systems. The following statistics are given: m = 6, Calculate a 95% CI for the difference between true average stopping distance for cars equipped with system 1 and cars equipped with system 2. Does the interval suggest that precise information about the value of this difference is available? Question
For an F distribution with parameters  is the number of numerator degrees of freedom, and
  is the number of denominator degrees of freedom, which of the following statements are true?
A)
B)
C)
D)
Can be larger than, smaller than, or equal to
E) None of the above answers are true.
is the number of numerator degrees of freedom, and is the number of denominator degrees of freedom, which of the following statements are true?A)
B)
C)
D)
Can be larger than, smaller than, or equal to
E) None of the above answers are true.
Question
In testing  is the true mean difference in paired data consisting of 12 independent pairs, the sample mean
  and sample standard deviation
  are, respectively, 7.25 and 8.25. Which of the following statements are true?
A) The value of the test statistic is z = 3.04.
B) The P-value is .0013.
C) The P-value is .0026.
D) The null hypothesis is rejected at the .01 level.
E) The null hypothesis is rejected at the .005 level.
is the true mean difference in paired data consisting of 12 independent pairs, the sample mean and sample standard deviation are, respectively, 7.25 and 8.25. Which of the following statements are true?A) The value of the test statistic is z = 3.04.
B) The P-value is .0013.
C) The P-value is .0026.
D) The null hypothesis is rejected at the .01 level.
E) The null hypothesis is rejected at the .005 level.
Question
To decide whether two different types of steel have the same true average fracture toughness values,  specimens of each type are tested, yielding the following results:
  Calculate the
  -value for the appropriate two-sample
  test, assuming that the data was based on
  = 100. Then repeat the calculation for
  = 400. Is the small p-value for
  = 400 indicative of a difference that has practical significance? Would you have been satisfied with just a report of the p-value? Comment briefly.
specimens of each type are tested, yielding the following results: Calculate the -value for the appropriate two-sample test, assuming that the data was based on = 100. Then repeat the calculation for = 400. Is the small p-value for = 400 indicative of a difference that has practical significance? Would you have been satisfied with just a report of the p-value? Comment briefly. Question
Tensile strength tests were carried out on two different grades of wire rod resulting in the accompanying data: 
a. Does the data provide compelling evidence for concluding that "true" average strength for the 1078 grade exceeds that for the 1064 grade by more than 10
? Test the appropriate hypotheses using the
-value approach.
b. Estimate the difference between true average strengths for the two grades in a way that provides information about precision and reliability.
Question
When the necessary conditions are met in testing  the two sample proportions are
  is true. Then, the value of the test statistic is
A) 10.0
B) 2.5
C) 7.5
D) 62.5
E) 0.70
the two sample proportions are is true. Then, the value of the test statistic isA) 10.0
B) 2.5
C) 7.5
D) 62.5
E) 0.70
Question
A 95% confidence interval for  the true mean difference in paired data, where
 is determined by
A) 20
2)048 (0.80)
B) 20
2)145 (3.098)
C) 20
2)131 (0.894)
D) 20
1)761 (1.118)
E) 20
1)753(1.291)
the true mean difference in paired data, where is determined byA) 20
2)048 (0.80)
B) 20
2)145 (3.098)
C) 20
2)131 (0.894)
D) 20
1)761 (1.118)
E) 20
1)753(1.291)
Question
In a study of copper deficiency in cattle, the copper values (ug Cu/100mL blood) were determined both for cattle grazing in an area known to have well-defined molybdenum anomalies (metal values in excess of the normal range of regional variation) and for cattle grazing in a nonanomalous area, resulting in  (m = 48) for the anomalous condition and
  (n = 45) for the nonanomalous condition. Test for the equality versus inequality of population variances at significance level .10 by using the P-value approach.
(m = 48) for the anomalous condition and (n = 45) for the nonanomalous condition. Test for the equality versus inequality of population variances at significance level .10 by using the P-value approach. Question
A summary data on proportional stress limits for specimens constructed using two different types of wood are shown below:  Assuming that both samples were selected from normal distributions, carry out a test of hypotheses to decide whether the true average proportional stress limit for red oak joints exceeds that for Douglas fir joints by more than one Mpa?
Assuming that both samples were selected from normal distributions, carry out a test of hypotheses to decide whether the true average proportional stress limit for red oak joints exceeds that for Douglas fir joints by more than one Mpa? Question
A study includes the accompanying data on compression strength (lb) for a sample of 12-oz aluminum cans filled with strawberry drink and another sample filled with cola. Does the data suggest that the extra carbonation of cola results in a higher average compression strength? Base your answer on a  -value. What assumptions are necessary for your analysis?
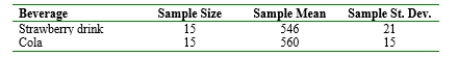
-value. What assumptions are necessary for your analysis? Question
Question
In an experiment designed to study the effects of illumination level on task performance, subjects were required to insert a fine-tipped probe into the eyeholes of ten needles in rapid succession both for a low light level with black background and a higher level with a white background. Each data value is the time (sec) required to complete the task.
Subject Compute in interval estimate for the difference between true average task time under the high illumination level and true average time under the low level.
Subject
Compute in interval estimate for the difference between true average task time under the high illumination level and true average time under the low level. Question
Consider the accompanying data on breaking load (kg/25 mm width) for various fabrics in both an unabraded condition and an abraded condition. Use the paired t test at significance level .01 to test  .
.
Fabric
.Fabric
Question
A sample of 300 urban adult residents of in Michigan revealed 63 who favored increasing the highway speed limit from 55 to 70mph, whereas a sample of 180 rural residents yielded 72 who favored the increase. Does this data indicate that the sentiment for increasing the speed limit is different for the two groups of residents? Test  using
using  , where
  refers to the urban population.
using , where refers to the urban population. Question
The sample standard deviation of sodium concentration in whole blood (mEq/L) for m = 20 marine eels was found to be  whereas the sample standard deviation of concentration for n = 20 freshwater eels was
  . Assuming normality of the two concentration distributions, test at level .10 to see whether the data suggests any difference between concentration variances for the two types of eels.
whereas the sample standard deviation of concentration for n = 20 freshwater eels was . Assuming normality of the two concentration distributions, test at level .10 to see whether the data suggests any difference between concentration variances for the two types of eels. Question
Two different types of alloy, A and B, have been used to manufacture experimental specimens of a small tension link to be used in a certain engineering application. The ultimate strength (ksi) of each specimen was determined, and the results are summarized in the accompanying frequency distribution.  Compute a 95% CI for the difference between the true proportions of all specimens of alloys A and B that have an ultimate strength of at least 34 ksi.
Compute a 95% CI for the difference between the true proportions of all specimens of alloys A and B that have an ultimate strength of at least 34 ksi. Question
Give as much information as you can about the P-value of the F test in each of the following situations:
a.
b.
c.
d.
e.
a.
b.
c.
d.
e.
Question
In an experiment designed to study the effects of illumination level on task performance, subjects were required to insert a fine-tipped probe into the eyeholes of ten needles in rapid succession both for a low light level with black background and a higher level with a white background. Each data value is the time (sec) required to complete the task.
Subject Does the data indicate that the higher level of illumination yields a decrease of more than 5 sec in
true average task completion time? Test the appropriate hypotheses using the P-value approach.
Subject
Does the data indicate that the higher level of illumination yields a decrease of more than 5 sec intrue average task completion time? Test the appropriate hypotheses using the P-value approach.
Question
A random sample of 5726 telephone numbers from a certain region taken in March 2002 yielded 1105 that were unlisted, and 1 year later a sample of 5384 yielded 980 unlisted numbers.
a. Test at level .10 to see whether there is a difference in true proportions of unlisted numbers between the two years.
b. If
what sample sizes (m = n) would be necessary to detect such a difference with probability .90?
a. Test at level .10 to see whether there is a difference in true proportions of unlisted numbers between the two years.
b. If
what sample sizes (m = n) would be necessary to detect such a difference with probability .90?
Question
Two types of fish attractors, one made from vitrified clay pipes and the other from cement blocks and brush, were used during 16 different time periods spanning 4 years at Lake Tohopekaliga, Florida The following observations are of fish caught per fishing day.  Does one attractor appear to be more effective on average than the other?
a. Use the paired t test with
b. What happens if the two-sample t test is used
Does one attractor appear to be more effective on average than the other? a. Use the paired t test with
b. What happens if the two-sample t test is used

Unlock Deck
Sign up to unlock the cards in this deck!
Unlock Deck
Unlock Deck
1/73
Play
Full screen (f)
Deck 9: Inferences Based on Two Samples
1
In testing denote the two population properties, the P-value is found to be .0715. Then at .05 level, should __________.
denote the two population properties, the P-value is found to be .0715. Then at .05 level, should __________.not be rejected
2
Let be a random sample from a normal population with mean be a random sample from a normal population with mean be a random sample from a normal population with mean =16, and that X and Y samples are independent of one another. If the sample mean values are then the value of the test statistic to test is z = __________ and that will be rejected at .01 significance level if
be a random sample from a normal population with mean be a random sample from a normal population with mean be a random sample from a normal population with mean =16, and that X and Y samples are independent of one another. If the sample mean values are then the value of the test statistic to test is z = __________ and that will be rejected at .01 significance level if -1.45, 2.58, -2.58
3
The pooled t confidence interval for estimating with confidence level using two independent samples X and Y with sizes m and n is given by __________.
with confidence level using two independent samples X and Y with sizes m and n is given by __________.
4
Provided that at least one of the sample sizes m and n of two independent samples X and Y is small, and that the corresponding populations are both normally distributed with unknown values of the population variances, then a confidence interval for the difference between the two population means, with a confidence level of is __________.
with a confidence level of is __________. Unlock Deck
Unlock for access to all 73 flashcards in this deck.
Unlock Deck
k this deck
5
A 90% confidence interval for the true mean difference in paired data consisting of n independent pairs, is determined by the formula __________.
the true mean difference in paired data consisting of n independent pairs, is determined by the formula __________. Unlock Deck
Unlock for access to all 73 flashcards in this deck.
Unlock Deck
k this deck
6
The degrees of freedom associated with the pooled t test, based on sample sizes m and n, is given by __________.
Unlock Deck
Unlock for access to all 73 flashcards in this deck.
Unlock Deck
k this deck
7
The number of degrees of freedom for a paired t test, where the data consists of n independently pairs is __________.
is __________. Unlock Deck
Unlock for access to all 73 flashcards in this deck.
Unlock Deck
k this deck
8
Let be a random sample from a population with mean be a random sample with mean and that the X and Y samples are independent of one another. The expected value of is __________ and the standard deviation of = __________.
be a random sample from a population with mean be a random sample with mean and that the X and Y samples are independent of one another. The expected value of is __________ and the standard deviation of = __________. Unlock Deck
Unlock for access to all 73 flashcards in this deck.
Unlock Deck
k this deck
9
Analogous to the notation for the point on the axis that captures __________ of the area under the F density curve with degrees of freedom in the __________ tail.
for the point on the axis that captures __________ of the area under the F density curve with degrees of freedom in the __________ tail. Unlock Deck
Unlock for access to all 73 flashcards in this deck.
Unlock Deck
k this deck
10
The weighted average of the variances of two independent samples is referred to as the __________ of (the common variance of the two population variances), and is denoted by __________.
of two independent samples is referred to as the __________ of (the common variance of the two population variances), and is denoted by __________. Unlock Deck
Unlock for access to all 73 flashcards in this deck.
Unlock Deck
k this deck
11
The rejection region for level .025 paired t test in testing is __________, where the data consists of 12 independent pairs.
is __________, where the data consists of 12 independent pairs. Unlock Deck
Unlock for access to all 73 flashcards in this deck.
Unlock Deck
k this deck
12
Let with X and Y independent variables, and let is an __________ estimator of
with X and Y independent variables, and let is an __________ estimator of Unlock Deck
Unlock for access to all 73 flashcards in this deck.
Unlock Deck
k this deck
13
Provided that the sample sizes m and n of two independent samples X and Y are both large , then a confidence interval for the difference between the two population means, with a confidence level of approximately is __________, where the values of the population variances are unknown.
with a confidence level of approximately is __________, where the values of the population variances are unknown. Unlock Deck
Unlock for access to all 73 flashcards in this deck.
Unlock Deck
k this deck
14
In testing the computed value of the test statistic is z = 2.25. The P-value for this two-tailed test is then __________.
the computed value of the test statistic is z = 2.25. The P-value for this two-tailed test is then __________. Unlock Deck
Unlock for access to all 73 flashcards in this deck.
Unlock Deck
k this deck
15
Investigators are often interested in comparing the effects of two different treatments on a response. If the individuals or subjects to be used in the comparison are not assigned by the investigators to the two treatments, the study is said to be __________. If the investigators assign individuals or subjects to the two treatments in a random fashion, this is referred to as __________.
Unlock Deck
Unlock for access to all 73 flashcards in this deck.
Unlock Deck
k this deck
16
In testing where is the true mean difference in paired data consisting of 16 independent pairs, the value of the test statistic is found to be 2.8. Then the P-value is approximately __________.
where is the true mean difference in paired data consisting of 16 independent pairs, the value of the test statistic is found to be 2.8. Then the P-value is approximately __________. Unlock Deck
Unlock for access to all 73 flashcards in this deck.
Unlock Deck
k this deck
17
The pooled t procedures are alternatives to the two-sample t procedures for situations in which not only the two population distributions are assumed to be __________ but also they have equal __________.
Unlock Deck
Unlock for access to all 73 flashcards in this deck.
Unlock Deck
k this deck
18
If are independent __________ random variables with degrees of freedom respectively, then the random variable has an F distribution.
are independent __________ random variables with degrees of freedom respectively, then the random variable has an F distribution. Unlock Deck
Unlock for access to all 73 flashcards in this deck.
Unlock Deck
k this deck
19
In testing where denote the two population proportions, the standardized variable is an estimate of the common value of and m and n are the two sample sizes, has approximately a standard normal distribution when __________.
where denote the two population proportions, the standardized variable is an estimate of the common value of and m and n are the two sample sizes, has approximately a standard normal distribution when __________. Unlock Deck
Unlock for access to all 73 flashcards in this deck.
Unlock Deck
k this deck
20
In testing denote the two population proportions, the following summary statistics are given: m = 400, x = 140, n = 500 and y = 160. Then the value of the test statistic is z = __________.
denote the two population proportions, the following summary statistics are given: m = 400, x = 140, n = 500 and y = 160. Then the value of the test statistic is z = __________. Unlock Deck
Unlock for access to all 73 flashcards in this deck.
Unlock Deck
k this deck
21
Which of the following statements are true?
A) When the alternative hypothesis is
The null hypothesis
Is considerably smaller than the null value
)
B) When the alternative hypothesis is
The null hypothesis
Is considerably larger than the null value
)
C) When the alternative hypothesis is
The null hypothesis
Is too far to either side of the null value
)
D) All of the above statements are true.
E) None of the above statements are true.
Unlock Deck
Unlock for access to all 73 flashcards in this deck.
Unlock Deck
k this deck
22
The degrees of freedom associated with the pooled t test, based on sample sizes 10 and 12 are
A) 22
B) 21
C) 20
D) 19
E) 18
A) 22
B) 21
C) 20
D) 19
E) 18
Unlock Deck
Unlock for access to all 73 flashcards in this deck.
Unlock Deck
k this deck
23
In testing the computed value of the test statistic is z = 1.98. The P-value for this two-tailed test is then
A) .4761
B) .0478
C) .0239
D) .2381
E) .2619
the computed value of the test statistic is z = 1.98. The P-value for this two-tailed test is thenA) .4761
B) .0478
C) .0239
D) .2381
E) .2619
Unlock Deck
Unlock for access to all 73 flashcards in this deck.
Unlock Deck
k this deck
24
Which of the following statements are not necessarily true about the paired t test?
A) The data consists of n independently selected pairs
B) The differences
Are assumed to be normally distributed.
C) The X and Y observations within each pair
Are independent.
D) The
Are not independent of one another.
E) All of the above statements are true.
A) The data consists of n independently selected pairs
B) The differences
Are assumed to be normally distributed.
C) The X and Y observations within each pair
Are independent.
D) The
Are not independent of one another.
E) All of the above statements are true.
Unlock Deck
Unlock for access to all 73 flashcards in this deck.
Unlock Deck
k this deck
25
In calculating 95% confidence interval for the difference between the means of two normally distributed populations, summary statistics from two independent samples are: Then, the lower limit of the confidence interval is:
A) 29.994
B) 11.587
C) 10.006
D) 10.797
E) 28.413
the difference between the means of two normally distributed populations, summary statistics from two independent samples are: Then, the lower limit of the confidence interval is:A) 29.994
B) 11.587
C) 10.006
D) 10.797
E) 28.413
Unlock Deck
Unlock for access to all 73 flashcards in this deck.
Unlock Deck
k this deck
26
Two independent samples of sizes 15 and 17 are randomly selected from two normal populations with equal variances. Which of the following distributions should be used for developing confidence intervals and for testing hypotheses about the difference between the two population means
A) The standard normal distribution
B) The t distribution with 32 degrees of freedom
C) The t distribution with 31 degrees of freedom
D) The t distribution with 30 degrees of freedom
E) Any continuous distribution since the sum of the two sample sizes exceeds 30
A) The standard normal distribution
B) The t distribution with 32 degrees of freedom
C) The t distribution with 31 degrees of freedom
D) The t distribution with 30 degrees of freedom
E) Any continuous distribution since the sum of the two sample sizes exceeds 30
Unlock Deck
Unlock for access to all 73 flashcards in this deck.
Unlock Deck
k this deck
27
At the .05 significance level, the null hypothesis is rejected in a paired t test, where the data consists of 15 independent pairs, if
A)
B)
C) either
D)
E)
is rejected in a paired t test, where the data consists of 15 independent pairs, ifA)
B)
C) either
D)
E)
Unlock Deck
Unlock for access to all 73 flashcards in this deck.
Unlock Deck
k this deck
28
In calculating 95% confidence interval for the difference between the means of two normally distributed populations, summary statistics from two independent samples are: Then, the upper limit of the confidence interval is
A) 10.953
B) 9.047
C) 9.216
D) 10.784
E) 10.0
the difference between the means of two normally distributed populations, summary statistics from two independent samples are: Then, the upper limit of the confidence interval isA) 10.953
B) 9.047
C) 9.216
D) 10.784
E) 10.0
Unlock Deck
Unlock for access to all 73 flashcards in this deck.
Unlock Deck
k this deck
29
Which of the following statements are not true if a test procedure about the difference between two population means is performed when both population distributions are normal and that the values of both population variances are known?
A) The rejection region for level
If the test is an upper-tailed test.
B) The rejection region for level
If the test is a lower-tailed test.
C) The rejection region for level
If the test is a two-tailed test.
D) All of the above statements are true.
E) None of the above statements are true.
is performed when both population distributions are normal and that the values of both population variances are known?A) The rejection region for level
If the test is an upper-tailed test.
B) The rejection region for level
If the test is a lower-tailed test.
C) The rejection region for level
If the test is a two-tailed test.
D) All of the above statements are true.
E) None of the above statements are true.
Unlock Deck
Unlock for access to all 73 flashcards in this deck.
Unlock Deck
k this deck
30
Which of the following statements are true?
A) In real problems, it is virtually always the case that the values of the population variances are unknown.
B) The two-sample t test is applicable in situations in which population distributions are both normal when population variances have unknown values, and at least one of the two sample sizes are small.
C) The pooled t test procedure is applicable if the two population distribution curves are assumed normal with equal spreads.
D) All of the above statements are true.
E) None of the above statements are true.
Unlock Deck
Unlock for access to all 73 flashcards in this deck.
Unlock Deck
k this deck
31
In testing degrees of freedom, if the test statistic value f = 4.53, then P-value = __________.
degrees of freedom, if the test statistic value f = 4.53, then P-value = __________. Unlock Deck
Unlock for access to all 73 flashcards in this deck.
Unlock Deck
k this deck
32
Let be a random sample from a normal distribution with variance be another random sample (independent of the from a normal distribution with variance denote the two sample variances. Then the random variable has an F distribution with
be a random sample from a normal distribution with variance be another random sample (independent of the from a normal distribution with variance denote the two sample variances. Then the random variable has an F distribution with Unlock Deck
Unlock for access to all 73 flashcards in this deck.
Unlock Deck
k this deck
33
Which of the following statements are not correct assumptions for developing pooled confidence intervals and for testing hypotheses about the difference between two population means
A) Both populations are normally distributed
B) The samples selected from the two populations are independent random samples.
C) At least one of the two sample sizes is small.
D) The two population variances are equal
E) The two population variances are not equal
A) Both populations are normally distributed
B) The samples selected from the two populations are independent random samples.
C) At least one of the two sample sizes is small.
D) The two population variances are equal
E) The two population variances are not equal
Unlock Deck
Unlock for access to all 73 flashcards in this deck.
Unlock Deck
k this deck
34
Which of the following statements are not true?
A) Many statisticians recommend pooled t procedures over the two-sample t procedures.
B) The pooled t test is not a likelihood ratio test, whereas the two-sample t test can be derived from the likelihood ratio principle.
C) The significance level for the pooled t test is exact.
D) The significance level for the two-sample t test is only approximate.
E) All of the above statements are true
Unlock Deck
Unlock for access to all 73 flashcards in this deck.
Unlock Deck
k this deck
35
Let be a random sample from a population with mean be a random sample from a population with mean and that the X and Y samples are independent of one another. Which of the following statements are not true?
A) The natural estimator of
B) The expected value of
C) The expected value of
D)
Is an unbiased estimator of
E) All of the above statements are true.
be a random sample from a population with mean be a random sample from a population with mean and that the X and Y samples are independent of one another. Which of the following statements are not true?A) The natural estimator of
B) The expected value of
C) The expected value of
D)
Is an unbiased estimator of
E) All of the above statements are true.
Unlock Deck
Unlock for access to all 73 flashcards in this deck.
Unlock Deck
k this deck
36
When variances of two independent samples are combined and is computed, the is referred to as
A) the pooled estimator of
B) the combined estimator of
C) the pooled estimator of the common variance
Of the two populations
D) the adjusted estimator of
E) None of the above answers are correct.
of two independent samples are combined and is computed, the is referred to asA) the pooled estimator of
B) the combined estimator of
C) the pooled estimator of the common variance
Of the two populations
D) the adjusted estimator of
E) None of the above answers are correct.
Unlock Deck
Unlock for access to all 73 flashcards in this deck.
Unlock Deck
k this deck
37
Let be a random sample from a normal population with mean and let be a random sample from a normal population with mean and that the X and Y samples are independent of one another. Which of the following statements are true?
A)
Is normally distributed with expected value
B)
Is normally distributed with expected value
C)
Is normally distributed with expected value
D)
Is an unbiased estimator of
)
E) All of the above statements are true.
be a random sample from a normal population with mean and let be a random sample from a normal population with mean and that the X and Y samples are independent of one another. Which of the following statements are true?A)
Is normally distributed with expected value
B)
Is normally distributed with expected value
C)
Is normally distributed with expected value
D)
Is an unbiased estimator of
)
E) All of the above statements are true.
Unlock Deck
Unlock for access to all 73 flashcards in this deck.
Unlock Deck
k this deck
38
Let be a random sample from a normal population with mean and variance be a random sample from a normal population with mean and that X and Y samples are independent of one another. Assume the sample mean values are and we want to test Which of the following statements are correct?
A) The value of the test statistic is z = 2.83
B) The value of the test statistic is z = 1.88
C)
Is rejected at the .05 level if
D)
Is rejected at the .05 level if
E) None of the above statements are correct.
be a random sample from a normal population with mean and variance be a random sample from a normal population with mean and that X and Y samples are independent of one another. Assume the sample mean values are and we want to test Which of the following statements are correct?A) The value of the test statistic is z = 2.83
B) The value of the test statistic is z = 1.88
C)
Is rejected at the .05 level if
D)
Is rejected at the .05 level if
E) None of the above statements are correct.
Unlock Deck
Unlock for access to all 73 flashcards in this deck.
Unlock Deck
k this deck
39
The number of degrees of freedom for a paired t test, where the data consists of 10 independent pairs, is equal to
A) 20
B) 18
C) 10
D) 9
E) 8
A) 20
B) 18
C) 10
D) 9
E) 8
Unlock Deck
Unlock for access to all 73 flashcards in this deck.
Unlock Deck
k this deck
40
Two independent samples of sizes m and n and variances are selected at random from two normal distributions with variances In testing where the test statistic value is the rejection region for a level .05 test is either
are selected at random from two normal distributions with variances In testing where the test statistic value is the rejection region for a level .05 test is either Unlock Deck
Unlock for access to all 73 flashcards in this deck.
Unlock Deck
k this deck
41
Suppose are true mean stopping distances at 50 mph for cars of a certain type equipped with two different types of braking systems. Use the two-sample test at significance level .01 to test for the following statistics:
are true mean stopping distances at 50 mph for cars of a certain type equipped with two different types of braking systems. Use the two-sample test at significance level .01 to test for the following statistics: Unlock Deck
Unlock for access to all 73 flashcards in this deck.
Unlock Deck
k this deck
42
Let with X and Y independent variables, and let Which of the following statements are not correct?
A)
Is an unbiased estimator of
B) When both m and n are large, the estimator
Individually has approximately normal distributions.
C) When both m and n are large, the estimator
Has approximately a normal distribution.
D)
E) All of the above statements are correct.
with X and Y independent variables, and let Which of the following statements are not correct?A)
Is an unbiased estimator of
B) When both m and n are large, the estimator
Individually has approximately normal distributions.
C) When both m and n are large, the estimator
Has approximately a normal distribution.
D)
E) All of the above statements are correct.
Unlock Deck
Unlock for access to all 73 flashcards in this deck.
Unlock Deck
k this deck
43
Let denote two population proportions, and let be the sample proportions of samples of sizes 150 and 200, respectively. Then a large sample confidence interval for with a confidence level of approximately 99% is determined by
A)
B)
C)
D)
E)
denote two population proportions, and let be the sample proportions of samples of sizes 150 and 200, respectively. Then a large sample confidence interval for with a confidence level of approximately 99% is determined byA)
B)
C)
D)
E)
Unlock Deck
Unlock for access to all 73 flashcards in this deck.
Unlock Deck
k this deck
44
Let be a random sample from a normal distribution with variance be another random sample (independent of the from a normal distribution with variance denote the two sample variances. Which of the following statements are not true?
A) The random variable
Has an F distribution with parameters
B) The random variables
Each have a t distribution with m-1 and n-1 degrees of freedom, respectively.
C) The hypothesis
Is rejected if the ratio of the sample variances differs by too much from 1.
D) In testing
The rejection region for a level
E) All of the above statements are true.
be a random sample from a normal distribution with variance be another random sample (independent of the from a normal distribution with variance denote the two sample variances. Which of the following statements are not true?A) The random variable
Has an F distribution with parameters
B) The random variables
Each have a t distribution with m-1 and n-1 degrees of freedom, respectively.
C) The hypothesis
Is rejected if the ratio of the sample variances differs by too much from 1.
D) In testing
The rejection region for a level
E) All of the above statements are true.
Unlock Deck
Unlock for access to all 73 flashcards in this deck.
Unlock Deck
k this deck
45
Which of the following statements are true?
A) Whenever there is positive dependence within pairs, the denominator for the paired t statistic should be smaller than for t of the independent-samples test.
B) When data is paired, the paired t confidence interval will usually be narrower than the (incorrect) two-sample t confidence interval.
C) If there is great heterogeneity between experimental units and a large correlation within experimental units, a paired experiment is preferable to an independent-samples experiment.
D) If the experimental units are relatively homogeneous and the correlation within pairs is not large, an independent-samples experiment should be used.
E) All of the above statements are true.
Unlock Deck
Unlock for access to all 73 flashcards in this deck.
Unlock Deck
k this deck
46
Let be a random sample from a normal distribution with variance be another random sample (independent of the from a normal distribution with variance denote the two sample variances. Which of the following statements are not true in testing where the test statistic value is and the test is performed at .10 level?
A) The rejection region is
B) The rejection region is
C) The rejection region is either
D) All of the above statements are true.
E) None of the above statements are true.
be a random sample from a normal distribution with variance be another random sample (independent of the from a normal distribution with variance denote the two sample variances. Which of the following statements are not true in testing where the test statistic value is and the test is performed at .10 level?A) The rejection region is
B) The rejection region is
C) The rejection region is either
D) All of the above statements are true.
E) None of the above statements are true.
Unlock Deck
Unlock for access to all 73 flashcards in this deck.
Unlock Deck
k this deck
47
A study comparing different types of batteries showed that the average lifetimes of Duracell Alkaline AA batteries and Eveready Energizer Alkaline AA batteries were given as 4.5 hours and 4.2 hours, respectively. Suppose these are the population average lifetimes.
a. Let
be the sample average lifetime of 150 Duracell batteries and
be the sample average lifetime of 150 Eveready batteries. What is the mean value of
(i.e., where is the distribution of
centered)? How does your answer depend on the specified sample sizes?
b. Suppose the population standard deviations of lifetime are 1.8 hours for Duracell batteries and 2.0 hours for Eveready batteries. With the sample sizes given in part (a), what is the variance of the statistic
, and what is its standard deviation?
c. For the sample sizes given in part (a), what is the approximate distribution curve of
(include a measurement scale on the horizontal axis)? Would the shape of the curve necessarily be the same for sample sizes of 10 batteries of each type? Explain.
a. Let
be the sample average lifetime of 150 Duracell batteries and
be the sample average lifetime of 150 Eveready batteries. What is the mean value of
(i.e., where is the distribution of
centered)? How does your answer depend on the specified sample sizes?
b. Suppose the population standard deviations of lifetime are 1.8 hours for Duracell batteries and 2.0 hours for Eveready batteries. With the sample sizes given in part (a), what is the variance of the statistic
, and what is its standard deviation?
c. For the sample sizes given in part (a), what is the approximate distribution curve of
(include a measurement scale on the horizontal axis)? Would the shape of the curve necessarily be the same for sample sizes of 10 batteries of each type? Explain.
Unlock Deck
Unlock for access to all 73 flashcards in this deck.
Unlock Deck
k this deck
48
Let denote true average tread life for a premium brand of radial tire and let denote the true average tread life for an economy brand of the same size. Test versus at level .01 using the following statistics:
denote true average tread life for a premium brand of radial tire and let denote the true average tread life for an economy brand of the same size. Test versus at level .01 using the following statistics: Unlock Deck
Unlock for access to all 73 flashcards in this deck.
Unlock Deck
k this deck
49
Which of the following statements are true?
A) Methods for comparing two population variances (or standard deviations) are occasionally needed, though such problems arise much less frequently than those involving means or proportions.
B) If
Are independent chi-squared random variables with
Degrees of freedom, respectively, divided by their respective degrees of freedom can be shown to have an F distribution.
C) The density curve of an F distribution is positively skewed (skewed to the right).
D) All of the above statements are true.
E) None of the above statements are true.
Unlock Deck
Unlock for access to all 73 flashcards in this deck.
Unlock Deck
k this deck
50
In testing denote the two population proportions, and both sample sizes are assumed to be large, the rejection region for approximate level .025 test is
A)
B)
C) either
D)
E)
denote the two population proportions, and both sample sizes are assumed to be large, the rejection region for approximate level .025 test isA)
B)
C) either
D)
E)
Unlock Deck
Unlock for access to all 73 flashcards in this deck.
Unlock Deck
k this deck
51
In testing denote the two population proportions, the value of the test statistic is found to be z = -1.82. Then, the P-value is
A) .9312
B) .4656
C) .0688
D) .0344
E) .9656
denote the two population proportions, the value of the test statistic is found to be z = -1.82. Then, the P-value isA) .9312
B) .4656
C) .0688
D) .0344
E) .9656
Unlock Deck
Unlock for access to all 73 flashcards in this deck.
Unlock Deck
k this deck
52
Which of the following statements are not true about the F distribution with parameters
A) The parameter
Is called the number of numerator degrees of freedom.
B) The parameter
Is called the number of denominator degrees of freedom.
C) A random variable that has an F distribution can assume a negative value; depends on the values of
D) All of the above statements are true.
E) None of the above statements are true.
Unlock Deck
Unlock for access to all 73 flashcards in this deck.
Unlock Deck
k this deck
53
Which of the following statements are not necessarily true?
A) The density curve of an F distribution is not symmetric, so it would be necessary that both upper-and lower-tail critical values must be tabulated.
B)
C) There is an important connection between an F distribution and independent chi-squared random variables.
D) A random variable that has an F distribution cannot assume a negative value.
E) All of the above statements are true.
A) The density curve of an F distribution is not symmetric, so it would be necessary that both upper-and lower-tail critical values must be tabulated.
B)
C) There is an important connection between an F distribution and independent chi-squared random variables.
D) A random variable that has an F distribution cannot assume a negative value.
E) All of the above statements are true.
Unlock Deck
Unlock for access to all 73 flashcards in this deck.
Unlock Deck
k this deck
54
Suppose are true mean stopping distances at 50 mph for cars of a certain type equipped with two different types of braking systems. The following statistics are given: m = 6, Calculate a 95% CI for the difference between true average stopping distance for cars equipped with system 1 and cars equipped with system 2. Does the interval suggest that precise information about the value of this difference is available?
are true mean stopping distances at 50 mph for cars of a certain type equipped with two different types of braking systems. The following statistics are given: m = 6, Calculate a 95% CI for the difference between true average stopping distance for cars equipped with system 1 and cars equipped with system 2. Does the interval suggest that precise information about the value of this difference is available? Unlock Deck
Unlock for access to all 73 flashcards in this deck.
Unlock Deck
k this deck
55
For an F distribution with parameters is the number of numerator degrees of freedom, and is the number of denominator degrees of freedom, which of the following statements are true?
A)
B)
C)
D)
Can be larger than, smaller than, or equal to
E) None of the above answers are true.
is the number of numerator degrees of freedom, and is the number of denominator degrees of freedom, which of the following statements are true?A)
B)
C)
D)
Can be larger than, smaller than, or equal to
E) None of the above answers are true.
Unlock Deck
Unlock for access to all 73 flashcards in this deck.
Unlock Deck
k this deck
56
In testing is the true mean difference in paired data consisting of 12 independent pairs, the sample mean and sample standard deviation are, respectively, 7.25 and 8.25. Which of the following statements are true?
A) The value of the test statistic is z = 3.04.
B) The P-value is .0013.
C) The P-value is .0026.
D) The null hypothesis is rejected at the .01 level.
E) The null hypothesis is rejected at the .005 level.
is the true mean difference in paired data consisting of 12 independent pairs, the sample mean and sample standard deviation are, respectively, 7.25 and 8.25. Which of the following statements are true?A) The value of the test statistic is z = 3.04.
B) The P-value is .0013.
C) The P-value is .0026.
D) The null hypothesis is rejected at the .01 level.
E) The null hypothesis is rejected at the .005 level.
Unlock Deck
Unlock for access to all 73 flashcards in this deck.
Unlock Deck
k this deck
57
To decide whether two different types of steel have the same true average fracture toughness values, specimens of each type are tested, yielding the following results: Calculate the -value for the appropriate two-sample test, assuming that the data was based on = 100. Then repeat the calculation for = 400. Is the small p-value for = 400 indicative of a difference that has practical significance? Would you have been satisfied with just a report of the p-value? Comment briefly.
specimens of each type are tested, yielding the following results: Calculate the -value for the appropriate two-sample test, assuming that the data was based on = 100. Then repeat the calculation for = 400. Is the small p-value for = 400 indicative of a difference that has practical significance? Would you have been satisfied with just a report of the p-value? Comment briefly. Unlock Deck
Unlock for access to all 73 flashcards in this deck.
Unlock Deck
k this deck
58
Tensile strength tests were carried out on two different grades of wire rod resulting in the accompanying data:
a. Does the data provide compelling evidence for concluding that "true" average strength for the 1078 grade exceeds that for the 1064 grade by more than 10
? Test the appropriate hypotheses using the
-value approach.
b. Estimate the difference between true average strengths for the two grades in a way that provides information about precision and reliability.
Unlock Deck
Unlock for access to all 73 flashcards in this deck.
Unlock Deck
k this deck
59
When the necessary conditions are met in testing the two sample proportions are is true. Then, the value of the test statistic is
A) 10.0
B) 2.5
C) 7.5
D) 62.5
E) 0.70
the two sample proportions are is true. Then, the value of the test statistic isA) 10.0
B) 2.5
C) 7.5
D) 62.5
E) 0.70
Unlock Deck
Unlock for access to all 73 flashcards in this deck.
Unlock Deck
k this deck
60
A 95% confidence interval for the true mean difference in paired data, where is determined by
A) 20
2)048 (0.80)
B) 20
2)145 (3.098)
C) 20
2)131 (0.894)
D) 20
1)761 (1.118)
E) 20
1)753(1.291)
the true mean difference in paired data, where is determined byA) 20
2)048 (0.80)
B) 20
2)145 (3.098)
C) 20
2)131 (0.894)
D) 20
1)761 (1.118)
E) 20
1)753(1.291)
Unlock Deck
Unlock for access to all 73 flashcards in this deck.
Unlock Deck
k this deck
61
In a study of copper deficiency in cattle, the copper values (ug Cu/100mL blood) were determined both for cattle grazing in an area known to have well-defined molybdenum anomalies (metal values in excess of the normal range of regional variation) and for cattle grazing in a nonanomalous area, resulting in (m = 48) for the anomalous condition and (n = 45) for the nonanomalous condition. Test for the equality versus inequality of population variances at significance level .10 by using the P-value approach.
(m = 48) for the anomalous condition and (n = 45) for the nonanomalous condition. Test for the equality versus inequality of population variances at significance level .10 by using the P-value approach. Unlock Deck
Unlock for access to all 73 flashcards in this deck.
Unlock Deck
k this deck
62
A summary data on proportional stress limits for specimens constructed using two different types of wood are shown below: Assuming that both samples were selected from normal distributions, carry out a test of hypotheses to decide whether the true average proportional stress limit for red oak joints exceeds that for Douglas fir joints by more than one Mpa?
Assuming that both samples were selected from normal distributions, carry out a test of hypotheses to decide whether the true average proportional stress limit for red oak joints exceeds that for Douglas fir joints by more than one Mpa? Unlock Deck
Unlock for access to all 73 flashcards in this deck.
Unlock Deck
k this deck
63
A study includes the accompanying data on compression strength (lb) for a sample of 12-oz aluminum cans filled with strawberry drink and another sample filled with cola. Does the data suggest that the extra carbonation of cola results in a higher average compression strength? Base your answer on a -value. What assumptions are necessary for your analysis?
-value. What assumptions are necessary for your analysis? Unlock Deck
Unlock for access to all 73 flashcards in this deck.
Unlock Deck
k this deck
64
Ionizing radiation is being given increasing attention as a method for preserving horticultural products. A study reports that 153 of 180 irradiated garlic bulbs were marketable (no external sprouting, rotting, or softening) 240 days after treatment, whereas only 117 of 180 untreated bulbs were marketable after this length of time. Does this data suggest that ionizing radiation is beneficial as far as marketability is concerned?
Unlock Deck
Unlock for access to all 73 flashcards in this deck.
Unlock Deck
k this deck
65
In an experiment designed to study the effects of illumination level on task performance, subjects were required to insert a fine-tipped probe into the eyeholes of ten needles in rapid succession both for a low light level with black background and a higher level with a white background. Each data value is the time (sec) required to complete the task.
Subject Compute in interval estimate for the difference between true average task time under the high illumination level and true average time under the low level.
Subject
Compute in interval estimate for the difference between true average task time under the high illumination level and true average time under the low level. Unlock Deck
Unlock for access to all 73 flashcards in this deck.
Unlock Deck
k this deck
66
Consider the accompanying data on breaking load (kg/25 mm width) for various fabrics in both an unabraded condition and an abraded condition. Use the paired t test at significance level .01 to test .
Fabric
.Fabric
Unlock Deck
Unlock for access to all 73 flashcards in this deck.
Unlock Deck
k this deck
67
A sample of 300 urban adult residents of in Michigan revealed 63 who favored increasing the highway speed limit from 55 to 70mph, whereas a sample of 180 rural residents yielded 72 who favored the increase. Does this data indicate that the sentiment for increasing the speed limit is different for the two groups of residents? Test using , where refers to the urban population.
using , where refers to the urban population. Unlock Deck
Unlock for access to all 73 flashcards in this deck.
Unlock Deck
k this deck
68
The sample standard deviation of sodium concentration in whole blood (mEq/L) for m = 20 marine eels was found to be whereas the sample standard deviation of concentration for n = 20 freshwater eels was . Assuming normality of the two concentration distributions, test at level .10 to see whether the data suggests any difference between concentration variances for the two types of eels.
whereas the sample standard deviation of concentration for n = 20 freshwater eels was . Assuming normality of the two concentration distributions, test at level .10 to see whether the data suggests any difference between concentration variances for the two types of eels. Unlock Deck
Unlock for access to all 73 flashcards in this deck.
Unlock Deck
k this deck
69
Two different types of alloy, A and B, have been used to manufacture experimental specimens of a small tension link to be used in a certain engineering application. The ultimate strength (ksi) of each specimen was determined, and the results are summarized in the accompanying frequency distribution. Compute a 95% CI for the difference between the true proportions of all specimens of alloys A and B that have an ultimate strength of at least 34 ksi.
Compute a 95% CI for the difference between the true proportions of all specimens of alloys A and B that have an ultimate strength of at least 34 ksi. Unlock Deck
Unlock for access to all 73 flashcards in this deck.
Unlock Deck
k this deck
70
Give as much information as you can about the P-value of the F test in each of the following situations:
a.
b.
c.
d.
e.
a.
b.
c.
d.
e.
Unlock Deck
Unlock for access to all 73 flashcards in this deck.
Unlock Deck
k this deck
71
In an experiment designed to study the effects of illumination level on task performance, subjects were required to insert a fine-tipped probe into the eyeholes of ten needles in rapid succession both for a low light level with black background and a higher level with a white background. Each data value is the time (sec) required to complete the task.
Subject Does the data indicate that the higher level of illumination yields a decrease of more than 5 sec in
true average task completion time? Test the appropriate hypotheses using the P-value approach.
Subject
Does the data indicate that the higher level of illumination yields a decrease of more than 5 sec intrue average task completion time? Test the appropriate hypotheses using the P-value approach.
Unlock Deck
Unlock for access to all 73 flashcards in this deck.
Unlock Deck
k this deck
72
A random sample of 5726 telephone numbers from a certain region taken in March 2002 yielded 1105 that were unlisted, and 1 year later a sample of 5384 yielded 980 unlisted numbers.
a. Test at level .10 to see whether there is a difference in true proportions of unlisted numbers between the two years.
b. If
what sample sizes (m = n) would be necessary to detect such a difference with probability .90?
a. Test at level .10 to see whether there is a difference in true proportions of unlisted numbers between the two years.
b. If
what sample sizes (m = n) would be necessary to detect such a difference with probability .90?
Unlock Deck
Unlock for access to all 73 flashcards in this deck.
Unlock Deck
k this deck
73
Two types of fish attractors, one made from vitrified clay pipes and the other from cement blocks and brush, were used during 16 different time periods spanning 4 years at Lake Tohopekaliga, Florida The following observations are of fish caught per fishing day. Does one attractor appear to be more effective on average than the other?
a. Use the paired t test with
b. What happens if the two-sample t test is used
Does one attractor appear to be more effective on average than the other? a. Use the paired t test with
b. What happens if the two-sample t test is used
Unlock Deck
Unlock for access to all 73 flashcards in this deck.
Unlock Deck
k this deck
Unlock Deck
Unlock for access to all 73 flashcards in this deck.


