Deck 10: Spreadsheet Models
Full screen (f)
Question
Question
Which of the following would be a likely mathematical expression for Total Variable Cost? 
A)Total Variable Cost = Production Volume × Revenue per Unit
B)Total Variable Cost = Material Cost per Unit × Labor Cost per Unit
C)Total Variable Cost = Total Cost - (Material Cost per Unit + Labor Cost per Unit)
D)Total Variable Cost = (Material Cost per Unit + Labor Cost per Unit) × Production Volume
Question
Question
Question
Question
Question
Question
Question
Which of the following would be a likely mathematical expression for Total Revenue? 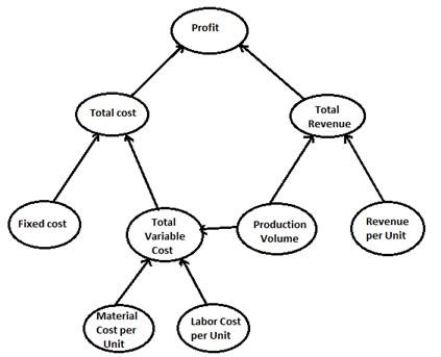
A)Total Revenue = Production Volume + Revenue per Unit
B)Total Revenue = Profit - Production Volume × Revenue per Unit
C)Total Revenue = Production Volume × Revenue per Unit
D)Total Revenue = Total Variable Cost + Production Volume + Revenue per Unit
A)Total Revenue = Production Volume + Revenue per Unit
B)Total Revenue = Profit - Production Volume × Revenue per Unit
C)Total Revenue = Production Volume × Revenue per Unit
D)Total Revenue = Total Variable Cost + Production Volume + Revenue per Unit
Question
Question
Question
Question
Question
Question
Question
Question
Question
Using the diagram below, which of the following would be a likely mathematical expression for Total Cost? 
A)Total Cost = Total Variable Cost × Fixed Cost
B)Total Cost = Fixed Cost + Total Variable Cost
C)Total Cost = Total Variable Cost + Total Revenue × Production Volume
D)Total Cost = Fixed Cost + Total Variable Cost + Production Volume
A)Total Cost = Total Variable Cost × Fixed Cost
B)Total Cost = Fixed Cost + Total Variable Cost
C)Total Cost = Total Variable Cost + Total Revenue × Production Volume
D)Total Cost = Fixed Cost + Total Variable Cost + Production Volume
Question
Question
Question
Question
Question
Question
Question
Question
Question
Question
Question
Question
Question
Question
Question
Question
Question
Question
Question
Question
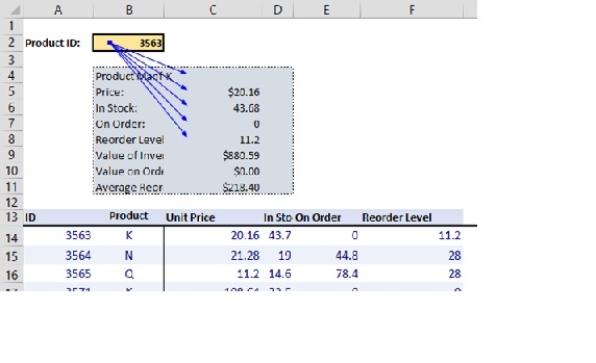
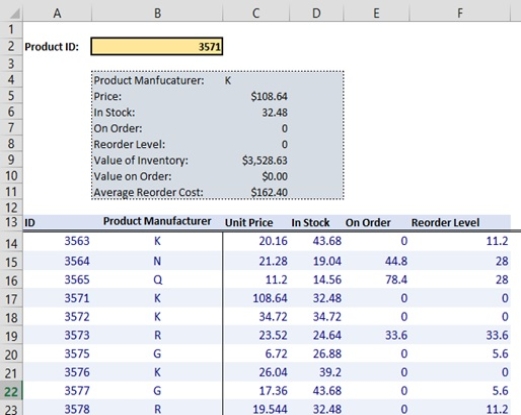
The following table is used to lookup information on a specific product. The Product ID is entered into cell B2 and the information is returned in the shaded box.There are several formulas in the table. How could I look at the cells that use the value in cell B2? 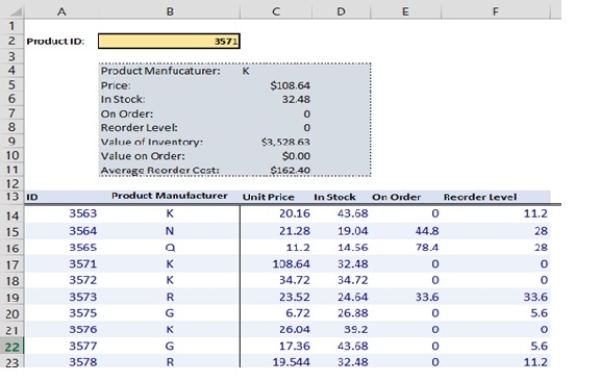
A)Select "Trace Dependents" in the Formula Auditing Group on the Formulas tab.
B)Select "Trace Precedents" in the Formula Auditing Group on the Formulas tab.
C)Select "Show Formulas" in the Formula Auditing Group on the Formulas tab.
D)Select "Evaluate Formulas" in the Formula Auditing Group on the Formulas tab.
Question
Question
Question
Question
Question
Question
Question
The average cost/unit for the production of a particular component at a manufacturing plant varies with the number of units produced in each batch. The data are given below.
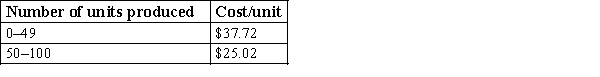
Suppose the selling price of each unit is $35.
Use a two-way data table to show how the profit changes as a function of demand and the selling price of the product. Vary the demand from 20 units to 80 units in increments of 10 units and selling price from $30 to $40 in increments of $2.
Suppose the selling price of each unit is $35.
Use a two-way data table to show how the profit changes as a function of demand and the selling price of the product. Vary the demand from 20 units to 80 units in increments of 10 units and selling price from $30 to $40 in increments of $2.
Question
Question
Question
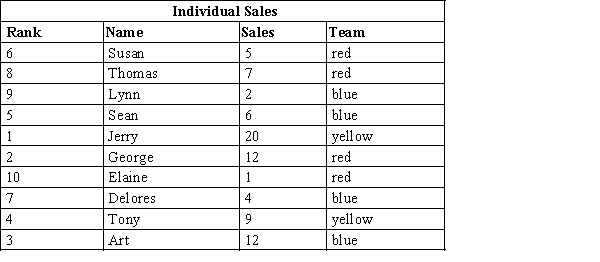
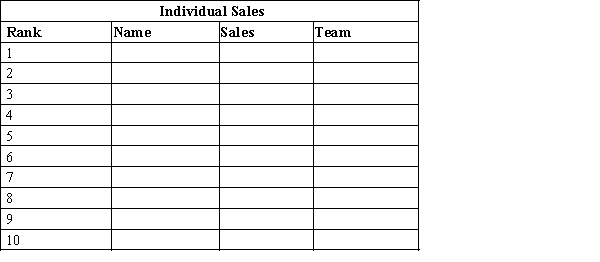
Using only "VLOOKUP", transfer all of the data from the table below into the "Individual Sales" table.
Question
Question
The following table is used to lookup information on a specific product. I chose to show the dependents of cell B2. How can I remove the arrows that are indicating the dependents?
Question
Question
Question
Given below is a sample list of 20 products in a grocery store with the product code, the price, and the associated discount rates. 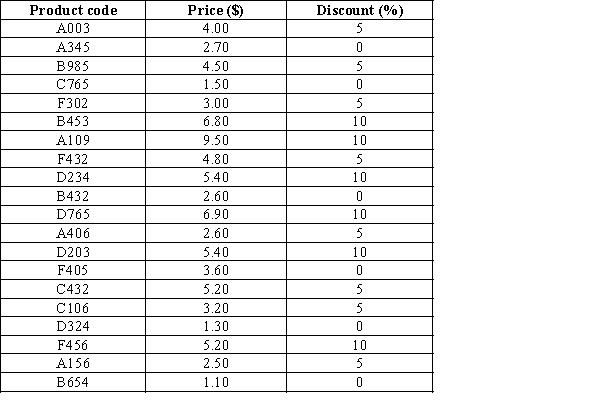
a. Display your use of the VLOOKUP function and find the price of the products A109, F432, B985, D203, C432, B654, and A345.
b. Display your use of the COUNTIF function and determine the number of products associated with each discount rate - 0%, 5%, and 10%, from the provided list.
a. Display your use of the VLOOKUP function and find the price of the products A109, F432, B985, D203, C432, B654, and A345.
b. Display your use of the COUNTIF function and determine the number of products associated with each discount rate - 0%, 5%, and 10%, from the provided list.
Question
Suppose a company supplies four of its products A, B, C, and D, to five different regions. The management wants to know the total number of all products supplied to each region as well as the total number of units of each product supplied. The data collected over a period of month are given below. 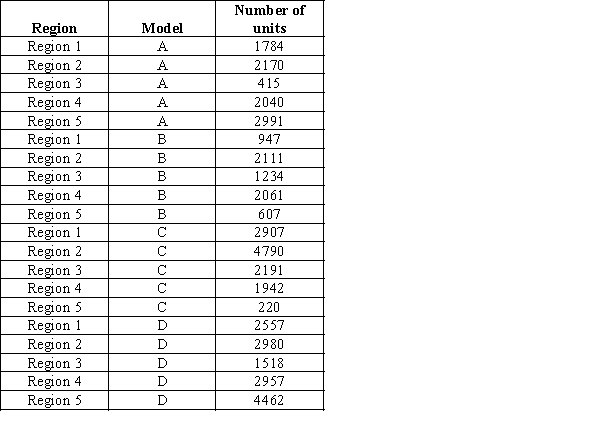
Display your use of the SUMIF function and find the total volume by each region and total volume by each product.
Display your use of the SUMIF function and find the total volume by each region and total volume by each product.
Question
The selling price of each product sold in a furnishing showroom, and the number of units of each of these product sold during a period of one month are given below. The rental cost of the showroom is $225 and the other costs incurred are included in the cost/unit. 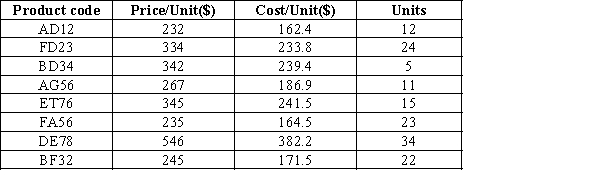 Display your use of the SUMPRODUCT function and find the profit earned by the showroom in a month.
Display your use of the SUMPRODUCT function and find the profit earned by the showroom in a month. Question
A clothing retail store offers a discount at the rate of 10% on the customer bill if the purchase exceeds $100. The owner of the store wishes to know the total amount that has been discounted on the customers' purchases on a particular day. The purchase amount for each of the 12 customers who visited the store on that day is given below. Display your use of the IF and SUM functions and calculate the total amount discounted on this single day purchases. 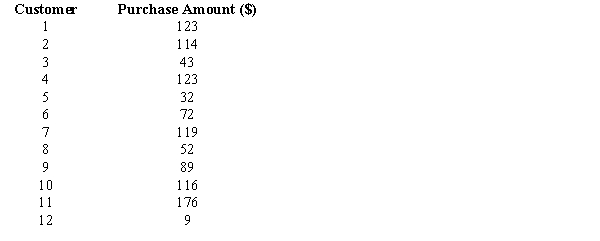
Question
Question
Question
The average cost/unit for the production of a particular component at a manufacturing plant varies with the number of units produced in each batch. The data are given below.
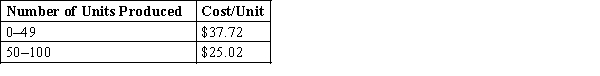
Suppose the selling price of each unit is $35.
a. Build a model to calculate the profit of the manufacturing industry if the demand is 20.
b. Construct a data table that shows the profit per unit as a function of demand if the demand ranges between 20 units through 80 units in increments of 10 units.
Question
Question
Using only "SUMIF", complete the "Team Sales".


Question
The following table is used to lookup information on a specific product. There are several formulas in the table. How could I look at all the formulas that reside in this worksheet?

Question
The following table is used to lookup information on a specific product. The Product ID is entered into the box and the information is returned in the green box. What would the lookup formula need to be in C5 to return the information for the Product named in B2.

Question
The following table is used to lookup information on a specific product. The Product ID is entered into the box and the information is returned in the green box. What would the lookup formula need to be in C8 to return the information for the Product named in B2.

Unlock Deck
Sign up to unlock the cards in this deck!
Unlock Deck
Unlock Deck
1/64
Play
Full screen (f)
Deck 10: Spreadsheet Models
1
A(n) _____________ is a visual representation that shows which entities affect others in a model.
A)decision tree diagram
B)influence diagram
C)entity chart
D)time series plot
A)decision tree diagram
B)influence diagram
C)entity chart
D)time series plot
influence diagram
2
Which of the following would be a likely mathematical expression for Total Variable Cost?
A)Total Variable Cost = Production Volume × Revenue per Unit
B)Total Variable Cost = Material Cost per Unit × Labor Cost per Unit
C)Total Variable Cost = Total Cost - (Material Cost per Unit + Labor Cost per Unit)
D)Total Variable Cost = (Material Cost per Unit + Labor Cost per Unit) × Production Volume
Total Variable Cost = (Material Cost per Unit + Labor Cost per Unit) × Production Volume
3
What do nodes in an influence diagram represent?
A)Part of the model
B)Influence levels
C)Road maps
D)Environmental factors
A)Part of the model
B)Influence levels
C)Road maps
D)Environmental factors
Part of the model
4
A(n) ____________ refers to a model input that can be controlled in a spreadsheet model.
A)decision variable
B)outlier
C)parameter
D)dummy variable
A)decision variable
B)outlier
C)parameter
D)dummy variable
Unlock Deck
Unlock for access to all 64 flashcards in this deck.
Unlock Deck
k this deck
5
Spreadsheet models are referred to as what-if models because they
A)are mathematical and logic-based models.
B)allow easy instantaneous recalculation for a change in model inputs.
C)come preloaded on computers.
D)have specialized functions to perform detailed analysis.
A)are mathematical and logic-based models.
B)allow easy instantaneous recalculation for a change in model inputs.
C)come preloaded on computers.
D)have specialized functions to perform detailed analysis.
Unlock Deck
Unlock for access to all 64 flashcards in this deck.
Unlock Deck
k this deck
6
The influence in an influence diagram is visually depicted by
A)a circular symbol.
B)an arrow.
C)a straight line.
D)the height of the influence diagram.
A)a circular symbol.
B)an arrow.
C)a straight line.
D)the height of the influence diagram.
Unlock Deck
Unlock for access to all 64 flashcards in this deck.
Unlock Deck
k this deck
7
With reference to a spreadsheet model, an uncontrollable model input is known as a(n)
A)decision variable.
B)dummy variable.
C)parameter.
D)statistic.
A)decision variable.
B)dummy variable.
C)parameter.
D)statistic.
Unlock Deck
Unlock for access to all 64 flashcards in this deck.
Unlock Deck
k this deck
8
The impact of two inputs on the output of interest is summarized by a
A)Goal Seek.
B)Watch Window.
C)multiple-way data table.
D)two-way data table.
A)Goal Seek.
B)Watch Window.
C)multiple-way data table.
D)two-way data table.
Unlock Deck
Unlock for access to all 64 flashcards in this deck.
Unlock Deck
k this deck
9
Which of the following would be a likely mathematical expression for Total Revenue?
A)Total Revenue = Production Volume + Revenue per Unit
B)Total Revenue = Profit - Production Volume × Revenue per Unit
C)Total Revenue = Production Volume × Revenue per Unit
D)Total Revenue = Total Variable Cost + Production Volume + Revenue per Unit
A)Total Revenue = Production Volume + Revenue per Unit
B)Total Revenue = Profit - Production Volume × Revenue per Unit
C)Total Revenue = Production Volume × Revenue per Unit
D)Total Revenue = Total Variable Cost + Production Volume + Revenue per Unit
Unlock Deck
Unlock for access to all 64 flashcards in this deck.
Unlock Deck
k this deck
10
A one-way data table summarizes
A)a single input's impact on the output of interest.
B)multiple inputs' impact on a single output of interest.
C)values of the input cells that will cause the single output value to equal zero.
D)values of cells when not all of the model is observable on the screen.
A)a single input's impact on the output of interest.
B)multiple inputs' impact on a single output of interest.
C)values of the input cells that will cause the single output value to equal zero.
D)values of cells when not all of the model is observable on the screen.
Unlock Deck
Unlock for access to all 64 flashcards in this deck.
Unlock Deck
k this deck
11
Which of the following design guidelines, if followed, enables the user to update the model parameters without the risk of mistakenly creating an error in a formula?
A)Separating the parameters from the spreadsheet model
B)Documenting the spreadsheet model
C)Using numbers in the spreadsheet formula
D)Using simple formulas
A)Separating the parameters from the spreadsheet model
B)Documenting the spreadsheet model
C)Using numbers in the spreadsheet formula
D)Using simple formulas
Unlock Deck
Unlock for access to all 64 flashcards in this deck.
Unlock Deck
k this deck
12
The modeling process begins with the framing of a ______________ that shows the relationships between the various parts of the problem being modeled.
A)mathematical model
B)conceptual model
C)circular model
D)correlation model
A)mathematical model
B)conceptual model
C)circular model
D)correlation model
Unlock Deck
Unlock for access to all 64 flashcards in this deck.
Unlock Deck
k this deck
13
In _______________ decision making companies have to decide whether they should manufacture a product or outsource its production to another firm.
A)goal seek
B)two-way
C)voting-based
D)make-versus-buy
A)goal seek
B)two-way
C)voting-based
D)make-versus-buy
Unlock Deck
Unlock for access to all 64 flashcards in this deck.
Unlock Deck
k this deck
14
Which of the following is true of spreadsheet packages used in business analytics?
A)They are more expensive than specialized packages.
B)They require substantial user training.
C)They come preloaded on computers.
D)They do not have specialized functions to perform detailed analyses.
A)They are more expensive than specialized packages.
B)They require substantial user training.
C)They come preloaded on computers.
D)They do not have specialized functions to perform detailed analyses.
Unlock Deck
Unlock for access to all 64 flashcards in this deck.
Unlock Deck
k this deck
15
Navigation in a spreadsheet model can be facilitated by
A)using different spreadsheets for each formula in the model.
B)using long calculations in the cells.
C)using clear labels and proper formatting and alignment.
D)referencing data by using hyperlinks to the problem statement.
A)using different spreadsheets for each formula in the model.
B)using long calculations in the cells.
C)using clear labels and proper formatting and alignment.
D)referencing data by using hyperlinks to the problem statement.
Unlock Deck
Unlock for access to all 64 flashcards in this deck.
Unlock Deck
k this deck
16
The conceptual model
A)helps in organizing the data requirements.
B)controls the model inputs.
C)has tools defined to identify the optimal solution.
D)explores the effects of changing model parameters.
A)helps in organizing the data requirements.
B)controls the model inputs.
C)has tools defined to identify the optimal solution.
D)explores the effects of changing model parameters.
Unlock Deck
Unlock for access to all 64 flashcards in this deck.
Unlock Deck
k this deck
17
Which of the following approaches is a good way to proceed with the influence diagram building for a problem?
A)The influence diagram for the entire problem is build first and then separate portions are clustered to form separate models.
B)The influence diagram for all the model parts at the same level are built in parallel to reduce the likelihood of error.
C)The influence diagram is reverse engineered -the diagram is developed in the opposite direction starting with the model output.
D)The influence diagram for a portion of the problem is built first and then expanded until the total problem is conceptually modeled.
Unlock Deck
Unlock for access to all 64 flashcards in this deck.
Unlock Deck
k this deck
18
Using the diagram below, which of the following would be a likely mathematical expression for Total Cost?
A)Total Cost = Total Variable Cost × Fixed Cost
B)Total Cost = Fixed Cost + Total Variable Cost
C)Total Cost = Total Variable Cost + Total Revenue × Production Volume
D)Total Cost = Fixed Cost + Total Variable Cost + Production Volume
A)Total Cost = Total Variable Cost × Fixed Cost
B)Total Cost = Fixed Cost + Total Variable Cost
C)Total Cost = Total Variable Cost + Total Revenue × Production Volume
D)Total Cost = Fixed Cost + Total Variable Cost + Production Volume
Unlock Deck
Unlock for access to all 64 flashcards in this deck.
Unlock Deck
k this deck
19
Excel's _____________ tool allows the user to determine the value of an input cell that will cause the value of a related output cell to equal some specified value.
A)Goal Seek
B)Watch Window
C)Data Validation
D)XLMiner
A)Goal Seek
B)Watch Window
C)Data Validation
D)XLMiner
Unlock Deck
Unlock for access to all 64 flashcards in this deck.
Unlock Deck
k this deck
20
An Excel _________________ quantifies the impact of changing the value of a specific input on an output of interest.
A)Watch Window
B)Data Table
C)Goal Seek
D)Chart
A)Watch Window
B)Data Table
C)Goal Seek
D)Chart
Unlock Deck
Unlock for access to all 64 flashcards in this deck.
Unlock Deck
k this deck
21
Which of the following tools provides an excellent means of identifying the exact location of an error in a formula?
A)Error Checking
B)Function Library
C)Show Formulas
D)Evaluate Formula
A)Error Checking
B)Function Library
C)Show Formulas
D)Evaluate Formula
Unlock Deck
Unlock for access to all 64 flashcards in this deck.
Unlock Deck
k this deck
22
Within a given range of cells, the number of times a particular condition is satisfied is computed by using the ________ function.
A)SUMIF
B)IF
C)VLOOKUP
D)COUNTIF
A)SUMIF
B)IF
C)VLOOKUP
D)COUNTIF
Unlock Deck
Unlock for access to all 64 flashcards in this deck.
Unlock Deck
k this deck
23
The ____________ button, located in the Formula Auditing group, creates arrows pointing to the selected cell from cells that are part of the formula in that cell.
A)Trace Dependents
B)Trace Precedents
C)Error Checking
D)Watch Window
A)Trace Dependents
B)Trace Precedents
C)Error Checking
D)Watch Window
Unlock Deck
Unlock for access to all 64 flashcards in this deck.
Unlock Deck
k this deck
24
Excel searches for an exact match of the first argument in the first column of the data when the range in the VLOOKUP function is
A)TRUE.
B)NULL.
C)FALSE.
D)EXACT.
A)TRUE.
B)NULL.
C)FALSE.
D)EXACT.
Unlock Deck
Unlock for access to all 64 flashcards in this deck.
Unlock Deck
k this deck
25
The _____________ button provides an automatic means of checking for mathematical errors within formulas of a worksheet.
A)Error Checking
B)Trace Precedents
C)Watch Window
D)Math & Trig
A)Error Checking
B)Trace Precedents
C)Watch Window
D)Math & Trig
Unlock Deck
Unlock for access to all 64 flashcards in this deck.
Unlock Deck
k this deck
26
The calculations of a cell can be investigated in great detail by using the ___________ button.
A)Calculation Options
B)Evaluate Formula
C)Error Checking
D)Show Formulas
A)Calculation Options
B)Evaluate Formula
C)Error Checking
D)Show Formulas
Unlock Deck
Unlock for access to all 64 flashcards in this deck.
Unlock Deck
k this deck
27
Arrows pointing from the selected cell to cells that depend on the selected cell are generated by using the ___________ button of the Formula Auditing group.
A)Error Checking
B)Trace Precedents
C)Trace Dependents
D)Watch Window
A)Error Checking
B)Trace Precedents
C)Trace Dependents
D)Watch Window
Unlock Deck
Unlock for access to all 64 flashcards in this deck.
Unlock Deck
k this deck
28
With reference to the SUMPRODUCT function, which of the following statements is true?
A)The range of cells for each array must contain only nonzero values.
B)Any cell that does not satisfy the specified given condition or criteria will not be considered.
C)The array appearing as the first argument must be sorted in ascending order.
D)The arrays that appear as arguments must be of the same dimension.
Unlock Deck
Unlock for access to all 64 flashcards in this deck.
Unlock Deck
k this deck
29
The ________ function allows the user to pull a subset of data from a larger table of data based on some criterion.
A)VLOOKUP
B)IF
C)SUMIF
D)COUNTIF
A)VLOOKUP
B)IF
C)SUMIF
D)COUNTIF
Unlock Deck
Unlock for access to all 64 flashcards in this deck.
Unlock Deck
k this deck
30
The ____________ button in the Formula Auditing group allows the user to inspect each formula in detail in its cell location.
A)Evaluate Formula
B)Error Checking
C)Watch Window
D)Show Formulas
A)Evaluate Formula
B)Error Checking
C)Watch Window
D)Show Formulas
Unlock Deck
Unlock for access to all 64 flashcards in this deck.
Unlock Deck
k this deck
31
The __________ function is used for the conditional computation of expressions in Excel.
A)EFFECT
B)IF
C)FALSE
D)NOT
A)EFFECT
B)IF
C)FALSE
D)NOT
Unlock Deck
Unlock for access to all 64 flashcards in this deck.
Unlock Deck
k this deck
32
The _________ function pairs each element of the first array with its counterpart in the second array, multiplies the elements of the pairs together, and adds the results.
A)SUM
B)SUMPRODUCT
C)SUMIF
D)VLOOKUP
A)SUM
B)SUMPRODUCT
C)SUMIF
D)VLOOKUP
Unlock Deck
Unlock for access to all 64 flashcards in this deck.
Unlock Deck
k this deck
33
The function of Trace Precedents and Trace Dependents is to
A)highlight errors in copying and formula construction.
B)ascertain how model parts are segregated.
C)trace the range of cells included in the Watch Window box list.
D)investigate the cell calculations in great detail.
A)highlight errors in copying and formula construction.
B)ascertain how model parts are segregated.
C)trace the range of cells included in the Watch Window box list.
D)investigate the cell calculations in great detail.
Unlock Deck
Unlock for access to all 64 flashcards in this deck.
Unlock Deck
k this deck
34
The condition that VLOOKUP assumes is that
A)there are no nonzero values in the range.
B)all the arguments are of the same dimension.
C)the first column of the table is sorted in ascending order.
D)the columns with empty cells are to be neglected.
A)there are no nonzero values in the range.
B)all the arguments are of the same dimension.
C)the first column of the table is sorted in ascending order.
D)the columns with empty cells are to be neglected.
Unlock Deck
Unlock for access to all 64 flashcards in this deck.
Unlock Deck
k this deck
35
The arguments supplied to the IF function, in order, are the condition for execution,
A)the result if condition is true, and the result if condition is false.
B)and the range of cells to test.
C)the array1 of data cells to test, and the array2 of data cells to output.
D)the result if condition is false, and the result if condition is true.
A)the result if condition is true, and the result if condition is false.
B)and the range of cells to test.
C)the array1 of data cells to test, and the array2 of data cells to output.
D)the result if condition is false, and the result if condition is true.
Unlock Deck
Unlock for access to all 64 flashcards in this deck.
Unlock Deck
k this deck
36
The SUM function in Excel
A)adds up all the numbers in the cells diagonally.
B)adds up only positive numbers in a range of cells.
C)adds up all the numbers in a range of cells.
D)adds up the cells specified by a given condition or criteria.
A)adds up all the numbers in the cells diagonally.
B)adds up only positive numbers in a range of cells.
C)adds up all the numbers in a range of cells.
D)adds up the cells specified by a given condition or criteria.
Unlock Deck
Unlock for access to all 64 flashcards in this deck.
Unlock Deck
k this deck
37
The Watch Window is observable
A)only when the complete model is observable on the screen.
B)only in the same worksheet of a workbook.
C)across different worksheets of a workbook.
D)across different workbooks in the same folder.
A)only when the complete model is observable on the screen.
B)only in the same worksheet of a workbook.
C)across different worksheets of a workbook.
D)across different workbooks in the same folder.
Unlock Deck
Unlock for access to all 64 flashcards in this deck.
Unlock Deck
k this deck
38
The following table is used to lookup information on a specific product. The Product ID is entered into cell B2 and the information is returned in the shaded box.There are several formulas in the table. How could I look at the cells that use the value in cell B2?
A)Select "Trace Dependents" in the Formula Auditing Group on the Formulas tab.
B)Select "Trace Precedents" in the Formula Auditing Group on the Formulas tab.
C)Select "Show Formulas" in the Formula Auditing Group on the Formulas tab.
D)Select "Evaluate Formulas" in the Formula Auditing Group on the Formulas tab.
Unlock Deck
Unlock for access to all 64 flashcards in this deck.
Unlock Deck
k this deck
39
The user can monitor how listed cells change with a change in the model without searching through the worksheet or changing from one worksheet to another by using the ______________ functionality.
A)Goal Seek
B)Evaluate Formula
C)Watch Window
D)Trial-and-error
A)Goal Seek
B)Evaluate Formula
C)Watch Window
D)Trial-and-error
Unlock Deck
Unlock for access to all 64 flashcards in this deck.
Unlock Deck
k this deck
40
The VLOOKUP with range set to _________ takes the first argument and searches the first column of the table for the last row that is strictly less than the first argument.
A)FALSE
B)TRUE
C)LESS
D)NULL
A)FALSE
B)TRUE
C)LESS
D)NULL
Unlock Deck
Unlock for access to all 64 flashcards in this deck.
Unlock Deck
k this deck
41
A company asked one of their analysis team to analyze and create models that help decide whether they should manufacture a particular product or outsource its production. The different components are given below.
Fixed Cost, FC = $25,000
Material Cost per Unit, MC = $2.15
Labor Cost per Unit, LC = $2.00
Outsourcing Cost per Unit, O = $4.50
a. Build a spreadsheet model and then construct a one-way data table with production volume as the column input and savings due to outsourcing as the output. Breakeven occurs when savings equal zero. Vary production volume from 0 to 100,000 in increments of 10,000. In which interval of production volume does breakeven occur?
b. Using the appropriate Excel tool, find the exact breakeven point.
Unlock Deck
Unlock for access to all 64 flashcards in this deck.
Unlock Deck
k this deck
42
Anna operates a consignment shop where she sells cloths for women and children. The average consignments sold per month is 1000. The average material cost and the selling price of each consignment is $8 and $20, respectively.
The monthly fixed cost to run this business is given below:
Rental cost: $750
Utilities: $150
Advertising: $35
Insurance: $100
Labor cost: $4000
Use a two-way data table to show profit changes as a function of different number of consignments sold per month and different material costs. Vary the number of consignments from 400 to 1200 in increments of 100. The eight different material costs are $5.45, $6.23, $6.95, $7.54, $8.23, $8.88, $9, and $9.45.
Unlock Deck
Unlock for access to all 64 flashcards in this deck.
Unlock Deck
k this deck
43
A company asked one of their analysis team to analyze and create models that help decide whether they should manufacture a particular product or outsource its production. The different components are given below.
Fixed Cost, FC = $25,000
Material Cost per Unit, MC = $2.15
Labor Cost per Unit, LC = $2.00
Outsourcing Cost per Unit, O = $4.50
Build a spreadsheet model and then use a two-way data table to show how the savings due to outsourcing changes as a function of different production volume and different bids on per-unit cost for outsourcing. Vary the production volume from 0 to 100,000 in increments of 10,000. The six bids are $3.11, $3.49, $4.50, $4.98, $5.12, and $5.45.
Unlock Deck
Unlock for access to all 64 flashcards in this deck.
Unlock Deck
k this deck
44
Anna operates a consignment shop where she sells clothes for women and children. The average consignments sold per month is 1000. The average material cost and the selling price of each consignment is $8 and $20, respectively.
The monthly fixed cost to run this business is given below:
Rental cost: $750
Utilities: $150
Advertising: $35
Insurance: $100
Labor cost: $4000
a. Build an influence diagram that illustrates how to calculate profit.
b. Using mathematical notation, give a mathematical model for calculating profit.
c. Implement your model from part (b) in Excel using the principles of good spreadsheet design.
Unlock Deck
Unlock for access to all 64 flashcards in this deck.
Unlock Deck
k this deck
45
The average cost/unit for the production of a particular component at a manufacturing plant varies with the number of units produced in each batch. The data are given below.
Suppose the selling price of each unit is $35.
Use a two-way data table to show how the profit changes as a function of demand and the selling price of the product. Vary the demand from 20 units to 80 units in increments of 10 units and selling price from $30 to $40 in increments of $2.
Suppose the selling price of each unit is $35.
Use a two-way data table to show how the profit changes as a function of demand and the selling price of the product. Vary the demand from 20 units to 80 units in increments of 10 units and selling price from $30 to $40 in increments of $2.
Unlock Deck
Unlock for access to all 64 flashcards in this deck.
Unlock Deck
k this deck
46
The Gatson manufacturing company has estimated the following components for a new product.
Fixed cost = $50,000
Material cost per unit = $2.15
Labor cost per unit = $2.00
Revenue per unit = $7.50
a. Construct a spreadsheet model and then construct a one-way data table with production volume as the column input and profit as the output. Breakeven occurs when profit is zero. Vary production volume from 0 to 100,000 in increments of 10,000. In which interval of production volume does breakeven occur?
b. Using the appropriate Excel tool, find the exact breakeven point.
Unlock Deck
Unlock for access to all 64 flashcards in this deck.
Unlock Deck
k this deck
47
John would like to establish a retirement plan that returns an amount of $100,000 in 20 years. Build a spreadsheet model to calculate the amount John must contribute at the end of each year towards his retirement fund, assuming an annual interest rate of 6%.
Use the Excel function
=PMT(rate, nper, pv, fv, type)
The arguments of this function are
rate = the interest rate for the loan
nper = the total number of payments
pv = present value (the amount borrowed which is 0 in this case)
fv = future value (in the formula, indicate this value as negative as the future value command assumes a stream of payments not deposits)
type = payment type (0 = end of period, 1 = beginning of the period)
Also, construct a one-way table with interest rate as the column variable and the amount contributed at the end of each year as the output. Vary the interest rate from 4% to 7% in increments of 0.5%.
Unlock Deck
Unlock for access to all 64 flashcards in this deck.
Unlock Deck
k this deck
48
Using only "VLOOKUP", transfer all of the data from the table below into the "Individual Sales" table.
Unlock Deck
Unlock for access to all 64 flashcards in this deck.
Unlock Deck
k this deck
49
An electronics store sells two models of television. The sales of these two models, X and Y, are dependent, that is, if the price of one increases, the demand for the other increases. A study is made to find the relationship between the demand (D) and the price (P) in order to maximize the revenue from these products. The result of the study is shown below.
DX = 476 - 0.54 PX + 0.22 PY
DY = 601 + 0.12 PX - 0.54 PY
a. Construct a model for the total revenue and implement it on a spreadsheet.
b. Develop a two-way data table to estimate the optimal prices of each of the two products in order to maximize the total revenue. Vary price of each product from $600 to $900 in increments of $50.
Unlock Deck
Unlock for access to all 64 flashcards in this deck.
Unlock Deck
k this deck
50
The following table is used to lookup information on a specific product. I chose to show the dependents of cell B2. How can I remove the arrows that are indicating the dependents?
Unlock Deck
Unlock for access to all 64 flashcards in this deck.
Unlock Deck
k this deck
51
The Gatson manufacturing company has estimated the following components for a new product.
Fixed cost = $50,000
Material cost per unit = $2.15
Labor cost per unit = $2.00
Revenue per unit = $7.50
a. Build an influence diagram that illustrates how to calculate profit.
b. Using mathematical notation, construct a mathematical model for calculating profit.
c. Implement your model from part (b) in an Excel spreadsheet model using the principles of good spreadsheet design.
d. Using the spreadsheet model, what will be the resulting profit if the company decides to make 70,000 units of the new product?
Unlock Deck
Unlock for access to all 64 flashcards in this deck.
Unlock Deck
k this deck
52
Anna operates a consignment shop where she sells cloths for women and children. The average consignments sold per month is 1000. The average material cost and the selling price of each consignment is $8 and $20, respectively.
The monthly fixed cost to run this business is given below:
Rental cost: $750
Utilities: $150
Advertising: $35
Insurance: $100
Labor cost: $4000
a. Using a spreadsheet model, construct a one-way data table with number of consignments sold per month as the column input and profit as the output. Breakeven occurs when profit goes from a negative to a positive value. Vary the number of consignments sold per month from 400 to 1200 in increments of 100. In which interval does breakeven occur?
b. Use the appropriate Excel tool to find the exact breakeven point
Unlock Deck
Unlock for access to all 64 flashcards in this deck.
Unlock Deck
k this deck
53
Given below is a sample list of 20 products in a grocery store with the product code, the price, and the associated discount rates.
a. Display your use of the VLOOKUP function and find the price of the products A109, F432, B985, D203, C432, B654, and A345.
b. Display your use of the COUNTIF function and determine the number of products associated with each discount rate - 0%, 5%, and 10%, from the provided list.
a. Display your use of the VLOOKUP function and find the price of the products A109, F432, B985, D203, C432, B654, and A345.
b. Display your use of the COUNTIF function and determine the number of products associated with each discount rate - 0%, 5%, and 10%, from the provided list.
Unlock Deck
Unlock for access to all 64 flashcards in this deck.
Unlock Deck
k this deck
54
Suppose a company supplies four of its products A, B, C, and D, to five different regions. The management wants to know the total number of all products supplied to each region as well as the total number of units of each product supplied. The data collected over a period of month are given below.
Display your use of the SUMIF function and find the total volume by each region and total volume by each product.
Display your use of the SUMIF function and find the total volume by each region and total volume by each product.
Unlock Deck
Unlock for access to all 64 flashcards in this deck.
Unlock Deck
k this deck
55
The selling price of each product sold in a furnishing showroom, and the number of units of each of these product sold during a period of one month are given below. The rental cost of the showroom is $225 and the other costs incurred are included in the cost/unit. Display your use of the SUMPRODUCT function and find the profit earned by the showroom in a month.
Display your use of the SUMPRODUCT function and find the profit earned by the showroom in a month. Unlock Deck
Unlock for access to all 64 flashcards in this deck.
Unlock Deck
k this deck
56
A clothing retail store offers a discount at the rate of 10% on the customer bill if the purchase exceeds $100. The owner of the store wishes to know the total amount that has been discounted on the customers' purchases on a particular day. The purchase amount for each of the 12 customers who visited the store on that day is given below. Display your use of the IF and SUM functions and calculate the total amount discounted on this single day purchases.
Unlock Deck
Unlock for access to all 64 flashcards in this deck.
Unlock Deck
k this deck
57
The Gatson manufacturing company has estimated the following components for a new product.
Fixed cost = $50,000
Material cost per unit = $2.15
Labor cost per unit = $2.00
Revenue per unit = $7.50
Construct a spreadsheet model and then use use a two-way data table to show how the profit changes as a function of different production volumes and different values of material cost per unit. Vary the production volume from 0 to 100,000 in increments of 10,000. The five different material costs are $1.50, $1.95, $2.15, $2.85, and $3.25.
Unlock Deck
Unlock for access to all 64 flashcards in this deck.
Unlock Deck
k this deck
58
A company asked one of their analysis team to analyze and create models that help decide whether they should manufacture a particular product or outsource its production. The different components are given below.
Fixed Cost, FC = $25,000
Material Cost per Unit, MC = $2.15
Labor Cost per Unit, LC = $2.00
Outsourcing Cost per Unit, O = $4.50
a. Build an influence diagram that illustrates how to calculate the difference in cost of manufacturing and outsourcing.
b. Using mathematical notation, construct a mathematical model for calculating the difference in cost of manufacturing and outsourcing.
c. Implement your model from part (b) in an Excel spreadsheet model using the principles of good spreadsheet design.
d. Using the spreadsheet model, what will be the resulting savings due to outsourcing if the company wants to make 30,000 units of a particular product?
Unlock Deck
Unlock for access to all 64 flashcards in this deck.
Unlock Deck
k this deck
59
The average cost/unit for the production of a particular component at a manufacturing plant varies with the number of units produced in each batch. The data are given below.
Suppose the selling price of each unit is $35.
a. Build a model to calculate the profit of the manufacturing industry if the demand is 20.
b. Construct a data table that shows the profit per unit as a function of demand if the demand ranges between 20 units through 80 units in increments of 10 units.
Unlock Deck
Unlock for access to all 64 flashcards in this deck.
Unlock Deck
k this deck
60
Suppose you have $1100 and decide to purchase a new model of television that costs you $1100. You find an electronics store where a gift voucher, worth $50, is offered for this TV model if payment is made in full at the time of purchase. Alternatively, it can be financed at zero-percent (0%) interest for 5 months with a monthly payment of $220. You now have two options: either opt for the zero-percent financing option for the full amount and invest your money at an annual interest rate of 10%; or choose the full payment option with the $50 discount. Develop a spreadsheet model to find the better option that results in the most savings. Also, find the discount rate for zero-percent financing option.
Hint: Use Goal Seek to find the discount rate that makes the net present value of the payments = $1050.
Hint: Use Goal Seek to find the discount rate that makes the net present value of the payments = $1050.
Unlock Deck
Unlock for access to all 64 flashcards in this deck.
Unlock Deck
k this deck
61
Using only "SUMIF", complete the "Team Sales".
Unlock Deck
Unlock for access to all 64 flashcards in this deck.
Unlock Deck
k this deck
62
The following table is used to lookup information on a specific product. There are several formulas in the table. How could I look at all the formulas that reside in this worksheet?
Unlock Deck
Unlock for access to all 64 flashcards in this deck.
Unlock Deck
k this deck
63
The following table is used to lookup information on a specific product. The Product ID is entered into the box and the information is returned in the green box. What would the lookup formula need to be in C5 to return the information for the Product named in B2.
Unlock Deck
Unlock for access to all 64 flashcards in this deck.
Unlock Deck
k this deck
64
The following table is used to lookup information on a specific product. The Product ID is entered into the box and the information is returned in the green box. What would the lookup formula need to be in C8 to return the information for the Product named in B2.
Unlock Deck
Unlock for access to all 64 flashcards in this deck.
Unlock Deck
k this deck
Unlock Deck
Unlock for access to all 64 flashcards in this deck.


