Deck 7: Business Statistics
Full screen (f)
Question
Question
Question
Question
Question
Question
Question
Question
Question
Question
Question
Question
Question
Question
Question
Question
Question
Question
Question
Question
Question
Question
Question
Question
Question
Question
Question
Question
Question
Question
Question
Question
Question
Question
Question
Question
Question
Question
Question
Question
Question
Question
Question
Question
Question
Question
Question
Question
Question
Question
Question
Question
Question
Question
Question
Question
Question
Question
Question
Question
Question
Question
Question
Use this graph to answer the question
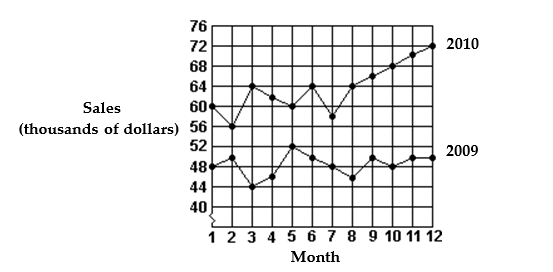
-Which month in 2010 had the lowest sales?
A) Month 7
B) Month 12
C) Month 2
D) Month 3
-Which month in 2010 had the lowest sales?
A) Month 7
B) Month 12
C) Month 2
D) Month 3
Question
Question
Question
Question
Question
Question
Question
Question
Question
Use the graph to determine how many hours were needed to prepare for Test 2. 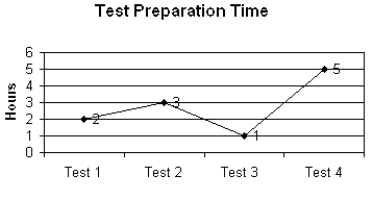
A) 5
B) 2
C) 3
D) 1
A) 5
B) 2
C) 3
D) 1
Question
Question
Question
Question
Question
Question
Question
Question

Unlock Deck
Sign up to unlock the cards in this deck!
Unlock Deck
Unlock Deck
1/93
Play
Full screen (f)
Deck 7: Business Statistics
1
A common mistake when making conclusions or inferences from statistical measures is to examine only one statistic.
True
2
A visual aid that is divided into two or more sections to illustrate how partial data relates to th? whole is a:
A) circle graph
B) range graph
C) line graph
D) bar graph
A) circle graph
B) range graph
C) line graph
D) bar graph
A
3
In constructing a circle graph, the circle represents 360% of whatever quantity the graph represents.
False
4
A circle graph is divided into two or more sections to give a visual picture of how some whole quantity is being divided.
Unlock Deck
Unlock for access to all 93 flashcards in this deck.
Unlock Deck
k this deck
5
In a normal distribution, 95% of the data will fall within three standard deviations of the mean.
Unlock Deck
Unlock for access to all 93 flashcards in this deck.
Unlock Deck
k this deck
6
A circle graph consists of 480 degrees.
Unlock Deck
Unlock for access to all 93 flashcards in this deck.
Unlock Deck
k this deck
7
An entire circle has 280 degrees.
Unlock Deck
Unlock for access to all 93 flashcards in this deck.
Unlock Deck
k this deck
8
A frequency distribution attempts to organize numbers into meaningful patterns.
Unlock Deck
Unlock for access to all 93 flashcards in this deck.
Unlock Deck
k this deck
9
Statistical information is usually more effective if it can be presented visually.
Unlock Deck
Unlock for access to all 93 flashcards in this deck.
Unlock Deck
k this deck
10
The deviation from the mean can be shown by the standard deviation.
Unlock Deck
Unlock for access to all 93 flashcards in this deck.
Unlock Deck
k this deck
11
To find the standard deviation you only need to know the mode.
Unlock Deck
Unlock for access to all 93 flashcards in this deck.
Unlock Deck
k this deck
12
Which of the following would be best used to demonstrate sales trends:
A) bar graph
B) circle graph
C) frequency distribution
D) line graph
A) bar graph
B) circle graph
C) frequency distribution
D) line graph
Unlock Deck
Unlock for access to all 93 flashcards in this deck.
Unlock Deck
k this deck
13
Ryan would like to compare how his various investment choices within his company's 401(k) plan have performed over the last year. This would be best done using a:
A) line graph
B) circle graph
C) frequency distribution
D) bar graph
A) line graph
B) circle graph
C) frequency distribution
D) bar graph
Unlock Deck
Unlock for access to all 93 flashcards in this deck.
Unlock Deck
k this deck
14
Intervals in a grouped frequency should be of equal size.
Unlock Deck
Unlock for access to all 93 flashcards in this deck.
Unlock Deck
k this deck
15
In business, statistics might be used for which of the following:
A) to budget for future spending and expenses
B) to help improve or increase sales
C) all are appropriate uses of statistics in business
D) to gather information about customers
A) to budget for future spending and expenses
B) to help improve or increase sales
C) all are appropriate uses of statistics in business
D) to gather information about customers
Unlock Deck
Unlock for access to all 93 flashcards in this deck.
Unlock Deck
k this deck
16
In a circle graph, the circle itself represents 100% and each section of the circle illustrates a part of the total quantity.
Unlock Deck
Unlock for access to all 93 flashcards in this deck.
Unlock Deck
k this deck
17
The mean is a form of measurement for central tendency.
Unlock Deck
Unlock for access to all 93 flashcards in this deck.
Unlock Deck
k this deck
18
The difference between the smallest value in a set and the largest value is called the:
A) median
B) mode
C) range
D) mean
A) median
B) mode
C) range
D) mean
Unlock Deck
Unlock for access to all 93 flashcards in this deck.
Unlock Deck
k this deck
19
There is no median when all of the values in a set are different.
Unlock Deck
Unlock for access to all 93 flashcards in this deck.
Unlock Deck
k this deck
20
A pie chart is normally used to illustrate trends.
Unlock Deck
Unlock for access to all 93 flashcards in this deck.
Unlock Deck
k this deck
21
In a bar graph presentation, the height or length of each bar represents a specific value.
Unlock Deck
Unlock for access to all 93 flashcards in this deck.
Unlock Deck
k this deck
22
When compared to a frequency distribution, a relative frequency distribution represents:
A) the number of tallies in the largest class interval.
B) the total number of tallies in all class intervals.
C) the percent that each class interval is of the whole.
D) the percent that each class interval is of the mean.
A) the number of tallies in the largest class interval.
B) the total number of tallies in all class intervals.
C) the percent that each class interval is of the whole.
D) the percent that each class interval is of the mean.
Unlock Deck
Unlock for access to all 93 flashcards in this deck.
Unlock Deck
k this deck
23
If no number appears more frequently in a series of numbers, there is no mode.
Unlock Deck
Unlock for access to all 93 flashcards in this deck.
Unlock Deck
k this deck
24
An example of non-visual data presentation is the bar graph.
Unlock Deck
Unlock for access to all 93 flashcards in this deck.
Unlock Deck
k this deck
25
The sum of the values of a set divided by the number of members in that set is the:
A) mean
B) mode
C) median
D) range
A) mean
B) mode
C) median
D) range
Unlock Deck
Unlock for access to all 93 flashcards in this deck.
Unlock Deck
k this deck
26
To find the mean, total the values in a group and multiply the sum by the number of values added.
Unlock Deck
Unlock for access to all 93 flashcards in this deck.
Unlock Deck
k this deck
27
If you were considering purchasing an average-priced home in a new community with home values ranging from $100,000 - $1,000,000, which of the following would give the most realistic picture of how much that home is likely to cost?
A) class interval
B) mean
C) median and mode
D) grouped data
A) class interval
B) mean
C) median and mode
D) grouped data
Unlock Deck
Unlock for access to all 93 flashcards in this deck.
Unlock Deck
k this deck
28
Frequency of occurrence is a factor when calculating the weighted average mean.
Unlock Deck
Unlock for access to all 93 flashcards in this deck.
Unlock Deck
k this deck
29
A graph shows one or more lists of numerical information grouped in some meaningful form.
Unlock Deck
Unlock for access to all 93 flashcards in this deck.
Unlock Deck
k this deck
30
Adding the values in a set of numbers and then dividing the sum by the number of members in the set results in the:
A) mode
B) median
C) range
D) mean
A) mode
B) median
C) range
D) mean
Unlock Deck
Unlock for access to all 93 flashcards in this deck.
Unlock Deck
k this deck
31
Graphs can be used to illustrate changes or trends in business.
Unlock Deck
Unlock for access to all 93 flashcards in this deck.
Unlock Deck
k this deck
32
The mode is the middle value in a series of numbers.
Unlock Deck
Unlock for access to all 93 flashcards in this deck.
Unlock Deck
k this deck
33
The median will distort the average of a set of numbers that has one or more extreme values.
Unlock Deck
Unlock for access to all 93 flashcards in this deck.
Unlock Deck
k this deck
34
The mode is the total of a set of values divided by the number of values in the set.
Unlock Deck
Unlock for access to all 93 flashcards in this deck.
Unlock Deck
k this deck
35
The mean of grouped data is:
A) exactly equal to the midpoint of the interval.
B) the sum of the frequencies of the intervals.
C) the sum of the products of the intervals.
D) a reasonable approximation.
A) exactly equal to the midpoint of the interval.
B) the sum of the frequencies of the intervals.
C) the sum of the products of the intervals.
D) a reasonable approximation.
Unlock Deck
Unlock for access to all 93 flashcards in this deck.
Unlock Deck
k this deck
36
A table is a symbolic or pictorial display of numerical information.
Unlock Deck
Unlock for access to all 93 flashcards in this deck.
Unlock Deck
k this deck
37
In a set with an even number of values, the median is the mean of the middle two numbers.
Unlock Deck
Unlock for access to all 93 flashcards in this deck.
Unlock Deck
k this deck
38
The median is a better indicator of the average than the mean.
Unlock Deck
Unlock for access to all 93 flashcards in this deck.
Unlock Deck
k this deck
39
If no value occurs most frequently in a group, then the mode is considered to be the middle number.
Unlock Deck
Unlock for access to all 93 flashcards in this deck.
Unlock Deck
k this deck
40
When describing employee performance, a human resource professional would say it follows a normal distribution if the graph of the data set:
A) when folded at the highest point of the bell-shaped curve, the two halves would match
B) shows that 95% of the data will fall within three standard deviations of the mean
C) all of these apply to normal distribution
D) the bell-shaped curve is asymmetrical
A) when folded at the highest point of the bell-shaped curve, the two halves would match
B) shows that 95% of the data will fall within three standard deviations of the mean
C) all of these apply to normal distribution
D) the bell-shaped curve is asymmetrical
Unlock Deck
Unlock for access to all 93 flashcards in this deck.
Unlock Deck
k this deck
41
Calculating a batting average is an example of using the mode.
Unlock Deck
Unlock for access to all 93 flashcards in this deck.
Unlock Deck
k this deck
42
A symbolic or pictorial display of numeric information is known as a:
A) range
B) statistic
C) table
D) graph
A) range
B) statistic
C) table
D) graph
Unlock Deck
Unlock for access to all 93 flashcards in this deck.
Unlock Deck
k this deck
43
The statistical term "the mean" is a totally different function than the arithmetic average.
Unlock Deck
Unlock for access to all 93 flashcards in this deck.
Unlock Deck
k this deck
44
A number that describes numerical data is a statistic.
Unlock Deck
Unlock for access to all 93 flashcards in this deck.
Unlock Deck
k this deck
45
A graph designed to quickly illustrate to the reader whether a set of data is increasing, decreasing, or fluctuating is a:
A) line graph
B) circle graph
C) bar graph
D) range graph
A) line graph
B) circle graph
C) bar graph
D) range graph
Unlock Deck
Unlock for access to all 93 flashcards in this deck.
Unlock Deck
k this deck
46
A visual aid used to illustrate trends is a:
A) range graph
B) circle graph
C) line graph
D) bar graph
A) range graph
B) circle graph
C) line graph
D) bar graph
Unlock Deck
Unlock for access to all 93 flashcards in this deck.
Unlock Deck
k this deck
47
Grade point average calculations are an example of using the mode.
Unlock Deck
Unlock for access to all 93 flashcards in this deck.
Unlock Deck
k this deck
48
When comparing electrical usage among utility customers, a small standard deviation indicates that the mean:
A) is not a typical value in the data set
B) shows that electrical usage is increasing
C) shows that electrical usage is decreasing
D) is a typical value in the data set
A) is not a typical value in the data set
B) shows that electrical usage is increasing
C) shows that electrical usage is decreasing
D) is a typical value in the data set
Unlock Deck
Unlock for access to all 93 flashcards in this deck.
Unlock Deck
k this deck
49
The range is the difference between the highest and lowest values in a series or group of values.
Unlock Deck
Unlock for access to all 93 flashcards in this deck.
Unlock Deck
k this deck
50
The mean should always be rounded to the nearest hundredth.
Unlock Deck
Unlock for access to all 93 flashcards in this deck.
Unlock Deck
k this deck
51
The sum of all values divided by the number of values equals the:
A) mode
B) mean
C) weighted mean
D) median
A) mode
B) mean
C) weighted mean
D) median
Unlock Deck
Unlock for access to all 93 flashcards in this deck.
Unlock Deck
k this deck
52
A large (wide) range indicates that the values in a group are similar in value to one another.
Unlock Deck
Unlock for access to all 93 flashcards in this deck.
Unlock Deck
k this deck
53
A line graph may be used to demonstrate trends.
Unlock Deck
Unlock for access to all 93 flashcards in this deck.
Unlock Deck
k this deck
54
When locating the mode, you must arrange the values in descending or ascending order.
Unlock Deck
Unlock for access to all 93 flashcards in this deck.
Unlock Deck
k this deck
55
The median is the value that occurs most frequently in a group of values.
Unlock Deck
Unlock for access to all 93 flashcards in this deck.
Unlock Deck
k this deck
56
When creating a grouped frequency distribution, each class interval:
A) will always have different tallies
B) will have the same number of tallies
C) should be created appropriately, given the data set
D) will have the same mean
A) will always have different tallies
B) will have the same number of tallies
C) should be created appropriately, given the data set
D) will have the same mean
Unlock Deck
Unlock for access to all 93 flashcards in this deck.
Unlock Deck
k this deck
57
A visual aid often used to compare related data is a:
A) bar graph
B) mode graph
C) range graph
D) line graph
A) bar graph
B) mode graph
C) range graph
D) line graph
Unlock Deck
Unlock for access to all 93 flashcards in this deck.
Unlock Deck
k this deck
58
Bar graphs make use of intervals to clarify the illustration of data.
Unlock Deck
Unlock for access to all 93 flashcards in this deck.
Unlock Deck
k this deck
59
Statistical data cannot be presented in tables or graphs.
Unlock Deck
Unlock for access to all 93 flashcards in this deck.
Unlock Deck
k this deck
60
If a group or series of numbers has an even number of members, there is no median.
Unlock Deck
Unlock for access to all 93 flashcards in this deck.
Unlock Deck
k this deck
61
The mean, median, and mode show the tendency of a group of numbers to cluster together in the center of a series of numbers.
Unlock Deck
Unlock for access to all 93 flashcards in this deck.
Unlock Deck
k this deck
62
18% of a circle graph is shown by a section of:
A) 48 degrees
B) 64.8 degrees
C) 36 degrees
D) 18 degrees
A) 48 degrees
B) 64.8 degrees
C) 36 degrees
D) 18 degrees
Unlock Deck
Unlock for access to all 93 flashcards in this deck.
Unlock Deck
k this deck
63
Use this graph to answer the question
-Which month in 2010 had the lowest sales?
A) Month 7
B) Month 12
C) Month 2
D) Month 3
-Which month in 2010 had the lowest sales?
A) Month 7
B) Month 12
C) Month 2
D) Month 3
Unlock Deck
Unlock for access to all 93 flashcards in this deck.
Unlock Deck
k this deck
64
A list of numerical information grouped in some meaningful form is called a:
A) statistic
B) range
C) table
D) graph
A) statistic
B) range
C) table
D) graph
Unlock Deck
Unlock for access to all 93 flashcards in this deck.
Unlock Deck
k this deck
65
Christine is currently taking college astronomy. The instructor often gives quizzes. On the past seven quizzes, Christine got the following scores. Find the standard deviation. 53 12 41 29 18 42 57
A) 9072
B) 10,812
C) 17
D) 41
A) 9072
B) 10,812
C) 17
D) 41
Unlock Deck
Unlock for access to all 93 flashcards in this deck.
Unlock Deck
k this deck
66
Which of the following statements is incorrect?
A) A circle graph contains 360 degrees.
B) Using only the statistical mean could result in distortions.
C) The line graph and bar graph are identical.
D) The mode is a statistical measurement that records value that occurs the most in a data set.
A) A circle graph contains 360 degrees.
B) Using only the statistical mean could result in distortions.
C) The line graph and bar graph are identical.
D) The mode is a statistical measurement that records value that occurs the most in a data set.
Unlock Deck
Unlock for access to all 93 flashcards in this deck.
Unlock Deck
k this deck
67
Line graphs are often used to compare several related values.
Unlock Deck
Unlock for access to all 93 flashcards in this deck.
Unlock Deck
k this deck
68
A number that describes numerical data is a:
A) graph
B) statistic
C) pie chart
D) table
A) graph
B) statistic
C) pie chart
D) table
Unlock Deck
Unlock for access to all 93 flashcards in this deck.
Unlock Deck
k this deck
69
Find the mean for the amounts: $7760, $5050, $5050, $6690, $3020, $2880. Round to the nearest whole number.
A) $5075
B) $5074
C) $5050
D) $6690
A) $5075
B) $5074
C) $5050
D) $6690
Unlock Deck
Unlock for access to all 93 flashcards in this deck.
Unlock Deck
k this deck
70
A smaller standard deviation indicates that the mean is a typical value in the data set.
Unlock Deck
Unlock for access to all 93 flashcards in this deck.
Unlock Deck
k this deck
71
The mode appears most frequently in a series of numbers.
Unlock Deck
Unlock for access to all 93 flashcards in this deck.
Unlock Deck
k this deck
72
Use the graph to determine how many hours were needed to prepare for Test 2.
A) 5
B) 2
C) 3
D) 1
A) 5
B) 2
C) 3
D) 1
Unlock Deck
Unlock for access to all 93 flashcards in this deck.
Unlock Deck
k this deck
73
This graph is more complex to construct, because you must perform a number of calculations before you begin the actual graph.
A) range graph
B) circle graph
C) line graph
D) bar graph
A) range graph
B) circle graph
C) line graph
D) bar graph
Unlock Deck
Unlock for access to all 93 flashcards in this deck.
Unlock Deck
k this deck
74
The middle value in a series of numbers arranged in order from smallest to largest is the:
A) range
B) mode
C) mean
D) median
A) range
B) mode
C) mean
D) median
Unlock Deck
Unlock for access to all 93 flashcards in this deck.
Unlock Deck
k this deck
75
On a bar graph, the bars are always vertical.
Unlock Deck
Unlock for access to all 93 flashcards in this deck.
Unlock Deck
k this deck
76
The range is the result of subtracting the smallest value from the largest value in a group of numbers.
Unlock Deck
Unlock for access to all 93 flashcards in this deck.
Unlock Deck
k this deck
77
The mean is the arithmetic average of a series of numbers.
Unlock Deck
Unlock for access to all 93 flashcards in this deck.
Unlock Deck
k this deck
78
The following test scores were recorded for a student: 97, 89, 85, 85, 97, 99. Find the mean, median, and mode.
A) mean: 92 median: 93 mode: 85 and 97
B) mean: 93 median: 92 mode: 97
C) mean: 92 median: 85 mode: 99
D) mean: 93 median: 93 mode: 85
A) mean: 92 median: 93 mode: 85 and 97
B) mean: 93 median: 92 mode: 97
C) mean: 92 median: 85 mode: 99
D) mean: 93 median: 93 mode: 85
Unlock Deck
Unlock for access to all 93 flashcards in this deck.
Unlock Deck
k this deck
79
Frequency is represented by the height of a bar chart.
Unlock Deck
Unlock for access to all 93 flashcards in this deck.
Unlock Deck
k this deck
80
A good statistical indicator to avoid the distortion of extreme values is the:
A) weighted mean
B) mode
C) mean
D) median
A) weighted mean
B) mode
C) mean
D) median
Unlock Deck
Unlock for access to all 93 flashcards in this deck.
Unlock Deck
k this deck
Unlock Deck
Unlock for access to all 93 flashcards in this deck.


