Deck 5: Individual and Market Demand
Full screen (f)
Question
Use the following to answer question:
Figure 5.1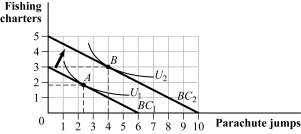
(Figure 5.1) Francis spends his income on fishing charters and jumping out of airplanes. Which of the following statements is TRUE?
A) Fishing charters are an inferior good.
B) An increase in income could cause the optimal consumption bundle to move from point A to point B.
C) Parachute jumps are an inferior good.
D) An increase in the price of parachute jumps could cause the optimal consumption bundle to move from point A to point B.
Question
Use the following to answer question:
Figure 5.5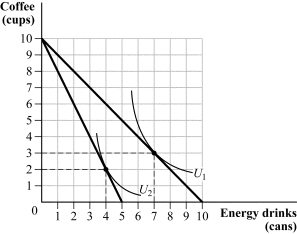
(Figure 5.5) Suppose the consumer has $10 to spend on energy drinks and coffee. Which of the following figures represents the consumer's demand curve for energy drinks?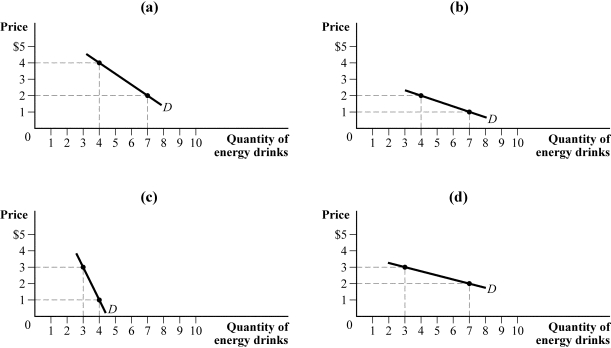
A) panel (a)
B) panel (b)
C) panel (c)
D) panel (d)
Figure 5.5
(Figure 5.5) Suppose the consumer has $10 to spend on energy drinks and coffee. Which of the following figures represents the consumer's demand curve for energy drinks?
A) panel (a)
B) panel (b)
C) panel (c)
D) panel (d)
Question
Use the following to answer questions 5-6:
Figure 5.3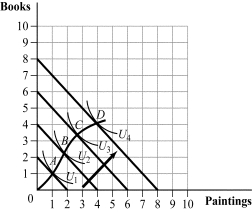
(Figure 5.3) Which of the following statements is TRUE?
A) Books are an inferior good at income levels greater than those associated with bundle B.
B) Books are an inferior good at income levels greater than those associated with bundle C.
C) Both books and paintings are normal goods up to the income level corresponding to bundle D.
D) Paintings are an inferior good at income levels higher than those associated with these bundles.
Question
Question
Question
Question
Use the following to answer question:
Figure 5.12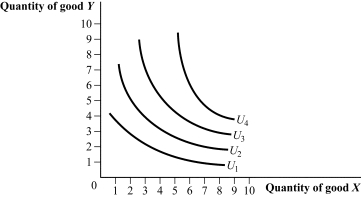
(Figure 5.12) The substitution effect will be largest for indifference curve:
A) U1.
B) U2.
C) U3.
D) U4.
Figure 5.12
(Figure 5.12) The substitution effect will be largest for indifference curve:
A) U1.
B) U2.
C) U3.
D) U4.
Question
Question
Use the following to answer question:
Figure 5.10
(Figure 5.10) When the price of milk drops, the income effect _____ the quantity of milk consumed from _____.
A) increases; 2 to 6 gallons
B) increases; 4 to 6 gallons
C) decreases; 6 to 2 gallons
D) increases; 2 to 4 gallons
Figure 5.10
(Figure 5.10) When the price of milk drops, the income effect _____ the quantity of milk consumed from _____.
A) increases; 2 to 6 gallons
B) increases; 4 to 6 gallons
C) decreases; 6 to 2 gallons
D) increases; 2 to 4 gallons
Question
Use the following to answer question:
Figure 5.6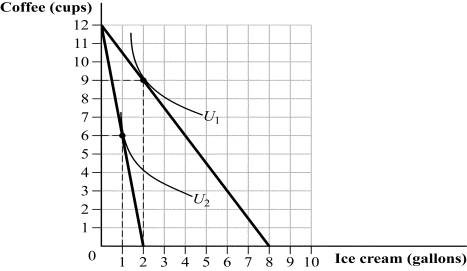
(Figure 5.6) Garth spends his income on ice cream and coffee, and coffee sells for $1 a cup. If ice cream sells for $1.50 per gallon, Garth will purchase:
A) 2 gallons.
B) 8 gallons.
C) 1 gallon.
D) 6 gallons.
Figure 5.6
(Figure 5.6) Garth spends his income on ice cream and coffee, and coffee sells for $1 a cup. If ice cream sells for $1.50 per gallon, Garth will purchase:
A) 2 gallons.
B) 8 gallons.
C) 1 gallon.
D) 6 gallons.
Question
Use the following to answer question:
Figure 5.4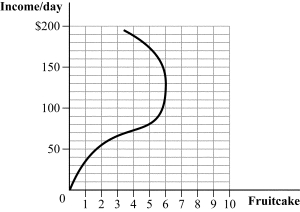
(Figure 5.4) Which of the following statements is TRUE?
A) Fruitcake is an inferior good regardless of income level.
B) Fruitcake is a normal good regardless of income level.
C) Fruitcake is a normal good until income reaches $120, and then it becomes an inferior good.
D) Fruitcake is an inferior good until income reaches $120, and then it becomes a normal good.
Question
Use the following to answer question:
Figure 5.8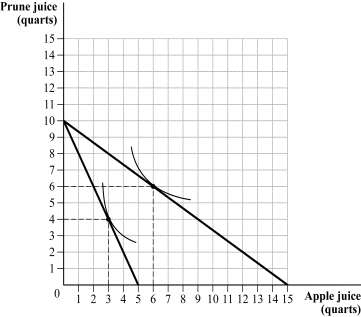
(Figure 5.8) Refer to Figure 5.8, depicting the consumer's indifference curves and budget constraints. Suppose the consumer has $20 of income to spend on apple and prune juice. Which of the following statement(s) is (are) TRUE?
A) I and II
B) II and III
C) II and IV
D) I
Figure 5.8
(Figure 5.8) Refer to Figure 5.8, depicting the consumer's indifference curves and budget constraints. Suppose the consumer has $20 of income to spend on apple and prune juice. Which of the following statement(s) is (are) TRUE?
A) I and II
B) II and III
C) II and IV
D) I
Question
Use the following to answer questions 18-19:
Figure 5.11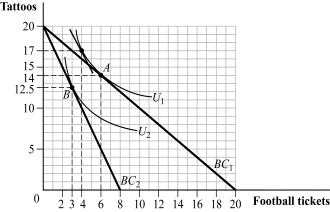
(Figure 5.11) When the price of football tickets increases, the substitution effect decreases the number of tickets bought from:
A) 4 to 3.
B) 6 to 3.
C) 6 to 4.
D) 20 to 8.
Figure 5.11
(Figure 5.11) When the price of football tickets increases, the substitution effect decreases the number of tickets bought from:
A) 4 to 3.
B) 6 to 3.
C) 6 to 4.
D) 20 to 8.
Question
Use the following to answer questions 18-19:
Figure 5.11
(Figure 5.11) When the price of football tickets increases, the income effect decreases the number of tickets bought from:
A) 4 to 3.
B) 6 to 3.
C) 6 to 4.
D) 20 to 8.
Figure 5.11
(Figure 5.11) When the price of football tickets increases, the income effect decreases the number of tickets bought from:
A) 4 to 3.
B) 6 to 3.
C) 6 to 4.
D) 20 to 8.
Question
Question
Use the following to answer question:
Figure 5.7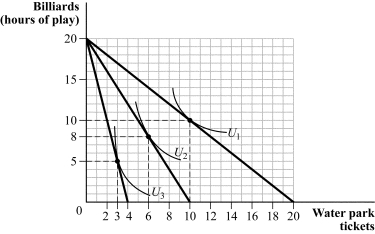
(Figure 5.7) Based on the consumer's indifference curves and budget constraints, which of the following demand curves reflects the consumer's demand for water park tickets? Assume the consumer has income of $100.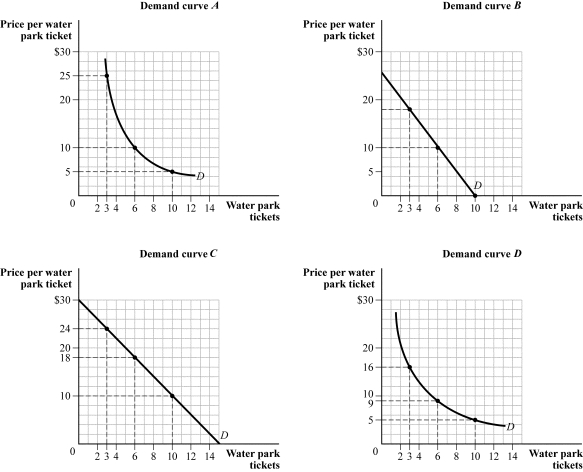
A) Demand curve A
B) Demand curve B
C) Demand curve C
D) Demand curve D
Figure 5.7
(Figure 5.7) Based on the consumer's indifference curves and budget constraints, which of the following demand curves reflects the consumer's demand for water park tickets? Assume the consumer has income of $100.
A) Demand curve A
B) Demand curve B
C) Demand curve C
D) Demand curve D
Question
Use the following to answer question:
Figure 5.9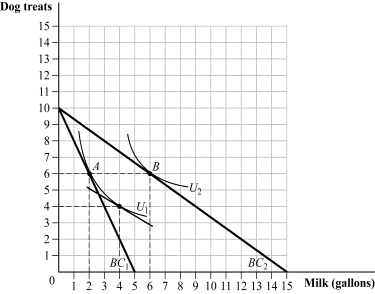
(Figure 5.9) When the price of milk drops, the substitution effect _____ the quantity of milk consumed from _____.
A) increases; 2 to 6 gallons
B) increases; 4 to 6 gallons
C) decreases; 6 to 2 gallons
D) increases; 2 to 4 gallons
Figure 5.9
(Figure 5.9) When the price of milk drops, the substitution effect _____ the quantity of milk consumed from _____.
A) increases; 2 to 6 gallons
B) increases; 4 to 6 gallons
C) decreases; 6 to 2 gallons
D) increases; 2 to 4 gallons
Question
Use the following to answer question:
Figure 5.2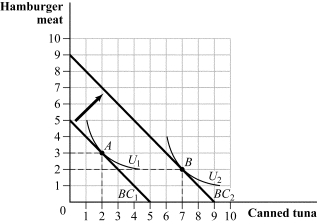
(Figure 5.2) Hamburger meat is a(n) _____ good and canned tuna is a(n) _____ good.
A) normal; normal
B) inferior; normal
C) inferior; inferior
D) normal; inferior
Figure 5.2
(Figure 5.2) Hamburger meat is a(n) _____ good and canned tuna is a(n) _____ good.
A) normal; normal
B) inferior; normal
C) inferior; inferior
D) normal; inferior
Question
Question
Use the following to answer questions 5-6:
Figure 5.3
(Figure 5.3) The curve that goes through the points A, B, C, and D is called the:
A) income elasticity curve.
B) optimal consumption path.
C) Engel curve.
D) income expansion path.
Figure 5.3
(Figure 5.3) The curve that goes through the points A, B, C, and D is called the:
A) income elasticity curve.
B) optimal consumption path.
C) Engel curve.
D) income expansion path.
Question
Use the following to answer questions 24-25:
Figure 5.14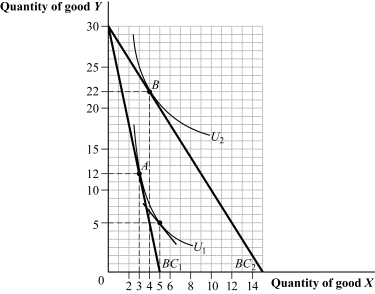
(Figure 5.14) Because of the income effect associated with the decrease in the price of good X, the quantity of good X purchased:
A) increases from 3 to 4.
B) increases from 4 to 5.
C) decreases from 5 to 4.
D) increases from 3 to 5.
Figure 5.14
(Figure 5.14) Because of the income effect associated with the decrease in the price of good X, the quantity of good X purchased:
A) increases from 3 to 4.
B) increases from 4 to 5.
C) decreases from 5 to 4.
D) increases from 3 to 5.
Question
Use the following to answer questions 36-37:
Figure 5.18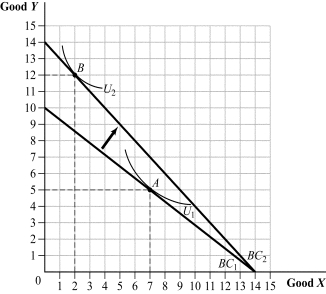
(Figure 5.18) Which of the following statements are TRUE?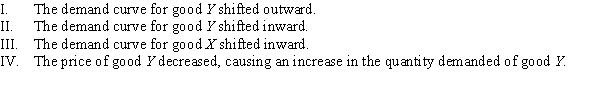
A) II and III
B) I, III, and IV
C) III and IV
D) I and IV
Figure 5.18
(Figure 5.18) Which of the following statements are TRUE?
A) II and III
B) I, III, and IV
C) III and IV
D) I and IV
Question
Question
Use the following to answer questions 26-28:
Figure 5.15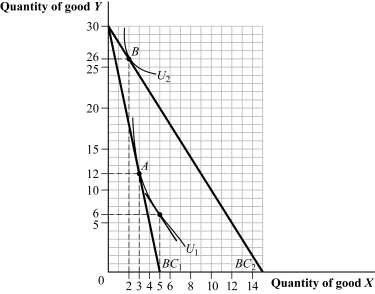
(Figure 5.15) Because of the income effect associated with the decrease in the price of good X, the quantity of good X purchased:
A) increases from 3 to 5.
B) decreases from 5 to 2.
C) decreases from 3 to 2.
D) decreases from 5 to 3.
Figure 5.15
(Figure 5.15) Because of the income effect associated with the decrease in the price of good X, the quantity of good X purchased:
A) increases from 3 to 5.
B) decreases from 5 to 2.
C) decreases from 3 to 2.
D) decreases from 5 to 3.
Question
Use the following to answer question:
Figure 5.17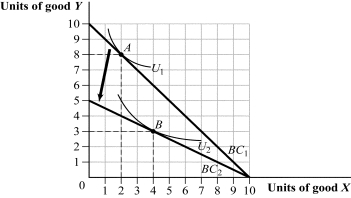
(Figure 5.17) Given the change in the budget constraint, which of the following statements is TRUE?
A) The demand curve for good Y shifted inward.
B) The demand curve for good X shifted outward.
C) Good X is an inferior good.
D) Good X and good Y are complements.
Figure 5.17
(Figure 5.17) Given the change in the budget constraint, which of the following statements is TRUE?
A) The demand curve for good Y shifted inward.
B) The demand curve for good X shifted outward.
C) Good X is an inferior good.
D) Good X and good Y are complements.
Question
Use the following to answer questions 39-40:
Figure 5.19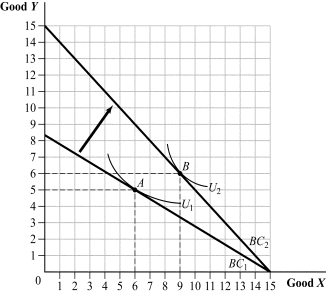
(Figure 5.19) Given the change in the budget constraint, the demand curve for _____ shifted _____.
A) good X; inward
B) good Y; outward
C) good X; outward
D) both good X and good Y; outward
Figure 5.19
(Figure 5.19) Given the change in the budget constraint, the demand curve for _____ shifted _____.
A) good X; inward
B) good Y; outward
C) good X; outward
D) both good X and good Y; outward
Question
Question
Use the following to answer questions 29-30:
Figure 5.16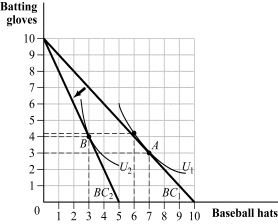
(Figure 5.16) The income effect of the price increase causes consumption of baseball hats to:
A) decrease by 1.
B) decrease by 3.
C) decrease by 4.
D) increase by 1.
Figure 5.16
(Figure 5.16) The income effect of the price increase causes consumption of baseball hats to:
A) decrease by 1.
B) decrease by 3.
C) decrease by 4.
D) increase by 1.
Question
Use the following to answer questions 26-28:
Figure 5.15
(Figure 5.15) Because of the substitution effect associated with the decrease in the price of good X, the quantity of good X purchased:
A) increases from 3 to 5.
B) decreases from 3 to 2.
C) increases from 2 to 3.
D) increases from 2 to 5.
Figure 5.15
(Figure 5.15) Because of the substitution effect associated with the decrease in the price of good X, the quantity of good X purchased:
A) increases from 3 to 5.
B) decreases from 3 to 2.
C) increases from 2 to 3.
D) increases from 2 to 5.
Question
Question
Suppose the price of good X, a Giffen good, increases. Which of the following statements are TRUE? 
A) I and IV
B) II and IV
C) I and III
D) II and III
A) I and IV
B) II and IV
C) I and III
D) II and III
Question
Use the following to answer questions 26-28:
Figure 5.15
(Figure 5.15) What type of good is good X?
A) I and III
B) III
C) II and III
D) I
Figure 5.15
(Figure 5.15) What type of good is good X?
A) I and III
B) III
C) II and III
D) I
Question
Use the following to answer questions 39-40:
Figure 5.19
(Figure 5.19) The price of good Y _____, increasing the consumption of both good Y and good X, which are _____.
A) increased; complements
B) decreased; substitutes
C) increased; substitutes
D) decreased; complements
Figure 5.19
(Figure 5.19) The price of good Y _____, increasing the consumption of both good Y and good X, which are _____.
A) increased; complements
B) decreased; substitutes
C) increased; substitutes
D) decreased; complements
Question
Question
Use the following to answer questions 36-37:
Figure 5.18
(Figure 5.18) Good X and good Y are:
A) perfect complements.
B) Giffen goods.
C) complement goods.
D) substitute goods.
Figure 5.18
(Figure 5.18) Good X and good Y are:
A) perfect complements.
B) Giffen goods.
C) complement goods.
D) substitute goods.
Question
Use the following to answer question:
Figure 5.13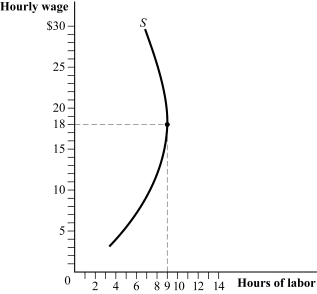
(Figure 5.13) Which of the following statements is (are) TRUE?
A) I and II
B) II and III
C) III and IV
D) I
Figure 5.13
(Figure 5.13) Which of the following statements is (are) TRUE?
A) I and II
B) II and III
C) III and IV
D) I
Question
Which of the following statements are TRUE? 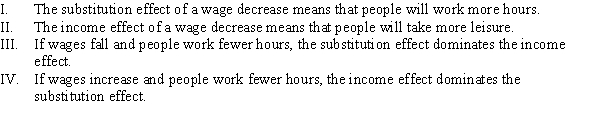
A) I, II, and IV
B) I and IV
C) II and III
D) III and IV
A) I, II, and IV
B) I and IV
C) II and III
D) III and IV
Question
Question
Use the following to answer questions 29-30:
Figure 5.16
(Figure 5.16) The substitution effect of the price increase causes consumption of baseball hats to:
A) decrease by 1.
B) decrease by 3.
C) decrease by 4.
D) increase by 1.
Figure 5.16
(Figure 5.16) The substitution effect of the price increase causes consumption of baseball hats to:
A) decrease by 1.
B) decrease by 3.
C) decrease by 4.
D) increase by 1.
Question
Use the following to answer questions 24-25:
Figure 5.14
(Figure 5.14) Good X is a(n) _____ good, and good Y is a(n) _____ good.
A) normal; inferior
B) normal; normal
C) inferior; inferior
D) inferior; normal
Figure 5.14
(Figure 5.14) Good X is a(n) _____ good, and good Y is a(n) _____ good.
A) normal; inferior
B) normal; normal
C) inferior; inferior
D) inferior; normal
Question
Use the following to answer question:
Figure 5.23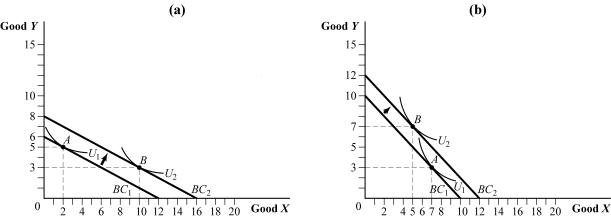
(Figure 5.23) In panel (a), the price of good X is $1.50 per unit and the price of good Y is $3 per unit. In panel (b), the consumer's income increased from $400 to $480.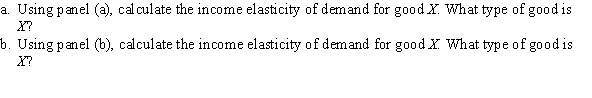
Figure 5.23
(Figure 5.23) In panel (a), the price of good X is $1.50 per unit and the price of good Y is $3 per unit. In panel (b), the consumer's income increased from $400 to $480.
Question
Use the following to answer question:
Figure 5.25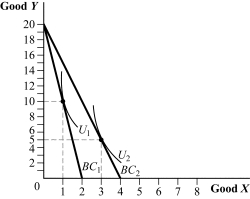
(Figure 5.25) Answer the following questions: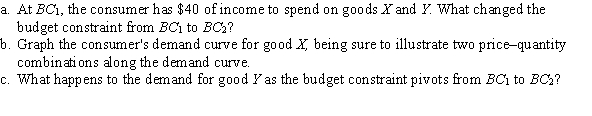
Figure 5.25
(Figure 5.25) Answer the following questions:
Question
Question
Question
Use the following to answer question:
Figure 5.21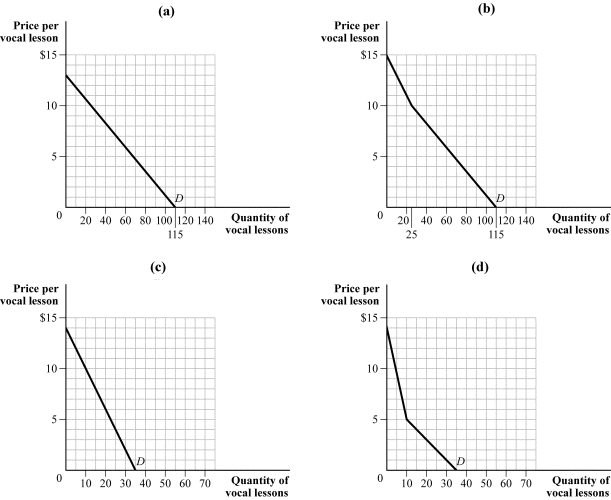
(Figure 5.21) Suppose Milli and Vanilli are the only two customers in the market for voice lessons. Milli's demand is QM = 40 - 4P, and Vanilli's demand is QV = 75 - 5P. Which panel represents the market demand for vocal lessons?
A) panel (a)
B) panel (b)
C) panel (c)
D) panel (d)
Figure 5.21
(Figure 5.21) Suppose Milli and Vanilli are the only two customers in the market for voice lessons. Milli's demand is QM = 40 - 4P, and Vanilli's demand is QV = 75 - 5P. Which panel represents the market demand for vocal lessons?
A) panel (a)
B) panel (b)
C) panel (c)
D) panel (d)
Question
Blaze has $200 to spend on fishing equipment and fast-food burgers. Fishing equipment is priced at $10 per unit and fast-food burgers are priced at $4 per burger. 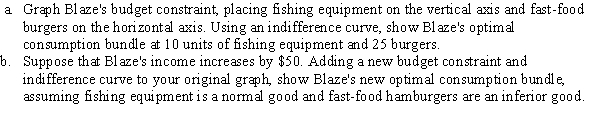
Question
Question
Eugene has $100 to spend on video blackjack at $1 per game and French fries at $1 per basket. 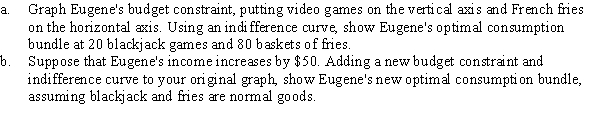
Question
Use the following to answer question:
Figure 5.22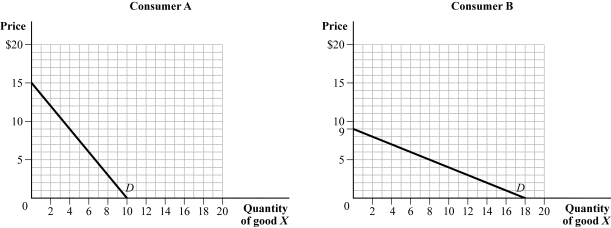
(Figure 5.22) Suppose there are only two consumers in the market for good X. The total quantity demanded in the market at a price of $3 is _____, and the total quantity demanded in the market at a price of $12 is _____.
A) 20; 2
B) 20; 5
C) 6; 3
D) 18; 0
Figure 5.22
(Figure 5.22) Suppose there are only two consumers in the market for good X. The total quantity demanded in the market at a price of $3 is _____, and the total quantity demanded in the market at a price of $12 is _____.
A) 20; 2
B) 20; 5
C) 6; 3
D) 18; 0
Question
Use the following to answer question:
Figure 5.24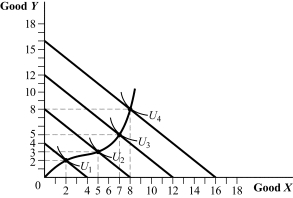
(Figure 5.24) Answer the following questions: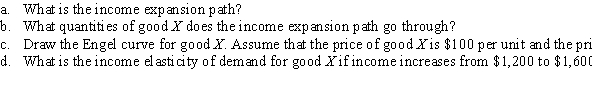
Figure 5.24
(Figure 5.24) Answer the following questions:
Question
Sally is one of many consumers in the yellow onion market. Which of the following statements is (are) TRUE? 
A) II and III
B) I
C) II
D) III
A) II and III
B) I
C) II
D) III
Question
Question
Question
Suppose the demand for good X shifts in. Which of the following statements is (are) TRUE? 
A) I, II, and III
B) II and III
C) I
D) II
A) I, II, and III
B) II and III
C) I
D) II
Question
Question
Alec has $40 weekly to spend on restaurant meals (priced at $10 per meal) and bowling (priced at $2 per game). 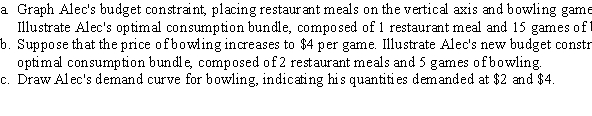
Question
Use the following to answer question:
Figure 5.20
(Figure 5.20) The cross-price elasticity of demand for good X with respect to good Y is _____ in panel (a) and _____ in panel (b).
A) zero; negative
B) negative; positive
C) positive; negative
D) negative infinity; positive
Figure 5.20
(Figure 5.20) The cross-price elasticity of demand for good X with respect to good Y is _____ in panel (a) and _____ in panel (b).
A) zero; negative
B) negative; positive
C) positive; negative
D) negative infinity; positive
Question
Question
Which of the following statements is TRUE? 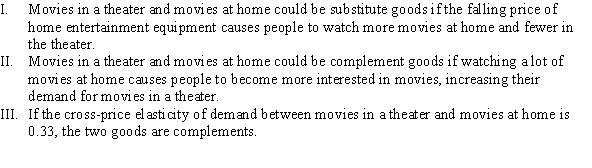
A) I only
B) II only
C) I, II, and III
D) I and II
A) I only
B) II only
C) I, II, and III
D) I and II
Question
Question
Use the following to answer question:
Figure 5.31
(Figure 5.31) Assume that Roscoe and Roland comprise the entire market of buyers.


Figure 5.31
(Figure 5.31) Assume that Roscoe and Roland comprise the entire market of buyers.
Question
Use the following to answer question:
Figure 5.33
(Figure 5.33) The consumer has an income of $15 and the utility function U = 5X + 5Y. Before the price change the consumer will consume _____units of Y and _____units of X. After the change, she will consume _____units of Y and _____units of X.
Figure 5.33
(Figure 5.33) The consumer has an income of $15 and the utility function U = 5X + 5Y. Before the price change the consumer will consume _____units of Y and _____units of X. After the change, she will consume _____units of Y and _____units of X.
Question
Use the following to answer question:
Figure 5.27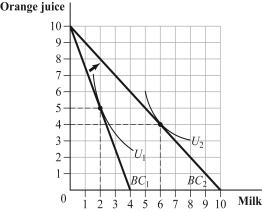
-(Figure 5.27) Illustrate the substitution effect and income effect associated with the decrease in the price of milk. Label the substitution effect A to A' and the income effect A' to B.
Figure 5.27
-(Figure 5.27) Illustrate the substitution effect and income effect associated with the decrease in the price of milk. Label the substitution effect A to A' and the income effect A' to B.
Question
Question
Question
For the following scenarios, explain the direction of the substitution effect, income effect, and total effect. 
Question
Question
Question
Use the following to answer question:
Figure 5.30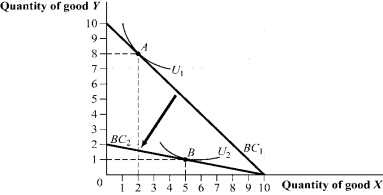
(Figure 5.30) The price of good Y increased from $1.00 to $5.00.
Figure 5.30
(Figure 5.30) The price of good Y increased from $1.00 to $5.00.
Question
Question
Use the following to answer question:
Figure 5.32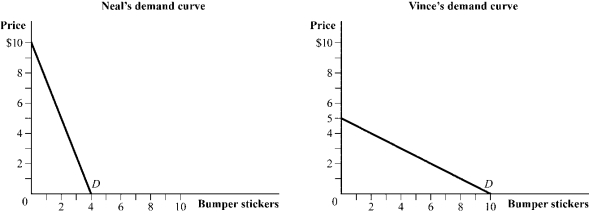
(Figure 5.32) Graph the market demand curve for bumper stickers, assuming that Neal and Vince are the only two consumers in the market for bumper stickers. On your graph, show the quantity demanded at $10, $7.50, $5, $2.50, and $0.
Figure 5.32
(Figure 5.32) Graph the market demand curve for bumper stickers, assuming that Neal and Vince are the only two consumers in the market for bumper stickers. On your graph, show the quantity demanded at $10, $7.50, $5, $2.50, and $0.
Question
Question
Use the following to answer question:
Figure 5.29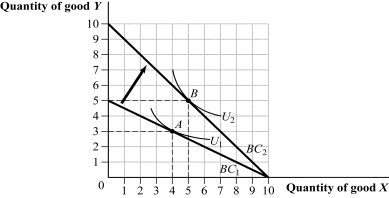
(Figure 5.29) The price of good Y decreased from $20 to $10.
Figure 5.29
(Figure 5.29) The price of good Y decreased from $20 to $10.
Question
Use the following to answer question:
Figure 5.28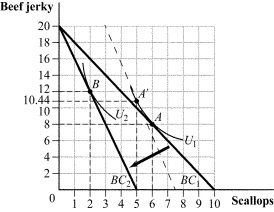
-(Figure 5.28) Answer the following questions.
Figure 5.28
-(Figure 5.28) Answer the following questions.
Question
A consumer's bundle includes good X and good Y. Determine whether the following statements are true, false, or uncertain. 
Question
Suppose a consumer spends her income on lobster and frozen pizza. Assume that the consumer has an income of $60, the price of lobster is $6, and the price of frozen pizza is $6. 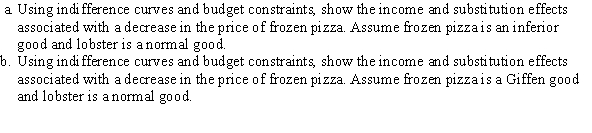
Question
Question
Use the following to answer question:
Figure 5.35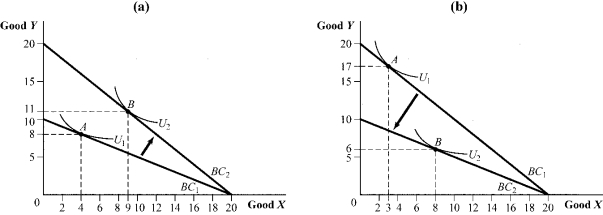
For a constant income, the cross-price elasticity of demand between good X and Y in figure A is _____. In figure B it is _____
Figure 5.35
For a constant income, the cross-price elasticity of demand between good X and Y in figure A is _____. In figure B it is _____
Question
Use the following to answer question:
Figure 5.26
(Figure 5.26) This graph shows the demand curve for skirts. Suppose the consumer has $500 to spend on skirts and handbags, and the price of handbags remains unchanged at $100. Using budget constraints and indifference curves, placing skirts on the horizontal axis and handbags on the vertical axis, illustrate two of the consumer's optimal consumption bundles of skirts and handbags.
Question
Use the following to answer question:
Figure 5.34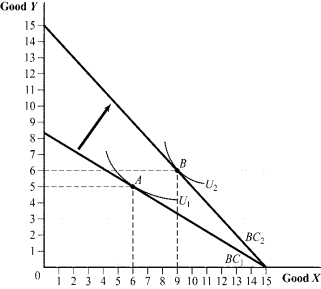
(Figure 5.34) For an income of $15, the price of Y falls by _____, leading to a substitution effect of _____and an income effect of _____ .
Figure 5.34
(Figure 5.34) For an income of $15, the price of Y falls by _____, leading to a substitution effect of _____and an income effect of _____ .

Unlock Deck
Sign up to unlock the cards in this deck!
Unlock Deck
Unlock Deck
1/103
Play
Full screen (f)
Deck 5: Individual and Market Demand
1
Use the following to answer question:
Figure 5.1
(Figure 5.1) Francis spends his income on fishing charters and jumping out of airplanes. Which of the following statements is TRUE?
A) Fishing charters are an inferior good.
B) An increase in income could cause the optimal consumption bundle to move from point A to point B.
C) Parachute jumps are an inferior good.
D) An increase in the price of parachute jumps could cause the optimal consumption bundle to move from point A to point B.
B
2
Use the following to answer question:
Figure 5.5
(Figure 5.5) Suppose the consumer has $10 to spend on energy drinks and coffee. Which of the following figures represents the consumer's demand curve for energy drinks?
A) panel (a)
B) panel (b)
C) panel (c)
D) panel (d)
Figure 5.5
(Figure 5.5) Suppose the consumer has $10 to spend on energy drinks and coffee. Which of the following figures represents the consumer's demand curve for energy drinks?
A) panel (a)
B) panel (b)
C) panel (c)
D) panel (d)
B
3
Use the following to answer questions 5-6:
Figure 5.3
(Figure 5.3) Which of the following statements is TRUE?
A) Books are an inferior good at income levels greater than those associated with bundle B.
B) Books are an inferior good at income levels greater than those associated with bundle C.
C) Both books and paintings are normal goods up to the income level corresponding to bundle D.
D) Paintings are an inferior good at income levels higher than those associated with these bundles.
C
4
When Logan earned $1,000 per week, he purchased 5 karate lessons and 40 gallons of gasoline. When his earnings increased to $1,100 per week, he purchased 6 karate lessons and 43 gallons of gasoline. The income elasticity of karate lessons and gasoline are _____ and _____, respectively.
A) 0.50; 1.33
B) 0.10; 1.6
C) 2.00; 0.75
D) 0.85; 0.15
A) 0.50; 1.33
B) 0.10; 1.6
C) 2.00; 0.75
D) 0.85; 0.15
Unlock Deck
Unlock for access to all 103 flashcards in this deck.
Unlock Deck
k this deck
5
The income effect of a price change predicts that a _____ in a good's price will _____ consumer purchasing power, leading to a(n) _____ in consumption of _____ goods.
A) fall; increase; increase; normal
B) fall; decrease; decrease; normal
C) rise; increase; increase; inferior
D) rise; increase; decrease; inferior
A) fall; increase; increase; normal
B) fall; decrease; decrease; normal
C) rise; increase; increase; inferior
D) rise; increase; decrease; inferior
Unlock Deck
Unlock for access to all 103 flashcards in this deck.
Unlock Deck
k this deck
6
Suppose that Seth's income increases from $400 to $500 per week, so Seth increases his purchases of movies from 3 to 4. The income elasticity of movies is:
A) 1.33.
B) 0.25.
C) 0.75.
D) 1.00.
A) 1.33.
B) 0.25.
C) 0.75.
D) 1.00.
Unlock Deck
Unlock for access to all 103 flashcards in this deck.
Unlock Deck
k this deck
7
Use the following to answer question:
Figure 5.12
(Figure 5.12) The substitution effect will be largest for indifference curve:
A) U1.
B) U2.
C) U3.
D) U4.
Figure 5.12
(Figure 5.12) The substitution effect will be largest for indifference curve:
A) U1.
B) U2.
C) U3.
D) U4.
Unlock Deck
Unlock for access to all 103 flashcards in this deck.
Unlock Deck
k this deck
8
Julie spends all of her income on gasoline and pizza. Gasoline costs $4 per gallon and pizza costs $2 per slice. When Julie's income is $50 per week, she purchases 5 gallons of gasoline and 15 slices of pizza. When her income rises to $80 per week, she buys 15 gallons of gasoline and 10 slices of pizza. Which of the following statements is true?
A) Both gasoline and pizza are normal goods.
B) Gasoline is a luxury good.
C) Pizza is a luxury good.
D) Both gasoline and pizza are inferior goods.
A) Both gasoline and pizza are normal goods.
B) Gasoline is a luxury good.
C) Pizza is a luxury good.
D) Both gasoline and pizza are inferior goods.
Unlock Deck
Unlock for access to all 103 flashcards in this deck.
Unlock Deck
k this deck
9
Use the following to answer question:
Figure 5.10
(Figure 5.10) When the price of milk drops, the income effect _____ the quantity of milk consumed from _____.
A) increases; 2 to 6 gallons
B) increases; 4 to 6 gallons
C) decreases; 6 to 2 gallons
D) increases; 2 to 4 gallons
Figure 5.10
(Figure 5.10) When the price of milk drops, the income effect _____ the quantity of milk consumed from _____.
A) increases; 2 to 6 gallons
B) increases; 4 to 6 gallons
C) decreases; 6 to 2 gallons
D) increases; 2 to 4 gallons
Unlock Deck
Unlock for access to all 103 flashcards in this deck.
Unlock Deck
k this deck
10
Use the following to answer question:
Figure 5.6
(Figure 5.6) Garth spends his income on ice cream and coffee, and coffee sells for $1 a cup. If ice cream sells for $1.50 per gallon, Garth will purchase:
A) 2 gallons.
B) 8 gallons.
C) 1 gallon.
D) 6 gallons.
Figure 5.6
(Figure 5.6) Garth spends his income on ice cream and coffee, and coffee sells for $1 a cup. If ice cream sells for $1.50 per gallon, Garth will purchase:
A) 2 gallons.
B) 8 gallons.
C) 1 gallon.
D) 6 gallons.
Unlock Deck
Unlock for access to all 103 flashcards in this deck.
Unlock Deck
k this deck
11
Use the following to answer question:
Figure 5.4
(Figure 5.4) Which of the following statements is TRUE?
A) Fruitcake is an inferior good regardless of income level.
B) Fruitcake is a normal good regardless of income level.
C) Fruitcake is a normal good until income reaches $120, and then it becomes an inferior good.
D) Fruitcake is an inferior good until income reaches $120, and then it becomes a normal good.
Unlock Deck
Unlock for access to all 103 flashcards in this deck.
Unlock Deck
k this deck
12
Use the following to answer question:
Figure 5.8
(Figure 5.8) Refer to Figure 5.8, depicting the consumer's indifference curves and budget constraints. Suppose the consumer has $20 of income to spend on apple and prune juice. Which of the following statement(s) is (are) TRUE?
A) I and II
B) II and III
C) II and IV
D) I
Figure 5.8
(Figure 5.8) Refer to Figure 5.8, depicting the consumer's indifference curves and budget constraints. Suppose the consumer has $20 of income to spend on apple and prune juice. Which of the following statement(s) is (are) TRUE?
A) I and II
B) II and III
C) II and IV
D) I
Unlock Deck
Unlock for access to all 103 flashcards in this deck.
Unlock Deck
k this deck
13
Use the following to answer questions 18-19:
Figure 5.11
(Figure 5.11) When the price of football tickets increases, the substitution effect decreases the number of tickets bought from:
A) 4 to 3.
B) 6 to 3.
C) 6 to 4.
D) 20 to 8.
Figure 5.11
(Figure 5.11) When the price of football tickets increases, the substitution effect decreases the number of tickets bought from:
A) 4 to 3.
B) 6 to 3.
C) 6 to 4.
D) 20 to 8.
Unlock Deck
Unlock for access to all 103 flashcards in this deck.
Unlock Deck
k this deck
14
Use the following to answer questions 18-19:
Figure 5.11
(Figure 5.11) When the price of football tickets increases, the income effect decreases the number of tickets bought from:
A) 4 to 3.
B) 6 to 3.
C) 6 to 4.
D) 20 to 8.
Figure 5.11
(Figure 5.11) When the price of football tickets increases, the income effect decreases the number of tickets bought from:
A) 4 to 3.
B) 6 to 3.
C) 6 to 4.
D) 20 to 8.
Unlock Deck
Unlock for access to all 103 flashcards in this deck.
Unlock Deck
k this deck
15
Ryan's Engel curve for potato chips is I = 300C, where I is weekly income and C measures the number of bags of potato chips. Ryan considers potato chips a(n):
A) inferior good.
B) normal good.
C) inferior good at income levels above $60,000.
D) inferior good at income levels above $30,000.
A) inferior good.
B) normal good.
C) inferior good at income levels above $60,000.
D) inferior good at income levels above $30,000.
Unlock Deck
Unlock for access to all 103 flashcards in this deck.
Unlock Deck
k this deck
16
Use the following to answer question:
Figure 5.7
(Figure 5.7) Based on the consumer's indifference curves and budget constraints, which of the following demand curves reflects the consumer's demand for water park tickets? Assume the consumer has income of $100.
A) Demand curve A
B) Demand curve B
C) Demand curve C
D) Demand curve D
Figure 5.7
(Figure 5.7) Based on the consumer's indifference curves and budget constraints, which of the following demand curves reflects the consumer's demand for water park tickets? Assume the consumer has income of $100.
A) Demand curve A
B) Demand curve B
C) Demand curve C
D) Demand curve D
Unlock Deck
Unlock for access to all 103 flashcards in this deck.
Unlock Deck
k this deck
17
Use the following to answer question:
Figure 5.9
(Figure 5.9) When the price of milk drops, the substitution effect _____ the quantity of milk consumed from _____.
A) increases; 2 to 6 gallons
B) increases; 4 to 6 gallons
C) decreases; 6 to 2 gallons
D) increases; 2 to 4 gallons
Figure 5.9
(Figure 5.9) When the price of milk drops, the substitution effect _____ the quantity of milk consumed from _____.
A) increases; 2 to 6 gallons
B) increases; 4 to 6 gallons
C) decreases; 6 to 2 gallons
D) increases; 2 to 4 gallons
Unlock Deck
Unlock for access to all 103 flashcards in this deck.
Unlock Deck
k this deck
18
Use the following to answer question:
Figure 5.2
(Figure 5.2) Hamburger meat is a(n) _____ good and canned tuna is a(n) _____ good.
A) normal; normal
B) inferior; normal
C) inferior; inferior
D) normal; inferior
Figure 5.2
(Figure 5.2) Hamburger meat is a(n) _____ good and canned tuna is a(n) _____ good.
A) normal; normal
B) inferior; normal
C) inferior; inferior
D) normal; inferior
Unlock Deck
Unlock for access to all 103 flashcards in this deck.
Unlock Deck
k this deck
19
What is the substitution effect of a price change?
A) Consumers will buy more of the good whose relative price has risen and less of the good whose relative price has fallen.
B) When prices fall, consumers will have more purchasing power and buy more of the good whose price has fallen.
C) When prices fall, consumers will have more purchasing power and buy more of all goods.
D) Consumers will consume less of the good whose relative price has risen and more of the good whose relative price has fallen.
Unlock Deck
Unlock for access to all 103 flashcards in this deck.
Unlock Deck
k this deck
20
Use the following to answer questions 5-6:
Figure 5.3
(Figure 5.3) The curve that goes through the points A, B, C, and D is called the:
A) income elasticity curve.
B) optimal consumption path.
C) Engel curve.
D) income expansion path.
Figure 5.3
(Figure 5.3) The curve that goes through the points A, B, C, and D is called the:
A) income elasticity curve.
B) optimal consumption path.
C) Engel curve.
D) income expansion path.
Unlock Deck
Unlock for access to all 103 flashcards in this deck.
Unlock Deck
k this deck
21
Use the following to answer questions 24-25:
Figure 5.14
(Figure 5.14) Because of the income effect associated with the decrease in the price of good X, the quantity of good X purchased:
A) increases from 3 to 4.
B) increases from 4 to 5.
C) decreases from 5 to 4.
D) increases from 3 to 5.
Figure 5.14
(Figure 5.14) Because of the income effect associated with the decrease in the price of good X, the quantity of good X purchased:
A) increases from 3 to 4.
B) increases from 4 to 5.
C) decreases from 5 to 4.
D) increases from 3 to 5.
Unlock Deck
Unlock for access to all 103 flashcards in this deck.
Unlock Deck
k this deck
22
Use the following to answer questions 36-37:
Figure 5.18
(Figure 5.18) Which of the following statements are TRUE?
A) II and III
B) I, III, and IV
C) III and IV
D) I and IV
Figure 5.18
(Figure 5.18) Which of the following statements are TRUE?
A) II and III
B) I, III, and IV
C) III and IV
D) I and IV
Unlock Deck
Unlock for access to all 103 flashcards in this deck.
Unlock Deck
k this deck
23
In 2010, the average household spent $1,178 on telephone services and $333 on nonalcoholic drinks. From this information, we can conclude that:
A) the substitution effect of a price change will be larger for telephone services than for nonalcoholic drinks.
B) an increase in the price of telephone services will cause a larger income effect than a similar increase in the price of nonalcoholic drinks.
C) an increase in the price of nonalcoholic drinks will cause a larger income effect than a similar increase in the price of telephone services.
D) the substitution effect of a price change will be larger for nonalcoholic drinks than for telephone services.
Unlock Deck
Unlock for access to all 103 flashcards in this deck.
Unlock Deck
k this deck
24
Use the following to answer questions 26-28:
Figure 5.15
(Figure 5.15) Because of the income effect associated with the decrease in the price of good X, the quantity of good X purchased:
A) increases from 3 to 5.
B) decreases from 5 to 2.
C) decreases from 3 to 2.
D) decreases from 5 to 3.
Figure 5.15
(Figure 5.15) Because of the income effect associated with the decrease in the price of good X, the quantity of good X purchased:
A) increases from 3 to 5.
B) decreases from 5 to 2.
C) decreases from 3 to 2.
D) decreases from 5 to 3.
Unlock Deck
Unlock for access to all 103 flashcards in this deck.
Unlock Deck
k this deck
25
Use the following to answer question:
Figure 5.17
(Figure 5.17) Given the change in the budget constraint, which of the following statements is TRUE?
A) The demand curve for good Y shifted inward.
B) The demand curve for good X shifted outward.
C) Good X is an inferior good.
D) Good X and good Y are complements.
Figure 5.17
(Figure 5.17) Given the change in the budget constraint, which of the following statements is TRUE?
A) The demand curve for good Y shifted inward.
B) The demand curve for good X shifted outward.
C) Good X is an inferior good.
D) Good X and good Y are complements.
Unlock Deck
Unlock for access to all 103 flashcards in this deck.
Unlock Deck
k this deck
26
Use the following to answer questions 39-40:
Figure 5.19
(Figure 5.19) Given the change in the budget constraint, the demand curve for _____ shifted _____.
A) good X; inward
B) good Y; outward
C) good X; outward
D) both good X and good Y; outward
Figure 5.19
(Figure 5.19) Given the change in the budget constraint, the demand curve for _____ shifted _____.
A) good X; inward
B) good Y; outward
C) good X; outward
D) both good X and good Y; outward
Unlock Deck
Unlock for access to all 103 flashcards in this deck.
Unlock Deck
k this deck
27
The substitution effect of a price increase:
A) causes the consumer to purchase less of the good that is now relatively more expensive.
B) causes the consumer to purchase more of the good whose price has risen.
C) can cause the consumer to purchase either more or less of the good.
D) has no effect on the amount purchased of either good.
A) causes the consumer to purchase less of the good that is now relatively more expensive.
B) causes the consumer to purchase more of the good whose price has risen.
C) can cause the consumer to purchase either more or less of the good.
D) has no effect on the amount purchased of either good.
Unlock Deck
Unlock for access to all 103 flashcards in this deck.
Unlock Deck
k this deck
28
Use the following to answer questions 29-30:
Figure 5.16
(Figure 5.16) The income effect of the price increase causes consumption of baseball hats to:
A) decrease by 1.
B) decrease by 3.
C) decrease by 4.
D) increase by 1.
Figure 5.16
(Figure 5.16) The income effect of the price increase causes consumption of baseball hats to:
A) decrease by 1.
B) decrease by 3.
C) decrease by 4.
D) increase by 1.
Unlock Deck
Unlock for access to all 103 flashcards in this deck.
Unlock Deck
k this deck
29
Use the following to answer questions 26-28:
Figure 5.15
(Figure 5.15) Because of the substitution effect associated with the decrease in the price of good X, the quantity of good X purchased:
A) increases from 3 to 5.
B) decreases from 3 to 2.
C) increases from 2 to 3.
D) increases from 2 to 5.
Figure 5.15
(Figure 5.15) Because of the substitution effect associated with the decrease in the price of good X, the quantity of good X purchased:
A) increases from 3 to 5.
B) decreases from 3 to 2.
C) increases from 2 to 3.
D) increases from 2 to 5.
Unlock Deck
Unlock for access to all 103 flashcards in this deck.
Unlock Deck
k this deck
30
A consumer's bundle includes two normal goods, X and Y. According to the income effect, a(n) _____ in the price of good X or a(n) _____ in the price of good Y will cause the consumer to buy less of good X.
A) increase; decrease
B) increase; increase
C) decrease; increase
D) decrease; decrease
A) increase; decrease
B) increase; increase
C) decrease; increase
D) decrease; decrease
Unlock Deck
Unlock for access to all 103 flashcards in this deck.
Unlock Deck
k this deck
31
Suppose the price of good X, a Giffen good, increases. Which of the following statements are TRUE?
A) I and IV
B) II and IV
C) I and III
D) II and III
A) I and IV
B) II and IV
C) I and III
D) II and III
Unlock Deck
Unlock for access to all 103 flashcards in this deck.
Unlock Deck
k this deck
32
Use the following to answer questions 26-28:
Figure 5.15
(Figure 5.15) What type of good is good X?
A) I and III
B) III
C) II and III
D) I
Figure 5.15
(Figure 5.15) What type of good is good X?
A) I and III
B) III
C) II and III
D) I
Unlock Deck
Unlock for access to all 103 flashcards in this deck.
Unlock Deck
k this deck
33
Use the following to answer questions 39-40:
Figure 5.19
(Figure 5.19) The price of good Y _____, increasing the consumption of both good Y and good X, which are _____.
A) increased; complements
B) decreased; substitutes
C) increased; substitutes
D) decreased; complements
Figure 5.19
(Figure 5.19) The price of good Y _____, increasing the consumption of both good Y and good X, which are _____.
A) increased; complements
B) decreased; substitutes
C) increased; substitutes
D) decreased; complements
Unlock Deck
Unlock for access to all 103 flashcards in this deck.
Unlock Deck
k this deck
34
A consumer's bundle includes the inferior good X and the normal good Y. According to the income effect, a(n) _____ in the price of good X or a(n) _____ in the price of good Y will cause the consumer to buy more of good X.
A) increase; decrease
B) increase; increase
C) decrease; increase
D) decrease; decrease
A) increase; decrease
B) increase; increase
C) decrease; increase
D) decrease; decrease
Unlock Deck
Unlock for access to all 103 flashcards in this deck.
Unlock Deck
k this deck
35
Use the following to answer questions 36-37:
Figure 5.18
(Figure 5.18) Good X and good Y are:
A) perfect complements.
B) Giffen goods.
C) complement goods.
D) substitute goods.
Figure 5.18
(Figure 5.18) Good X and good Y are:
A) perfect complements.
B) Giffen goods.
C) complement goods.
D) substitute goods.
Unlock Deck
Unlock for access to all 103 flashcards in this deck.
Unlock Deck
k this deck
36
Use the following to answer question:
Figure 5.13
(Figure 5.13) Which of the following statements is (are) TRUE?
A) I and II
B) II and III
C) III and IV
D) I
Figure 5.13
(Figure 5.13) Which of the following statements is (are) TRUE?
A) I and II
B) II and III
C) III and IV
D) I
Unlock Deck
Unlock for access to all 103 flashcards in this deck.
Unlock Deck
k this deck
37
Which of the following statements are TRUE?
A) I, II, and IV
B) I and IV
C) II and III
D) III and IV
A) I, II, and IV
B) I and IV
C) II and III
D) III and IV
Unlock Deck
Unlock for access to all 103 flashcards in this deck.
Unlock Deck
k this deck
38
For Sara, ramen noodles are a normal good, however Sean considers ramen noodles to be inferior. If Sara and Sean have the same amount of income:
A) Sean's income effect will be stronger than Sara's income effect.
B) Sean's substitution effect will be stronger than Sara's substitution effect.
C) Sean's demand for ramen noodles will be more price elastic than Sara's.
D) Sean's demand for ramen noodles will be less price elastic than Sara's.
A) Sean's income effect will be stronger than Sara's income effect.
B) Sean's substitution effect will be stronger than Sara's substitution effect.
C) Sean's demand for ramen noodles will be more price elastic than Sara's.
D) Sean's demand for ramen noodles will be less price elastic than Sara's.
Unlock Deck
Unlock for access to all 103 flashcards in this deck.
Unlock Deck
k this deck
39
Use the following to answer questions 29-30:
Figure 5.16
(Figure 5.16) The substitution effect of the price increase causes consumption of baseball hats to:
A) decrease by 1.
B) decrease by 3.
C) decrease by 4.
D) increase by 1.
Figure 5.16
(Figure 5.16) The substitution effect of the price increase causes consumption of baseball hats to:
A) decrease by 1.
B) decrease by 3.
C) decrease by 4.
D) increase by 1.
Unlock Deck
Unlock for access to all 103 flashcards in this deck.
Unlock Deck
k this deck
40
Use the following to answer questions 24-25:
Figure 5.14
(Figure 5.14) Good X is a(n) _____ good, and good Y is a(n) _____ good.
A) normal; inferior
B) normal; normal
C) inferior; inferior
D) inferior; normal
Figure 5.14
(Figure 5.14) Good X is a(n) _____ good, and good Y is a(n) _____ good.
A) normal; inferior
B) normal; normal
C) inferior; inferior
D) inferior; normal
Unlock Deck
Unlock for access to all 103 flashcards in this deck.
Unlock Deck
k this deck
41
Use the following to answer question:
Figure 5.23
(Figure 5.23) In panel (a), the price of good X is $1.50 per unit and the price of good Y is $3 per unit. In panel (b), the consumer's income increased from $400 to $480.
Figure 5.23
(Figure 5.23) In panel (a), the price of good X is $1.50 per unit and the price of good Y is $3 per unit. In panel (b), the consumer's income increased from $400 to $480.
Unlock Deck
Unlock for access to all 103 flashcards in this deck.
Unlock Deck
k this deck
42
Use the following to answer question:
Figure 5.25
(Figure 5.25) Answer the following questions:
Figure 5.25
(Figure 5.25) Answer the following questions:
Unlock Deck
Unlock for access to all 103 flashcards in this deck.
Unlock Deck
k this deck
43
There are 10 consumers in the market, each with the following demand curve: Q = 100 - 0.5P. In a graph of the market demand curve, its slope ( P/ Q) would equal:
A) -0.50.
B) -0.20.
C) -1.50.
D) -2.25.
A) -0.50.
B) -0.20.
C) -1.50.
D) -2.25.
Unlock Deck
Unlock for access to all 103 flashcards in this deck.
Unlock Deck
k this deck
44
To calculate the market demand curve from individual demand curves:
A) vertically sum the individual demand curves.
B) horizontally sum the individual demand curves.
C) exponentiate the individual demand curves.
D) add up the prices of the individual demand curves, holding the quantities constant.
A) vertically sum the individual demand curves.
B) horizontally sum the individual demand curves.
C) exponentiate the individual demand curves.
D) add up the prices of the individual demand curves, holding the quantities constant.
Unlock Deck
Unlock for access to all 103 flashcards in this deck.
Unlock Deck
k this deck
45
Use the following to answer question:
Figure 5.21
(Figure 5.21) Suppose Milli and Vanilli are the only two customers in the market for voice lessons. Milli's demand is QM = 40 - 4P, and Vanilli's demand is QV = 75 - 5P. Which panel represents the market demand for vocal lessons?
A) panel (a)
B) panel (b)
C) panel (c)
D) panel (d)
Figure 5.21
(Figure 5.21) Suppose Milli and Vanilli are the only two customers in the market for voice lessons. Milli's demand is QM = 40 - 4P, and Vanilli's demand is QV = 75 - 5P. Which panel represents the market demand for vocal lessons?
A) panel (a)
B) panel (b)
C) panel (c)
D) panel (d)
Unlock Deck
Unlock for access to all 103 flashcards in this deck.
Unlock Deck
k this deck
46
Blaze has $200 to spend on fishing equipment and fast-food burgers. Fishing equipment is priced at $10 per unit and fast-food burgers are priced at $4 per burger.
Unlock Deck
Unlock for access to all 103 flashcards in this deck.
Unlock Deck
k this deck
47
There are 100 consumers in the market for good X, each with a demand curve given by Q = 2/P. What is the market demand curve for good X?
A) QM = 0.5P
B) QM = 200 - 200P
C) QM = 1/50P
D) QM = 200/P
A) QM = 0.5P
B) QM = 200 - 200P
C) QM = 1/50P
D) QM = 200/P
Unlock Deck
Unlock for access to all 103 flashcards in this deck.
Unlock Deck
k this deck
48
Eugene has $100 to spend on video blackjack at $1 per game and French fries at $1 per basket.
Unlock Deck
Unlock for access to all 103 flashcards in this deck.
Unlock Deck
k this deck
49
Use the following to answer question:
Figure 5.22
(Figure 5.22) Suppose there are only two consumers in the market for good X. The total quantity demanded in the market at a price of $3 is _____, and the total quantity demanded in the market at a price of $12 is _____.
A) 20; 2
B) 20; 5
C) 6; 3
D) 18; 0
Figure 5.22
(Figure 5.22) Suppose there are only two consumers in the market for good X. The total quantity demanded in the market at a price of $3 is _____, and the total quantity demanded in the market at a price of $12 is _____.
A) 20; 2
B) 20; 5
C) 6; 3
D) 18; 0
Unlock Deck
Unlock for access to all 103 flashcards in this deck.
Unlock Deck
k this deck
50
Use the following to answer question:
Figure 5.24
(Figure 5.24) Answer the following questions:
Figure 5.24
(Figure 5.24) Answer the following questions:
Unlock Deck
Unlock for access to all 103 flashcards in this deck.
Unlock Deck
k this deck
51
Sally is one of many consumers in the yellow onion market. Which of the following statements is (are) TRUE?
A) II and III
B) I
C) II
D) III
A) II and III
B) I
C) II
D) III
Unlock Deck
Unlock for access to all 103 flashcards in this deck.
Unlock Deck
k this deck
52
There are only three consumers in the market, and their demand equations are as follows: (1) Q = 5 - 0.5P, (2) Q = 10 - P, and (3) Q = 2 - 0.2P. What is the equation for the market demand curve?
A) P = 30 - 8Q
B) Q = 3.75 - 0.125P
C) Q = 17 - 1.7P
D) Q = 30 - 2P
A) P = 30 - 8Q
B) Q = 3.75 - 0.125P
C) Q = 17 - 1.7P
D) Q = 30 - 2P
Unlock Deck
Unlock for access to all 103 flashcards in this deck.
Unlock Deck
k this deck
53
Suppose that good X and good Y are substitutes and good X and good Z are complements. When the price of a good Y _____ or the price of good Z _____, the demand for good X shifts outward.
A) increases; decreases
B) increases; increases
C) decreases; decreases
D) decreases; increases
A) increases; decreases
B) increases; increases
C) decreases; decreases
D) decreases; increases
Unlock Deck
Unlock for access to all 103 flashcards in this deck.
Unlock Deck
k this deck
54
Suppose the demand for good X shifts in. Which of the following statements is (are) TRUE?
A) I, II, and III
B) II and III
C) I
D) II
A) I, II, and III
B) II and III
C) I
D) II
Unlock Deck
Unlock for access to all 103 flashcards in this deck.
Unlock Deck
k this deck
55
Suppose the market for a good is composed of 1,000 identical consumers. The market's demand curve is given by QM = 150,000 - 25P. What is the equation for an individual consumer's demand curve?
A) Q = 150,000,000 - 25,000P
B) Q = 6,000,000 - 40P
C) Q = 6 - 4P
D) Q = 150 - 0.025
A) Q = 150,000,000 - 25,000P
B) Q = 6,000,000 - 40P
C) Q = 6 - 4P
D) Q = 150 - 0.025
Unlock Deck
Unlock for access to all 103 flashcards in this deck.
Unlock Deck
k this deck
56
Alec has $40 weekly to spend on restaurant meals (priced at $10 per meal) and bowling (priced at $2 per game).
Unlock Deck
Unlock for access to all 103 flashcards in this deck.
Unlock Deck
k this deck
57
Use the following to answer question:
Figure 5.20
(Figure 5.20) The cross-price elasticity of demand for good X with respect to good Y is _____ in panel (a) and _____ in panel (b).
A) zero; negative
B) negative; positive
C) positive; negative
D) negative infinity; positive
Figure 5.20
(Figure 5.20) The cross-price elasticity of demand for good X with respect to good Y is _____ in panel (a) and _____ in panel (b).
A) zero; negative
B) negative; positive
C) positive; negative
D) negative infinity; positive
Unlock Deck
Unlock for access to all 103 flashcards in this deck.
Unlock Deck
k this deck
58
The market for good X consists of only two consumers; their demand curves are given by Q = 10 - 0.10P and Q = 5 - 0.10P. What is the market demand curve?
A) QM = 15 - 0.2P if P $50, and QM = 5 - 0.10P if P < $50
B) QM = 15 - 0.2P if P $50, and QM = 10 - 0.10P if P < $50
C) QM = 15 - 0.2P if P < $50, and QM = 10 - 0.10P if P > $50
D) QM = 15 - 0.2P
A) QM = 15 - 0.2P if P $50, and QM = 5 - 0.10P if P < $50
B) QM = 15 - 0.2P if P $50, and QM = 10 - 0.10P if P < $50
C) QM = 15 - 0.2P if P < $50, and QM = 10 - 0.10P if P > $50
D) QM = 15 - 0.2P
Unlock Deck
Unlock for access to all 103 flashcards in this deck.
Unlock Deck
k this deck
59
Which of the following statements is TRUE?
A) I only
B) II only
C) I, II, and III
D) I and II
A) I only
B) II only
C) I, II, and III
D) I and II
Unlock Deck
Unlock for access to all 103 flashcards in this deck.
Unlock Deck
k this deck
60
The market for macaroni and cheese has only two consumers, David and Wallace. Market demand for macaroni and cheese will tend to be more elastic if:
A) David and Wallace consider macaroni and cheese to be a necessity good rather than a luxury good.
B) David and Wallace consider macaroni and cheese to be an inferior good rather than a normal good.
C) David and Wallace consider macaroni and cheese to be a normal good rather than an inferior good.
D) David and Wallace consider macaroni and cheese to be an economic "bad."
Unlock Deck
Unlock for access to all 103 flashcards in this deck.
Unlock Deck
k this deck
61
Use the following to answer question:
Figure 5.31
(Figure 5.31) Assume that Roscoe and Roland comprise the entire market of buyers.
Figure 5.31
(Figure 5.31) Assume that Roscoe and Roland comprise the entire market of buyers.
Unlock Deck
Unlock for access to all 103 flashcards in this deck.
Unlock Deck
k this deck
62
Use the following to answer question:
Figure 5.33
(Figure 5.33) The consumer has an income of $15 and the utility function U = 5X + 5Y. Before the price change the consumer will consume _____units of Y and _____units of X. After the change, she will consume _____units of Y and _____units of X.
Figure 5.33
(Figure 5.33) The consumer has an income of $15 and the utility function U = 5X + 5Y. Before the price change the consumer will consume _____units of Y and _____units of X. After the change, she will consume _____units of Y and _____units of X.
Unlock Deck
Unlock for access to all 103 flashcards in this deck.
Unlock Deck
k this deck
63
Use the following to answer question:
Figure 5.27
-(Figure 5.27) Illustrate the substitution effect and income effect associated with the decrease in the price of milk. Label the substitution effect A to A' and the income effect A' to B.
Figure 5.27
-(Figure 5.27) Illustrate the substitution effect and income effect associated with the decrease in the price of milk. Label the substitution effect A to A' and the income effect A' to B.
Unlock Deck
Unlock for access to all 103 flashcards in this deck.
Unlock Deck
k this deck
64
Bob's utility function for black (B) and white (W) socks is U = 10B + 10W, where MUB = 10 and MUW = 10. Suppose that Bob has $40 to spend on socks. With the price of white socks held constant at $10, graph Bob's demand curve for black socks at $2, $4, $5, $8, $10, and $20.
Unlock Deck
Unlock for access to all 103 flashcards in this deck.
Unlock Deck
k this deck
65
Ricki, CC, and Brett are the only consumers in the market for leather jackets; their inverse demand curves, respectively, are as follows:
P = 200 - 10QR
P = 200 - 50QCC
P = 200 - 20QB
What is the equation for the market demand curve for leather jackets?
P = 200 - 10QR
P = 200 - 50QCC
P = 200 - 20QB
What is the equation for the market demand curve for leather jackets?
Unlock Deck
Unlock for access to all 103 flashcards in this deck.
Unlock Deck
k this deck
66
For the following scenarios, explain the direction of the substitution effect, income effect, and total effect.
Unlock Deck
Unlock for access to all 103 flashcards in this deck.
Unlock Deck
k this deck
67
A consumer has the following utility function: U = 4X + 2Y, where X is the number of slices of plain pizza and Y is the number of slices of pepperoni pizza. Given this person's preferences, what is the demand curve for slices of plain pizza?
Unlock Deck
Unlock for access to all 103 flashcards in this deck.
Unlock Deck
k this deck
68
Abby's utility function is given by U = X2Y2. For this utility function, MUx = 2XY2 and MUy = 2X2Y. If good X costs $10 and good Y costs $5, what share of Abby's utility-maximizing bundle is made up of good X?
Unlock Deck
Unlock for access to all 103 flashcards in this deck.
Unlock Deck
k this deck
69
Use the following to answer question:
Figure 5.30
(Figure 5.30) The price of good Y increased from $1.00 to $5.00.
Figure 5.30
(Figure 5.30) The price of good Y increased from $1.00 to $5.00.
Unlock Deck
Unlock for access to all 103 flashcards in this deck.
Unlock Deck
k this deck
70
Suppose a consumer spends $100 of income on two goods: buying 4 units of good X (priced at $10) and 3 units of good Y (priced at $20). Both are substitute goods. Using indifference curves and budget constraints, illustrate the effect of a $10 decrease in the price of good Y on the consumer's optimal consumption bundle.
Unlock Deck
Unlock for access to all 103 flashcards in this deck.
Unlock Deck
k this deck
71
Use the following to answer question:
Figure 5.32
(Figure 5.32) Graph the market demand curve for bumper stickers, assuming that Neal and Vince are the only two consumers in the market for bumper stickers. On your graph, show the quantity demanded at $10, $7.50, $5, $2.50, and $0.
Figure 5.32
(Figure 5.32) Graph the market demand curve for bumper stickers, assuming that Neal and Vince are the only two consumers in the market for bumper stickers. On your graph, show the quantity demanded at $10, $7.50, $5, $2.50, and $0.
Unlock Deck
Unlock for access to all 103 flashcards in this deck.
Unlock Deck
k this deck
72
The utility function for a consumer is U = min{0.25X, Y}. What is the equation for the consumer's income expansion path?
Unlock Deck
Unlock for access to all 103 flashcards in this deck.
Unlock Deck
k this deck
73
Use the following to answer question:
Figure 5.29
(Figure 5.29) The price of good Y decreased from $20 to $10.
Figure 5.29
(Figure 5.29) The price of good Y decreased from $20 to $10.
Unlock Deck
Unlock for access to all 103 flashcards in this deck.
Unlock Deck
k this deck
74
Use the following to answer question:
Figure 5.28
-(Figure 5.28) Answer the following questions.
Figure 5.28
-(Figure 5.28) Answer the following questions.
Unlock Deck
Unlock for access to all 103 flashcards in this deck.
Unlock Deck
k this deck
75
A consumer's bundle includes good X and good Y. Determine whether the following statements are true, false, or uncertain.
Unlock Deck
Unlock for access to all 103 flashcards in this deck.
Unlock Deck
k this deck
76
Suppose a consumer spends her income on lobster and frozen pizza. Assume that the consumer has an income of $60, the price of lobster is $6, and the price of frozen pizza is $6.
Unlock Deck
Unlock for access to all 103 flashcards in this deck.
Unlock Deck
k this deck
77
Suppose there are 100 consumers in the computer speaker market, each with an identical demand curve given by Qi = 10 - 0.1P, where P is the price per pair of speakers and Qi measures the quantity demanded of computer speakers by each person. The market supply for computer speakers is given by QS = 20P - 200. What are the equilibrium price and quantity in the computer speaker market?
Unlock Deck
Unlock for access to all 103 flashcards in this deck.
Unlock Deck
k this deck
78
Use the following to answer question:
Figure 5.35
For a constant income, the cross-price elasticity of demand between good X and Y in figure A is _____. In figure B it is _____
Figure 5.35
For a constant income, the cross-price elasticity of demand between good X and Y in figure A is _____. In figure B it is _____
Unlock Deck
Unlock for access to all 103 flashcards in this deck.
Unlock Deck
k this deck
79
Use the following to answer question:
Figure 5.26
(Figure 5.26) This graph shows the demand curve for skirts. Suppose the consumer has $500 to spend on skirts and handbags, and the price of handbags remains unchanged at $100. Using budget constraints and indifference curves, placing skirts on the horizontal axis and handbags on the vertical axis, illustrate two of the consumer's optimal consumption bundles of skirts and handbags.
Unlock Deck
Unlock for access to all 103 flashcards in this deck.
Unlock Deck
k this deck
80
Use the following to answer question:
Figure 5.34
(Figure 5.34) For an income of $15, the price of Y falls by _____, leading to a substitution effect of _____and an income effect of _____ .
Figure 5.34
(Figure 5.34) For an income of $15, the price of Y falls by _____, leading to a substitution effect of _____and an income effect of _____ .
Unlock Deck
Unlock for access to all 103 flashcards in this deck.
Unlock Deck
k this deck
Unlock Deck
Unlock for access to all 103 flashcards in this deck.


